GPU621 Team Tsubame
Contents
[hide]Intel Advisor
Team Member
Progress
October 17, 2016 - Project selection approved.
Notes
What is Intel Advisor?
The Intel Advisor package provides threading advisor and vectorization advisor to assist programmers in finding the possible parallel enhancements in their serial applications written in C, C++, or FORTRAN.
How does it work?
Vectorization Workflow:
Advisor surveys the given binary of an application built in release mode and its source code to determine information such as the time spent processing the instructions in the call stack, the loops that can be vectorized, and the estimates on the merits of vectorizing un-vectorized and under-vectorized loops. You can upgrade the Survey Report to allow it to make better suggestions by collecting additional information through running a Trip Count Analysis to determine the number of times loops and functions are executed; this step is optional. A second run of the Survey Analysis is required after changes are made to the application based on the suggestions in the first Survey Report. If the new report states all loops are vectorized, then the Advisor has completed its job; but this is often not the case in complex programs due to dependencies and memory issues. To resolve these issues, you can mark suspicious sections of the code and use the Dependencies analysis and the Memory Access Patterns (MAP) analysis to identify the causes and make the appropriate changes.
Vectorization Workflow - Simple
Vectorization Workflow - w/ Deeper Analysis
Threading Workflow:
The Threading Workflow also begins with a survey for times and an optional count of invocations to generate the Survey Report. You must add annotations to the source code to identify the sections for the Advisor to try parallelization. With annotations added, Advisor can determine whether the annotated areas are suitable for parallelization and give estimates of the performance boost if the areas are parallelized. Lastly, a Dependencies analysis can identify the data sharing issues within annotated code sections. Similar to the Vectorization Workflow, you can modify the source code and repeat these analyses as necessary to parallelize a serial application.
How do you actually use it?
The following walk-through assumes that you have Visual Studio 2015 and Intel Advisor 2017 installed.
Preparations:
1. Download and unzip Prefix Scan.zip to a preferred location and open it with Visual Studio 2015.
Note: the project/solution does not have to be Prefix Scan; you can still follow the same steps with a different project.
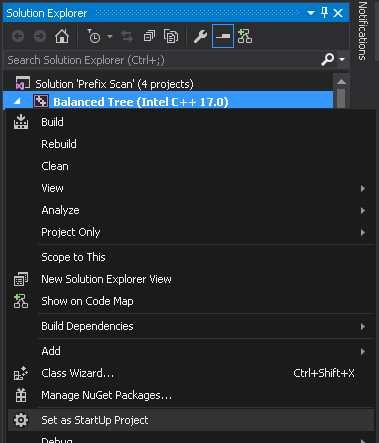
2. Set the Balanced Tree project as StartUp Project.
3. Find the Advisor’s directory by executing the following command in cmd.exe: >set advisor
4. Change the following project properties:
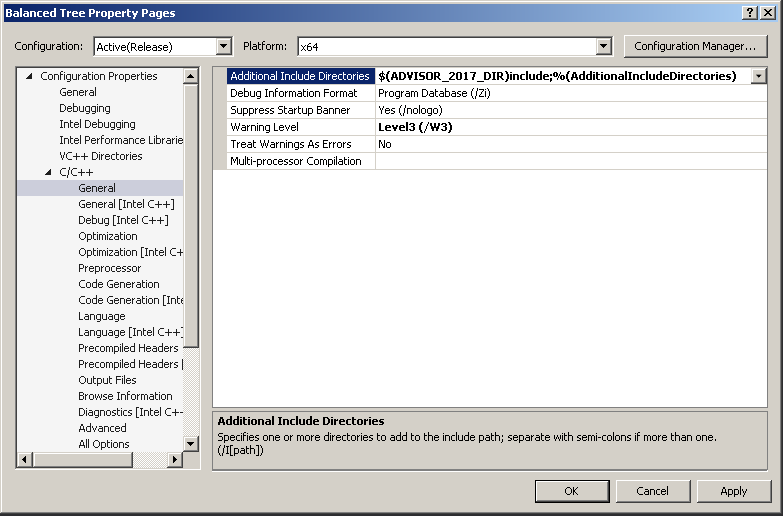
a. In C/C++ > General > Additional Include Directories, add the Advisor’s directory using macro notation: $(ADVISOR_..._DIR)include (or $(ADVISOR_..._DIR)\include if the environment variable does not end with a backslash).

b. In C/C++ > General > Debug Information Format, confirm it is set to Program Database (/Zi).
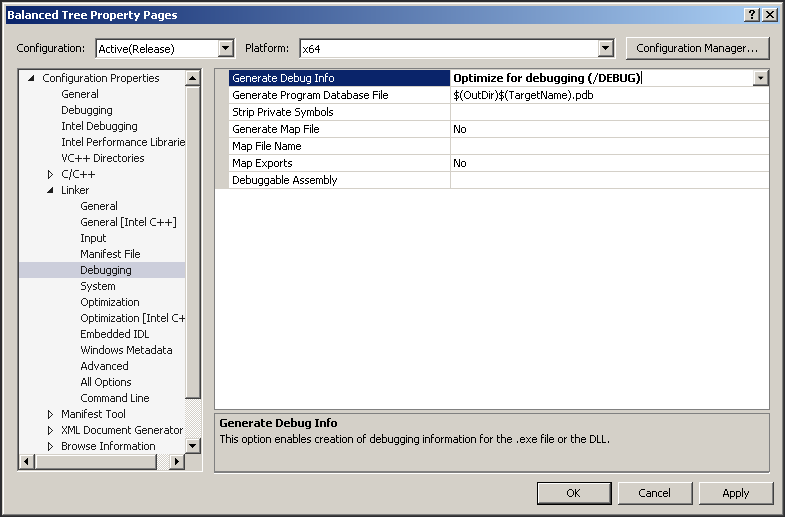
c. In Linker > Debugging > Generate Debug Info, set it to Optimize for debugging (/DEBUG).
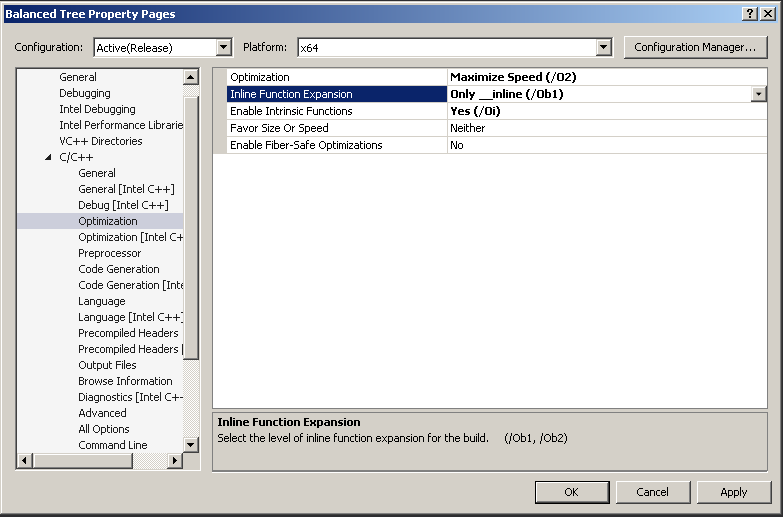
d. In C/C++ > Optimization > Optimization, confirm it is set to Maximize Speed (/O2) or higher.

e. On the same page, set Inline Function Expansion to Only __inline (/Ob1).
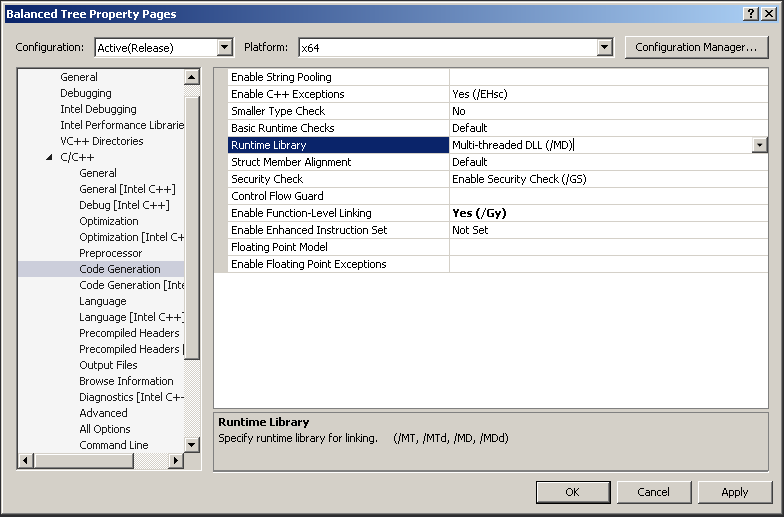
f. In C/C++ > Code Generation > Runtime Library, confirm it has been set to Multi-threaded DLL (/MD); another option is to set this field to Multi-threaded Debug DLL (/MDd).
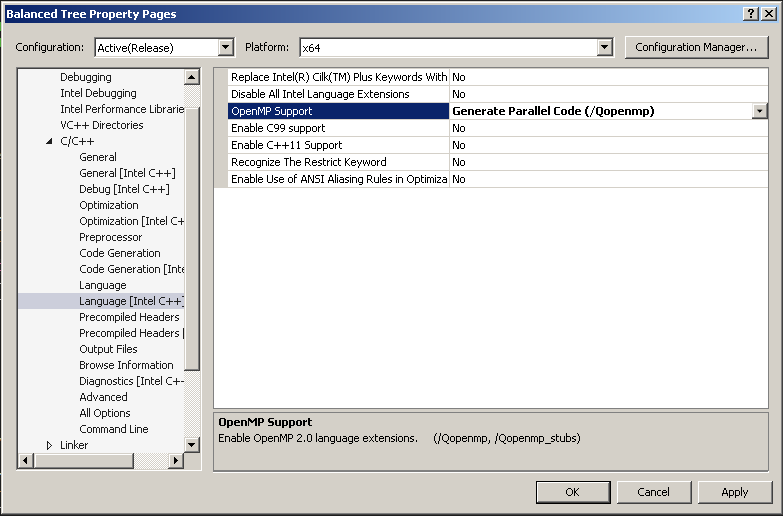
g. Enable OpenMP under C/C++ > Language > OpenMP Support by setting it to Generate Parallel Code (/Qopenmp).
h. Click OK to save the properties.
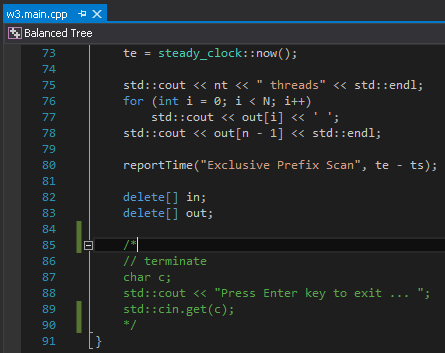
5. Comment out the “terminate” section in w3.main.cpp to end the application without waiting for user input.
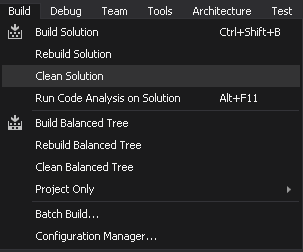
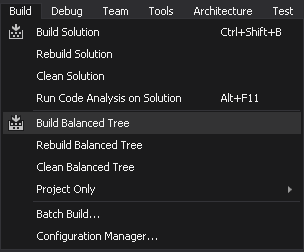
6. Clean the Solution and Build the Project to generate the binary.
7. Launch Advisor through Windows Start > All Programs > Intel Parallel Studio XE 2017 > Analyzers > Advisor 2017
8. Select File > New > Project… to start a new project.
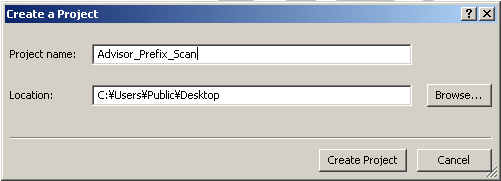
9. Provide a name for the project in the Create a Project window.
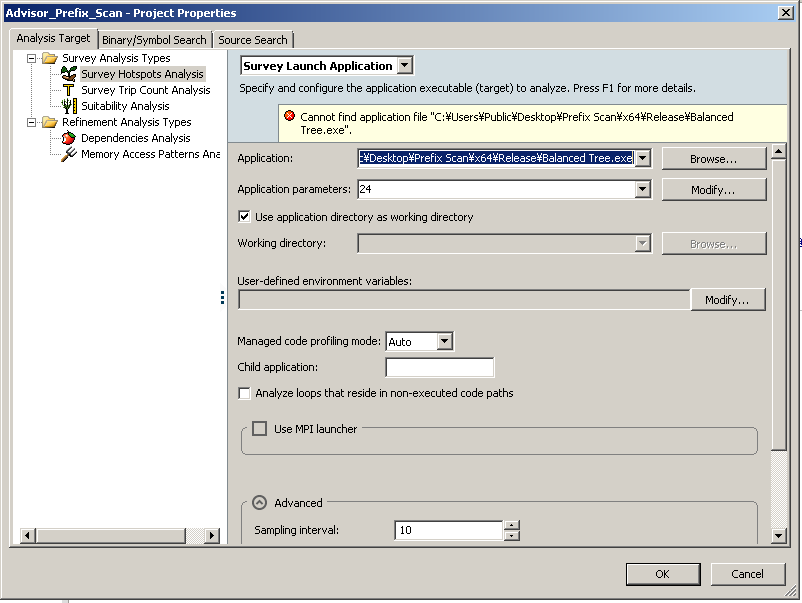
10. Under the Analysis Target tab, add the location of the Balance Tree.exe to the Application field using the Browse… button beside the field (or type the path in manually).
11. In the Application parameters field, add the parameters to use when executing the application.
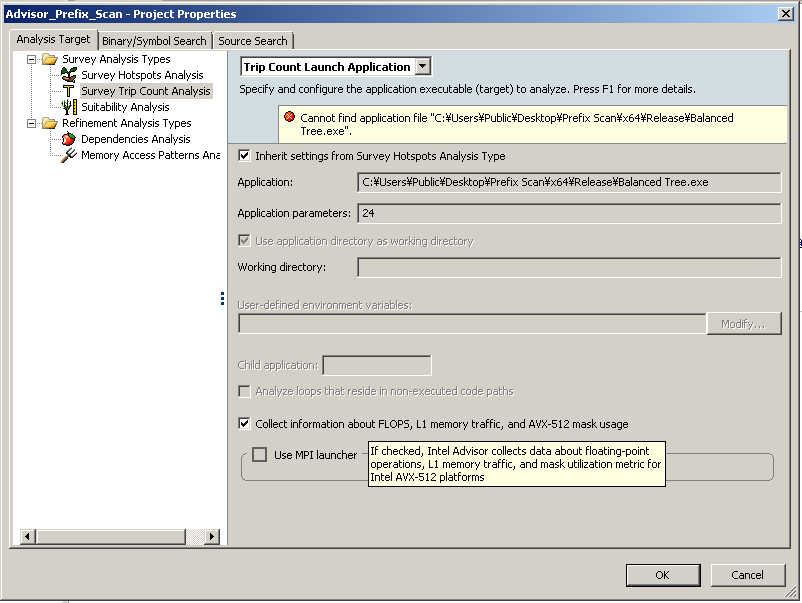
12. Ensure the Inherit settings from Survey Hotspots Analysis Type checkbox is checked in Suitability Analysis and Dependencies Analysis.
13. Check Collect information about FLOPS, L1 memory traffic, and AVX-512 mask usage for a complete Trip Count Analysis; this step is optional.
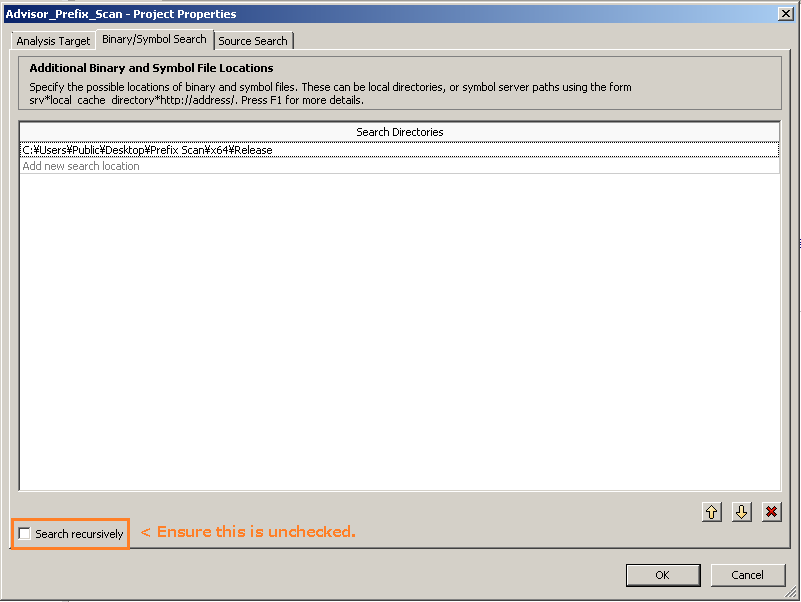
14. Under the Binary/Symbol Search tab, add the visual studio project’s Release folder as a search directory. There will be warnings saying you are missing some symbols during the Survey Analysis, please ignore them.
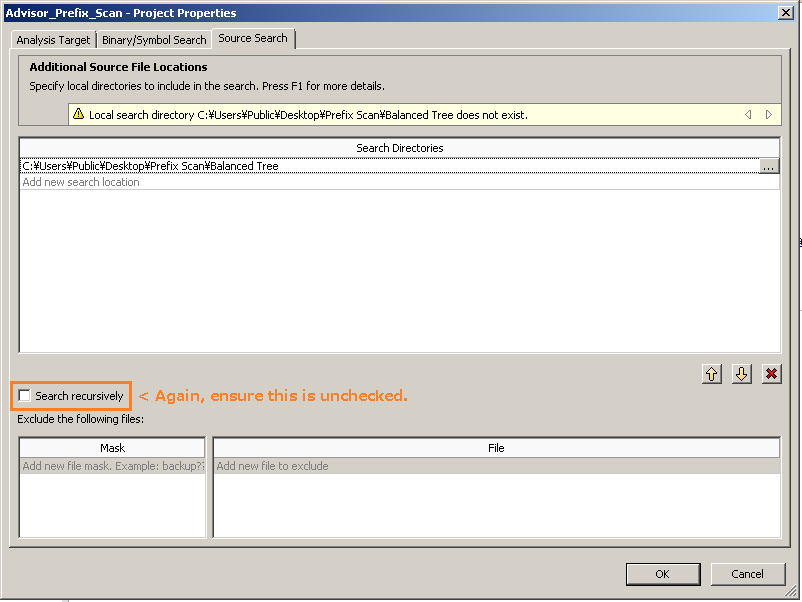
15. Under the Source Search tab, provide the location of the application’s source code.
16. Select OK to complete the project creation process.
Profiling:
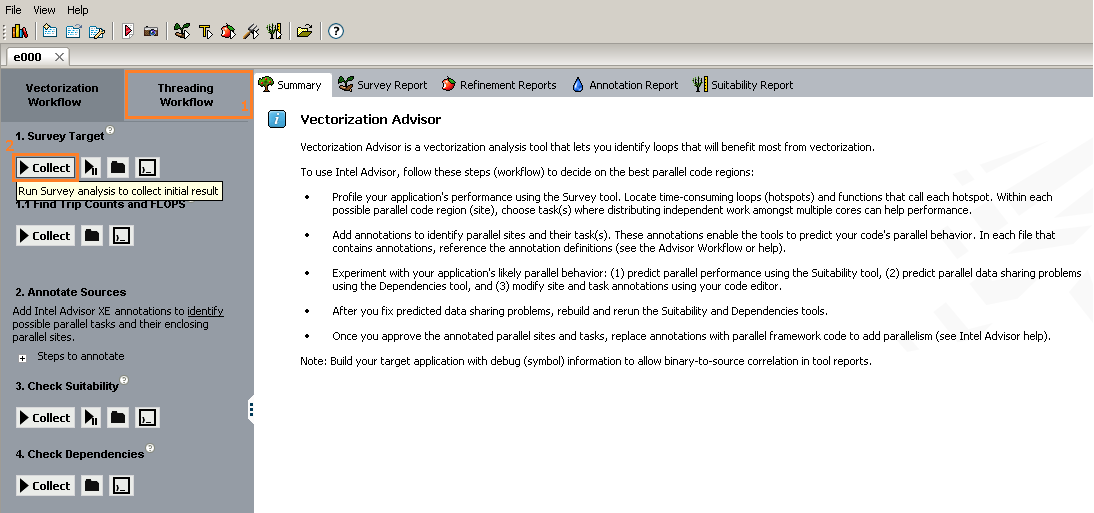
1. Allow Advisor to survey the application by clicking on the Collect button under the Threading Workflow tab (on the left panel).
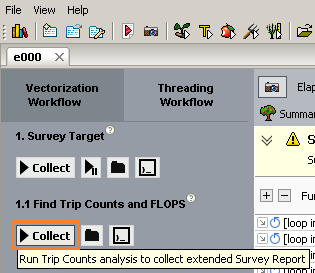
2. Continue profiling by running the Trip Counts and FLOPS analysis.
Further Analysis:
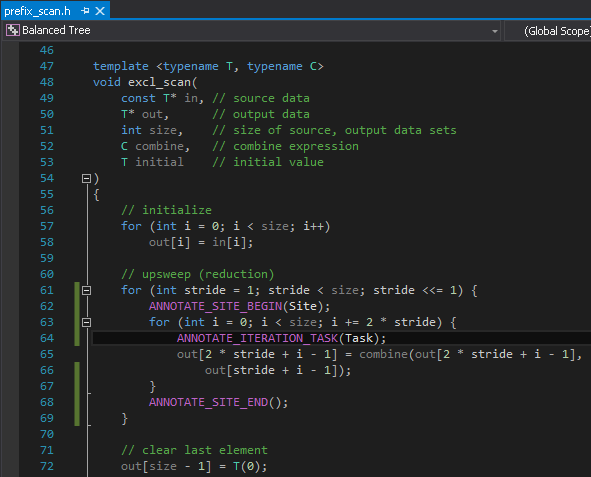
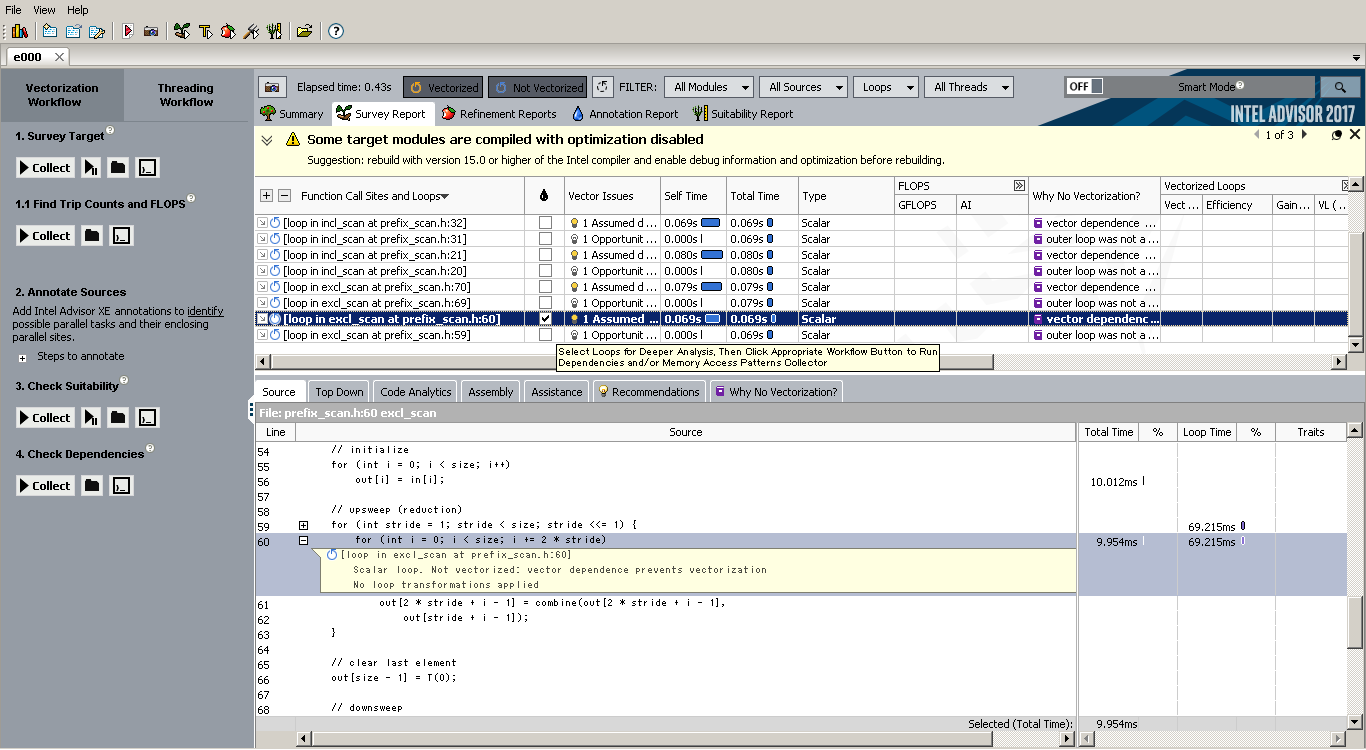
1. Looking at the report, you can pick targets from the list of Function Call Sites and Loops to annotate and determine if they are suitable for parallel framework code. For the purpose of this walkthrough, the inner loop of the upsweep in exclusive scan was chosen as the target for annotations.
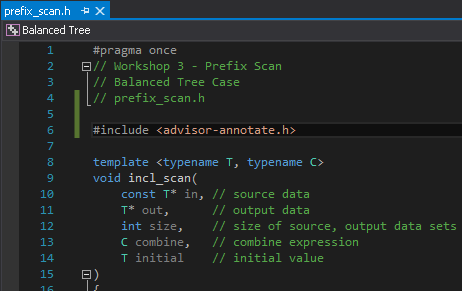
2. To add annotations, include the <advisor-annotate.h> header file.
3. Mark a possible parallel site and task with the following macros:
Here is the syntax for the annotations:

ANNOTATE_SITE_BEGIN(Site 1);

    ANNOTATE_ITERATION_TASK(Task 1.1);

    ANNOTATE_TASK_BEGIN(Task 1.2); ... ANNOTATE_TASK_END;

    ANNOTATE_TASK_BEGIN(Task 1.3); ... ANNOTATE_TASK_END;

ANNOTATE_SITE_END;
4. Rebuild the project and you might need to re-run the Survey Analysis and the (optional) Trip Counts and FLOPS Analysis.
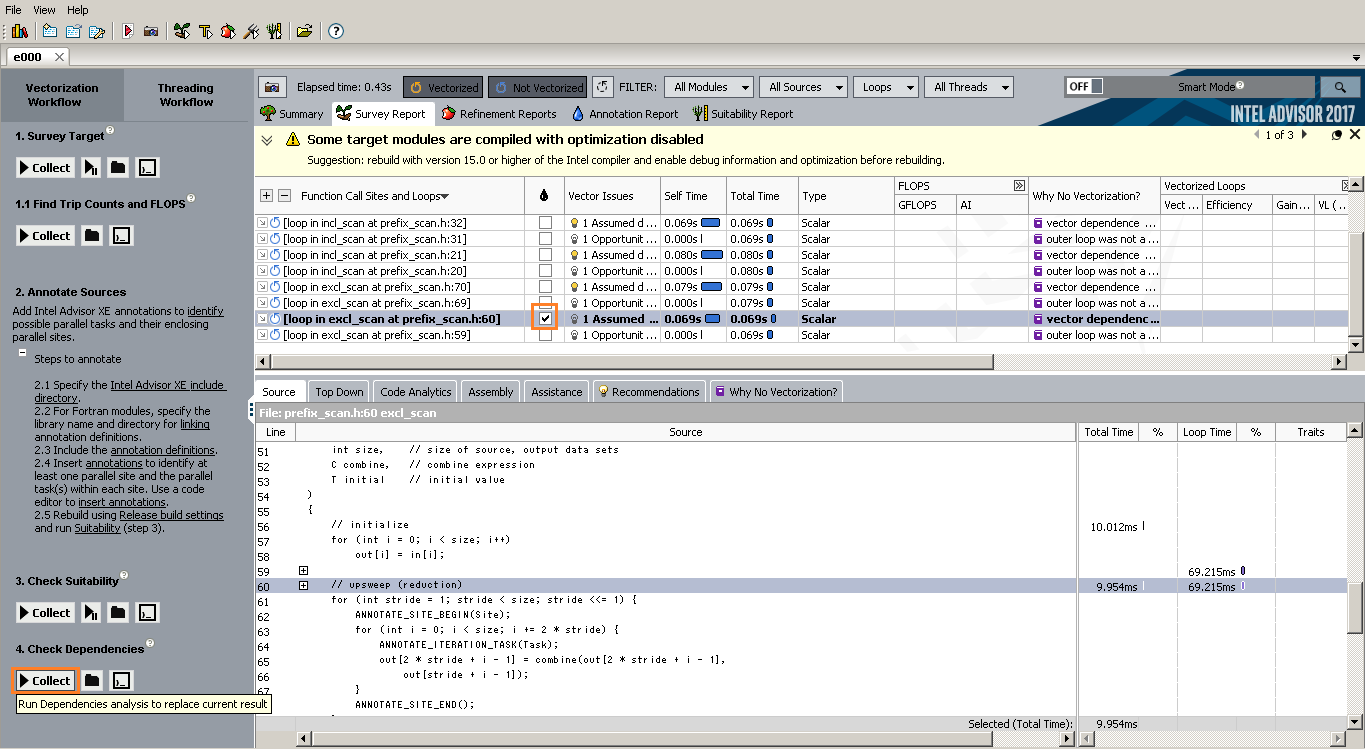
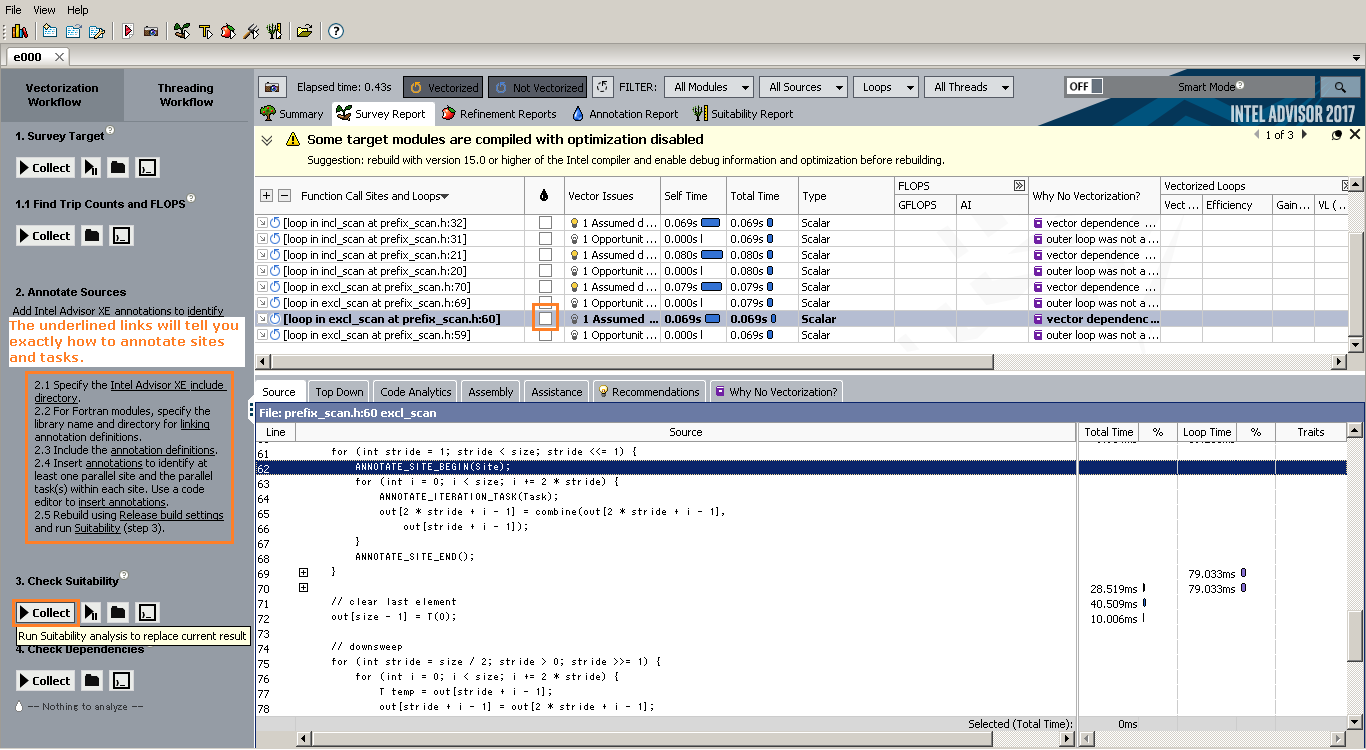
5. Checking the checkboxes beside certain sites will mark them for deeper analyses.
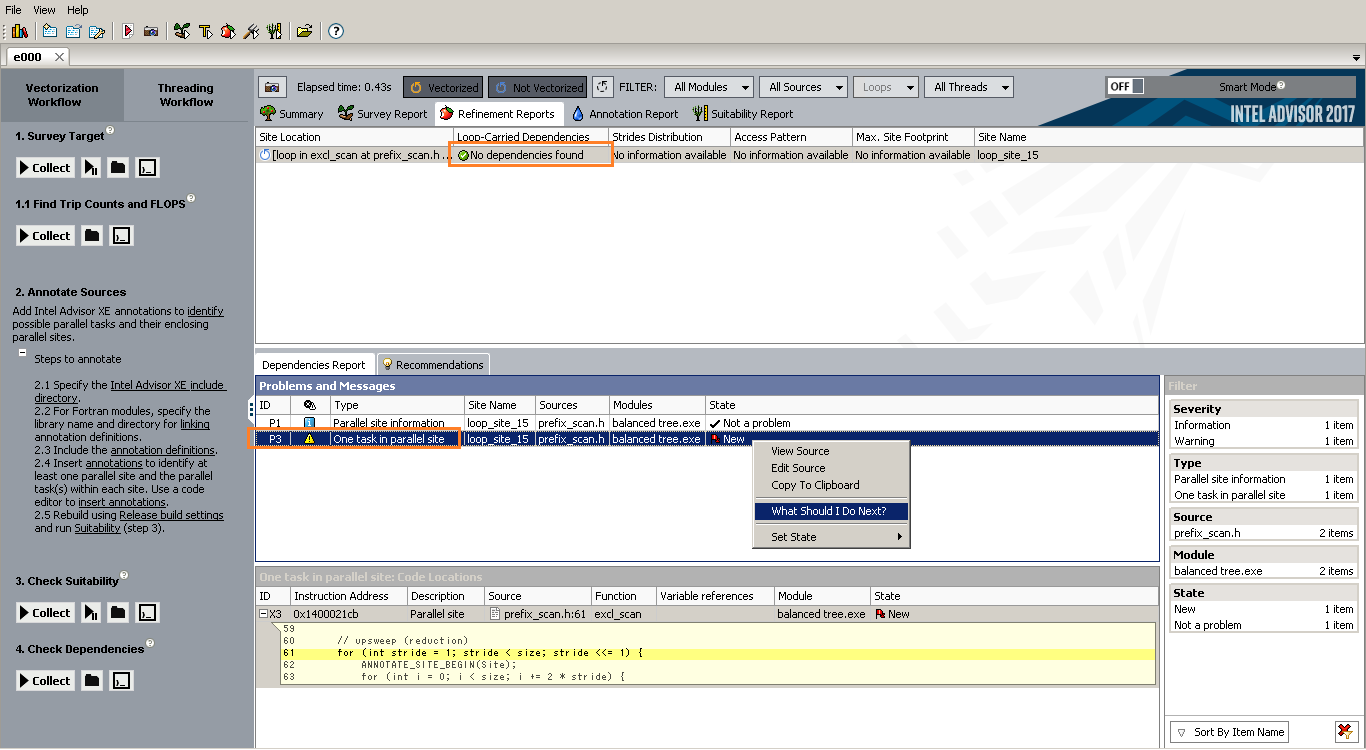
6. With one of the sites checked, run the Dependencies Analysis.
7. For this example, there should be no dependencies. However, this is one warning: One task in parallel site; right click on the warning and select the What Should I Do Next? option.
NOTE: the What Should I Do Next? option is very useful for opening the documentations on the module you are pointing at.
8. Go back to the Survey Report and uncheck the Deeper Analysis checkbox beside the target site.
NOTE: you can mark multiple sites and nest multiple tasks in each site, but the analyses will run longer.
9. Once you have annotated the sites and their tasks, run the Suitability Analysis.
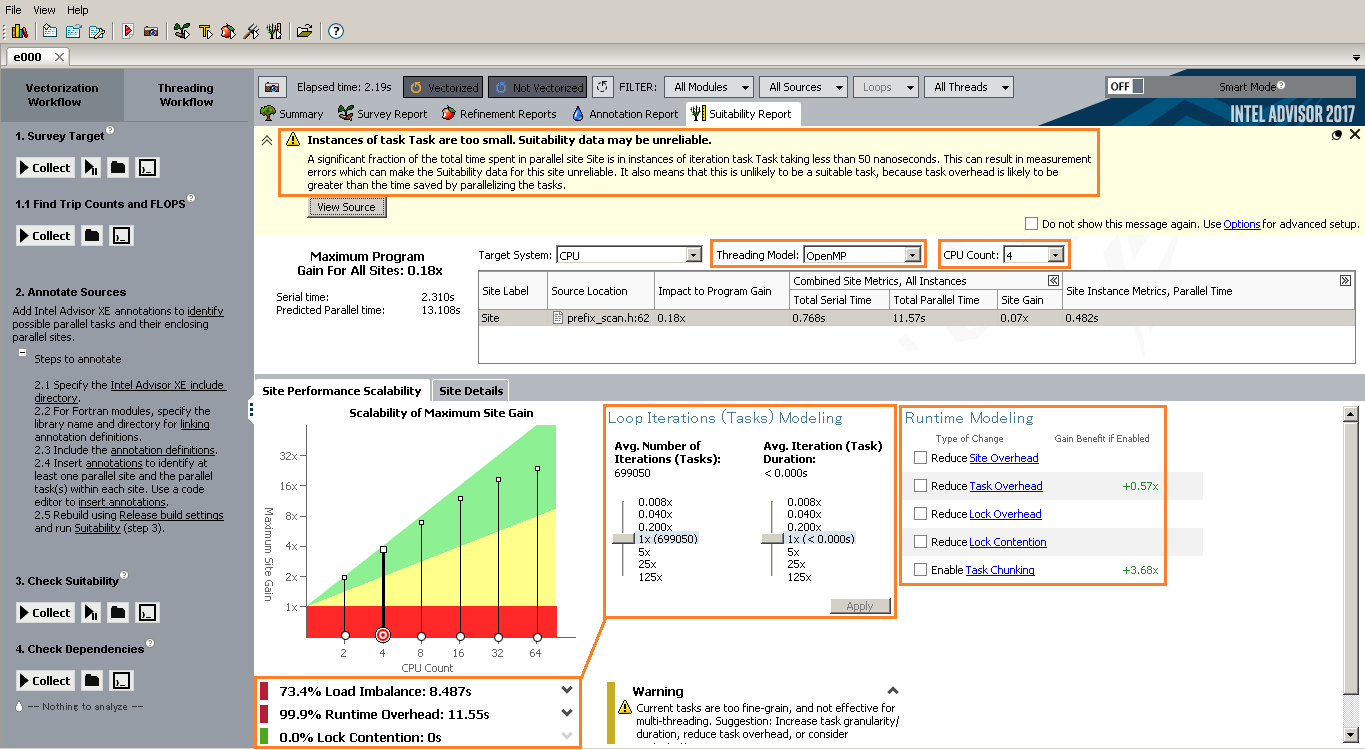
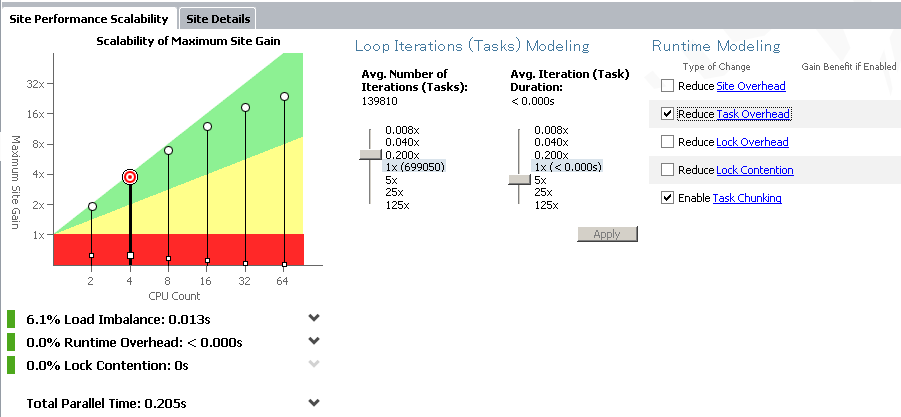
10. Since OpenMP is the focus of this workshop, change the Threading Model to OpenMP. Next, set the CPU Count to the amount of processors available on the machine.
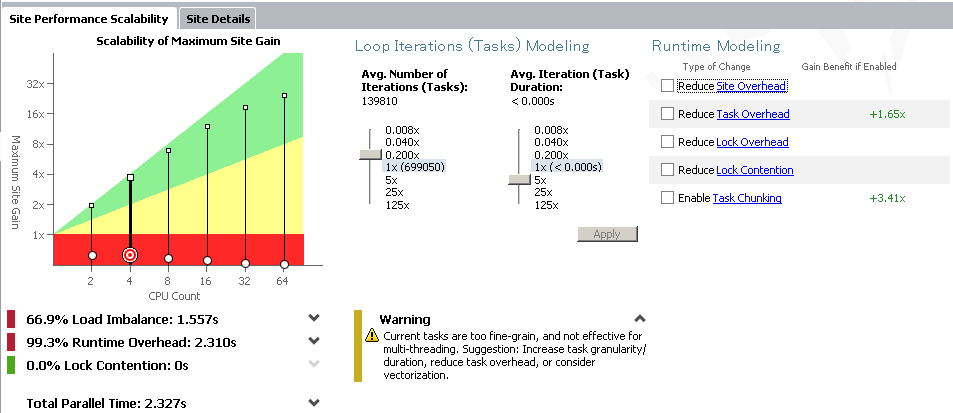
11. Load Imbalance and Runtime Overhead will change as you modify the Avg. Number of Iterations (Tasks) and the Avg. Iteration (Task) Duration sliders and click Apply.
12. Estimated performance will also increase if you check the Runtime Modeling checkboxes that have benefits attached. The blue links will explain the means to enable the enhancements.
Resources
For more information, please refer to the Intel Advisor tutorials at Intel® Advisor Tutorials.
