GPU621/Pragmatic
Contents
- 1 Pragmatic
- 1.1 Group Members
- 1.2 Progress
- 1.3 Notes
- 1.3.1 Debug Multithreaded Applications in Visual Studio
- 1.3.2 Debug Threads and Processes
- 1.3.3 Debug Multiple Processes
- 1.3.4 How to: Use the Threads Window
- 1.3.5 How to: Set a Thread Name
- 1.3.6 How to: Use the Parallel Watch Window
- 1.3.7 Pointers in OpenMP Parallel Region
- 1.3.8 How to: Use the Memory Window
- 1.3.9 Using Parallel Stacks Window
- 1.4 Walkthrough: OpenMP Debugging in Visual Studio
Pragmatic
Group Members
- Vadym Karpenko, Research, and walkthrough (Usage of Debug Location toolbar and Processes, Parallel Watch, and Threads windows).
- Oleksandr Zhurbenko, Research, and walkthrough (Usage of Parallel Stacks window).
Progress
Entry on: October 17th 2016
Group page (Pragmatic) has been created and 3 suggested project topics are being considered (Preference in order specified):
- OpenMP Debugging in Visual Studio - [MSDN Notes]
- Analyzing False Sharing - [Herb Sutter's Article]
- Debugging Threads in Intel Parallel Studio - [Dr Dobbs Article]
Once project topic is confirmed (On Thursday, October 20th 2016, by Professor Chris Szalwinski), group will be able to proceed with topic research.
Entry on: November 1st 2016
Project topic has been confirmed (OpenMP Debugging in Visual Studio - [MSDN Notes]) and team is working on researching material and testing newly acquired knowledge.
Team is considering using Prefix Scan or Convolution workshops for demonstration purposes.
Entry on: November 12th 2016
After extensive testing, our team decided to implement a very simple program (Two processes) that will allow us to take the audience through the entire debugging flow and explain the process incrementally, rather than using workshop examples that are less suited for demonstration purposes.
Notes
- All notes are based on the material outlined in "Debug Multithreaded Applications in Visual Studio" section of MSDN documentation at: https://msdn.microsoft.com/en-us/library/ms164746.aspx and other related MSDN documentation.
Entry on: November 6th 2016 by Vadym Karpenko
Debug Multithreaded Applications in Visual Studio
While parallel processing of multiple threads increases program performance, it makes debugging task harder, since we need to track multiple threads instead of just one (Master thread). Also some potential bugs are introduced with parallel processing, for example, when race condition (When multiple processes or threads try to access same resource at the same time, for more information visit Race Condition Wiki) occurs and mutual exclusion is performed incorrectly, it may create a deadlock condition (When all threads wait for the resource and none can execute, for more info visit Deadlock Wiki), which can be very difficult to debug.
Visual Studio provides many useful tools that make multithreaded debugging tasks easier.
Debug Threads and Processes
A process is a task or a program that is executed by operating system, while a thread is a set of instructions to be executed within a process. A process may consist of one or more threads.
Following are the tools for debugging Threads and Processes in Visual Studio:
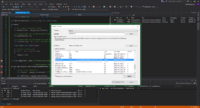
1. Attach to Process (Dialog box) - Allows to attach the Visual Studio debugger to a process that is already running (Select on DEBUG > Attach to Process or press Ctrl + Alt + P);
2. Process (Window) - Shows all processes that are currently attached to the Visual Studio debugger (While debugging select DEBUG > Windows > Processes or press Ctrl + Alt + Z);
3. Threads (Window) - Allows to view and manipulate threads (While debugging select DEBUG > Windows > Threads or press Ctrl + Alt + H);
4. Parallel Stacks (Window) - Shows call stack information for all the threads in the application (While debugging select DEBUG > Windows > Parallel Stacks or press Ctrl + Shift + D, S);
5. Parallel Tasks (Window) - Displays all parallel tasks that are currently running as well as tasks that are scheduled for execution (While debugging select DEBUG > Windows > Parallel Tasks or press Ctrl + Shift + D, K);
6. Parallel Watch (Window) - Allows to see and manipulate the values for one expression executed on multiple threads (While debugging select DEBUG > Windows > Parallel Watch > Parallel Watch 1/2/3/4 or press Ctrl + Shift + D, 1/2/3/4);
7. GPU Threads (Window) - Allows to examine and work with threads that are running on the GPU in the application that is being debugged (While debugging select DEBUG > Windows > GPU Threads);
8. Debug Location (Toolbar) - Allows to manipulate processes and threads while debugging the application (Select on VIEW > Toolbars > Debug Location);
Above mentioned tools can be classified as follows:
- The primary tools for working with processes are the Attach To Process dialog box, the Processes window, and the Debug Location toolbar;
- The primary tools for working with threads are the Threads window and the Debug Location toolbar.
- The primary tools for working with multithreaded applications are the Parallel Stacks, Parallel Tasks, Parallel Watch, and GPU Threads windows.
NOTE: While debugging OpenMP in Visual Studio, we will be using Processes, Parallel Watch, Threads, and Parallel Stacks windows, and the Debug Location toolbar.
Debug Multiple Processes
Configuration:
- Multiple processes execution behaviour can can be configured by selecting DEBUG > Options, and in Options dialog by checking/un-checking "Break all processes when one process breaks" checkbox under Debugging > General tab;
- When working with multiple projects in one solution, startup project (One or many) can be set by right clicking on solution and selecting Properties option (Or selecting a solution in Solution Explorer and pressing Alt + Enter), then (In Property pages dialog) selecting appropriate action for each project in the solution under Common Properties > Startup Project tab;
- To change how Stop Debugging affects attached processes, open to Processes window (Crtl + Alt + Z), right click on individual process and check/un-check the "Detach when debugging stopped" check box;
Entry on: November 9th 2016 by Vadym Karpenko
How to: Use the Threads Window
Threads window columns:
- The flag column - can be used to flag a thread for special attention;
- The active thread column - indicates an active thread (Yellow arrow), and the thread where execution broke into debugger (Black arrow);
- The ID column - displays identifier of the thread;
- The Managed ID column - displays managed identifier for managed threads;
- The Category column - displays category of the thread, for example, Main Thread or Worker Thread;
- The Name column - displays name of the thread;
- The Location column - displays where the thread is running (Can be expanded to provide full call stack for the thread);
- The Priority column - displays assigned (By system) priority for the thread;
- The Suspended Count column - displays suspended count value (Suspended count indicates whether a thread is suspended or not. If suspend count value is 0, a thread is NOT suspended);
- The Process Name column - displays the process name to which each thread belongs;
How to: Set a Thread Name
Thread name can be set using SetThreadName function provided by Microsoft:
#include <windows.h>

...

// This function is taken from https://msdn.microsoft.com/en-us/library/xcb2z8hs.aspx
// Usage: SetThreadName ((DWORD)-1, "Enter thread name here");
const DWORD MS_VC_EXCEPTION = 0x406D1388;

#pragma pack(push,8)

typedef struct tagTHREADNAME_INFO
{
	DWORD dwType; // Must be 0x1000.
	LPCSTR szName; // Pointer to name (in user addr space).
	DWORD dwThreadID; // Thread ID (-1=caller thread).
	DWORD dwFlags; // Reserved for future use, must be zero.
} THREADNAME_INFO;

#pragma pack(pop)

void SetThreadName(DWORD dwThreadID, const char* threadName)
{
	THREADNAME_INFO info;

	info.dwType = 0x1000;
	info.szName = threadName;
	info.dwThreadID = dwThreadID;
	info.dwFlags = 0;

#pragma warning(push)

#pragma warning(disable: 6320 6322)

	__try
	{
		RaiseException(MS_VC_EXCEPTION, 0, sizeof(info) / sizeof(ULONG_PTR), (ULONG_PTR*)&info);
	}
	__except (EXCEPTION_EXECUTE_HANDLER) {}

#pragma warning(pop)
}
NOTE: When using -1 as a thread identifier argument, a thread that calls this function will have it's name changed as per second argument.
How to: Use the Parallel Watch Window
Parallel Watch window columns:
- The flag column - can be used to flag a thread for special attention;
- The frame column - indicates the selected frame (Yellow arrow);
- The configurable column - displays value for the expression;
Entry on: November 15th 2016 by Vadym Karpenko
Pointers in OpenMP Parallel Region
When debugging OpenMP in Visual Studio, you may encounter a situation when the values of your pointers in Watch, Parallel Watch, and Locals windows become either garbage, when debugging in Release mode, or display <Unable to read memory> error (With 0xcccccccc memory address), when debugging in Debug mode (0xcccccccc memory address is a dedicated memory address for uninitialized stack memory, in other words, this is where all uninitialized pointers point to in memory, for more information visit Magic Number (Programming) Wiki). It can take hours or even days to find the root cause and the solution that can address this unexpected behaviour.
This behaviour is caused, because when entering a parallel region, pointers that were initizalied prior to entering the parallel region are now pointing to new, uninitialized, memory address, but only while in parallel region and only for Watch, Parallel Watch, and Locals windows. Operationally, all pointers will have their initialized values as you would expect. However, such behaviour makes it very hard to monitor pointers while debugging in parallel region.
This is where Memory window comes to the rescue.
Pointers can be monitored by tracking the memory address of each pointer before entering the parallel region.
How to: Use the Memory Window
To access Memory window select DEBUG > Windows > Memory > Memory 1/2/3/4 (Only during debugging).
To monitor the expression, select the expression in source code and drag it into Memory window (For variable, simply double click on the variable in the source code and drag selected text into Memory window). Alternatively, expression (Or address) can be entered into the Address field (In Memory window).
To change the format of memory contents, right click in the Memory window and select corresponding format.
To monitor live changes (To refresh Memory window automatically) in Memory window, right click in the Memory window and select Reevaluate Automatically.
Entry on: November 16th 2016 by Oleksandr Zhurbenko
Using Parallel Stacks Window
Parralel Stacks window consists of 2 main views: Threads View and Tasks View.
Threads View shows the call stack information for all the threads in your application in a very convenient form, and Tasks View shows call stacks of System.Threading.Tasks.Task objects.
While you can get a lot of information from MSDN, Daniel Moth, one of the Microsoft's evangelists published a great video on Parallel Stacks feature. I would highly recommend watching it.
To enable the Parallel Stacks window while debugging you should go to Debug -> Windows -> Parallel Stacks
Parallel Stacks allows you to follow the path of the each thread to optimize or debug your parallel program. Also, if you use it together with the Threads window - you can flag some threads in the Threads window and only those flagged threads will be displayed in the Parallel Stacks window.
Most of the additional options of the Parallel Stacks window is available after you right click on one of the modules.
Here are the features which are worth mentioning:
- Flag/Unflag threads which can be useful if you don't keep Threads window open.
- Freeze/Thaw - freezes and thaws a current item accordingly.
- Go to Source Code - navigates you to the Source Code responsible for the selected item/function.
- Switch to Frame - if you have 2 threads in one module, for example, you can switch between them to see a specific context.
- Go to Disassembly - navigates you to the Assembly code responsible for the chosen item.
- Hexadecimal Display - toggles between decimal and Hexadecimal displays.
Last but not least, if you hover over a function/method - you can see some information about it. To choose what you want to be displayed - you are supposed to right-click anywhere in the Parallel Stacks window and choose your options, which allow you to:
- Show Module Names
- Show Parameter Types
- Show Parameter Names
- Show Parameter Values
- Show Line Numbers
- Show Byte Offsets
Walkthrough: OpenMP Debugging in Visual Studio
Part I: Project configuration and debugging a simple application using Processes, Threads, and Parallel Watch windows (By Vadym Karpenko)
Before we proceed, please ensure that you have installed following items:
- Visual Studio (Visual Studio 2015 Community Edition was used for this walkthrough);
- Intel C++ Compiler (Version 17.0 was used for this walkthrough);
When it comes to debugging a multithreaded application, project configuration is an essential factor that may affect the debugging process in most unpredictable ways. For instance, if your project is using optimization, you may notice that some of your breakpoints are being skipped (Or simply invisible) during debugging process. In most of the scenarios, this is an unacceptable behaviour during application development phase, since you may want to track your application's state and behaviour at every stage of the execution. This is why we will begin this walkthrough with configuring our walkthrough projects.
Project Configuration
Open Visual Studio and select New Project... under Start tab (Or select FILE > New > Project...).
In New Project dialog, make sure that Visual C++ sub-section is selected under Templates section (In the leftmost window), then select Empty Project template (In the middle window). Enter the name of the project "Part ONE" (Name field) as well as solution name "GPU621 Walkthrough" (Solution name field). Click OK to continue.
Debugging a multithreaded application involves keeping tack of processes and threads that belong to each process (A single instance of a program). To better illustrate relationship between processes and threads, our walkthrough solution includes two projects (Processes) that will run at the same time.
To add a new project to our solution, right click on solution (Solution 'GPU621 Walkthrough' (1 project)) in the Solution Explorer window and select Add > New Project..., then, in Add New Project dialog, enter the name of the project "Part TWO" (Name field) and ensure that Empty Project template is selected under Visual C++ sub-section. Click OK to continue.
If everything went well, you will see two projects ("Part ONE" and "Part TWO") under our solution (Solution 'GPU621 Walkthrough' (2 projects)).
Now we need to add source files for each project in our solution. Right click on project "Part ONE" in Solution Explorer and select Add > New Item. In Add New Item - Part ONE dialog, ensure that C++ File (.cpp) template is selected, then enter the name of the source file "mainPartOne" (We want to keep source file names different for "Part ONE" and "Part TWO" projects to avoid the confusion between processes during debugging) and click OK to continue. Copy the contents of the source file from Part I walkthrough into our newly created file and save the file (Shortcut Ctrl + S). Now add new source file to "Part TWO" project. Name the source file "mainPartTwo" and copy the contents of the source file from Part II walkthrough into it. Dont forget to save the file.
Now our solution has two projects that can be executed independently. However, if we start our solution (With or without debugging), only one process (Project "Part ONE") will start, and this is not what we want. We want both processes (Project "Part ONE" and project "Part TWO") to start at the same time. For that to happen, we need to configure our solution.
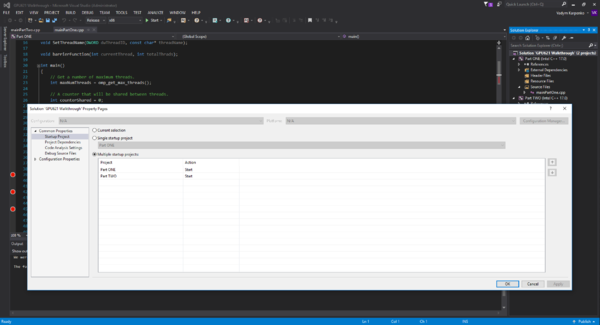
To select startup projects, right click on our solution (Solution 'GPU621 Walkthrough' (2 projects)) and select Properties (Shortcut Alt + Enter when solution is selected). In Solution 'GPU621 Walkthrough' Property Pages dialog, select Multiple startup projects radio button and choose Start action for both projects (Project "Part ONE" and project "Part TWO") under Common Properties section and Startup Project sub-section. Click Apply then OK to continue.
At this point, selecting DEBUG > Start Debugging (Shortcut F5) or Start Without Debugging (Shortcut Crtl + F5) will start both processes (Project "Part ONE" and project "Part TWO"), and this is exactly what we want.
Excellent, next step is to enable Intel C++ Compiler. Right click on our solution (Solution 'GPU621 Walkthrough' (2 projects)) and select Intel Compiler > Use Intel C++. In Use Intel C++ dialog click OK. Do not rebuild the solution, since it will generate errors, because we did not enable OpenMP support yet.
We need to enable OpenMP support, but before we start configuring our projects, we need to switch our solution to Release mode configuration and then configure both projects in Release mode.
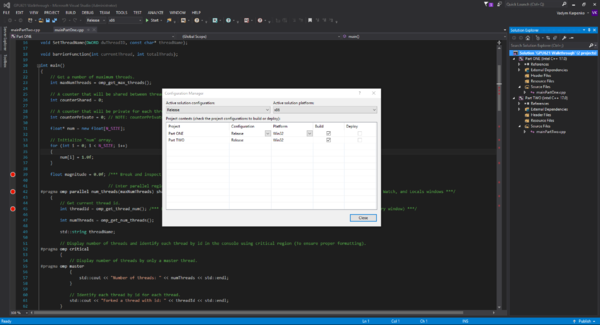
To switch our solution to Release mode configuration, right click on our solution (Solution 'GPU621 Walkthrough' (2 projects)) and select Configuration Manager.... In Configuration Manager dialog, select Release from Active solution configuration dropdown and click Close to continue.
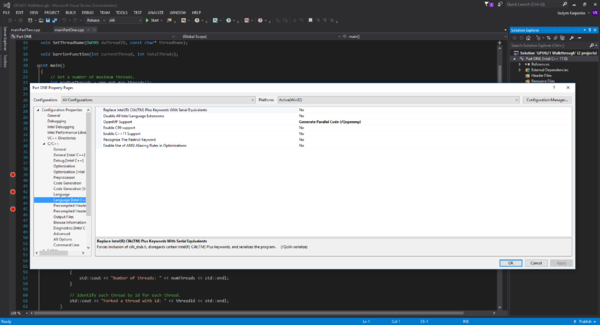
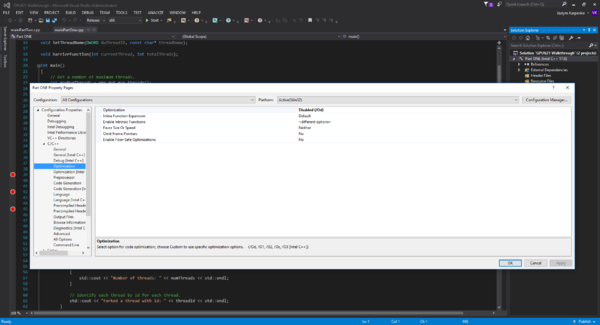
Now it is time to enable OpenMP support and disable optimization for both projects. Right click on project "Part ONE" in Solution Explorer and select Properties (Shortcut Alt + Enter when project "Part ONE" is selected). In Part ONE Property Pages dialog, expand Configuration Properties and select Language [Intel C++] sub-section under C/C++ section (In the leftmost window), then enable OpenMP support by selecting Generate parallel Code (/Qopenmp) from OpenMP Support dropdown. Next, select Optimization sub-section under C/C++ section, and disable optimization by selecting Disabled (/Od) from Optimization dropdown. Finally, enable OpenMP support and disable optimization for project "Part TWO" as we just did for project "Part ONE".
NOTE: Since we will be referring to the specific lines of code by its line numbers, it is important you enable line numbers in your Visual Studio (If it's not enabled already). To enable line numbers, select TOOLS > Options..., then in Options dialog expand Text Editor section and select All Languages sub-section in the leftmost window. On the right side you will see Line Numbers as one of the checkboxes. Ensure that it is checked and click OK.
Walkthrough
With both projects configured, we can start debugging our application. So lets begin with setting up the breakpoints in "mainPartOne" source file. For the purpose of this walkthrough, we would need to set up 10 breakpoints in "mainPartOne" source file on each line that contains /*** Break ... ***/ comment (Lines Numbers: 39, 42, 45, 79, 93, 101, 117, 137, 151, and 161). Once all the break points are in place, run the solution by selecting DEBUG > Start Debugging (Shortcut F5) and wait until the execution breaks at our first breakpoint.
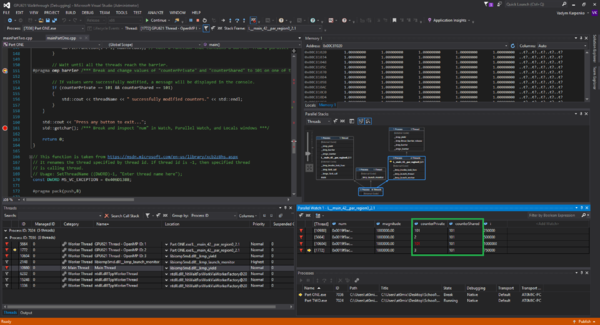
At this point we need to enable tools that we will be using during debugging process. We will be taking advantage of the Threads, Processes, and Parallel Watch windows. Additionally, the Debug Location toolbar can be used to assist with debugging multiple threads. So lets enable these tools right now:
- To enable Processes window, select DEBUG > Windows > Processes or press Ctrl + Alt + Z;
- To enable Threads window, select DEBUG > Windows > Threads or press Ctrl + Alt + H;
- To enable Parallel Watch window, select DEBUG > Windows > Parallel Watch > Parallel Watch 1/2/3/4 or press Ctrl + Shift + D, 1/2/3/4;
- To enable Debug Location toolbar, select VIEW > Toolbars > Debug Location;
NOTE: It is important to position each window in a way that will allow to minimize switching between tabs to access required window information. In other words, you want to see all of the tools, that we just enabled, on the screen at the same time.
Assuming that the execution stopped at a breakpoint on line 39, we should discuss Processes window and Location Debug toolbar while both process are running.
Processes window allows us to view available processes, see current process, and switch between processes. It also allows us to attach, detach, and terminate process.
Debug Location toolbar allows us switch between processes, threads within processes, and available call stack frames. It also allows to flag threads and toggle between Show Only Flagged Threads and Show All Threads modes.
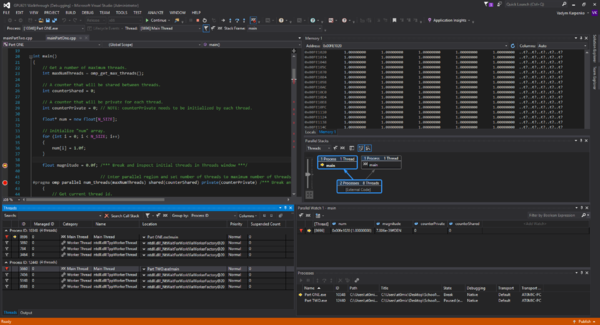
Now lets take a look at the Threads window, where we should see all active threads. Depending on the system, you may see either one thread called Main Thread, or Main Thread and one or more system threads. Since we only care about the Main Thread at this point, lets highlight it (Flag it) by clicking on the flag icon in the leftmost column. Flagging our threads will help us to distinguish between our threads and system threads. It is always a good idea to flag the threads that are important and require a special attention. Click Continue or press F5 to proceed to the next breakpoint.
On line 42 we are entering a parallel region. This is where all the magic happens! However, before entering a parallel region, we should look at something very interesting... We declared and initialized five variables, some of which we will be using in a parallel region during our debugging process. We are interested in counterShared, counterPrivate, num, and magnitude variables. So lets add these variables to our Parallel Watch window, so we can monitor what happens to each variable on each thread. To add a variable to the Parallel Watch window, you can either right click on the variable that you wish to add and select Add to Parallel Watch option, or you can enter the name of the variable directly into Parallel Watch by clicking on <Add Watch> column header and entering the name of the variable. Add all four variables to the Parallel Watch.
NOTE: Since num is an array/pointer, we can only see the value of its first element. We can change that by double clicking on the num header (Or other array/pointer name) in the Parallel Watch window and appending ", {size}" to the name of the array/pointer (For example, if we wish to see first ten elements of the num array, we would change "num" to "num, 10").
Pay close attention to the value of the num array/pointer, because it is about to change as we enter the parallel region. Click Continue or press F5 to continue.
At this point you will notice that new threads are being forked (You may have to click Continue or press F5 a couple of times). While on line 45, you will notice two things:
- Now there are multiple rows in the Parallel Watch window, which means that multiple threads are being watched at the same time;
- Look at the value of the num array/pointer in the Parallel Watch window, it has changed and no longer valid. You probably think that this behaviour will break our program, but no, our program will be executed as expected with previously initialized values. However, we will not be able to monitor any array/pointer (That declared and initialized before entering a parallel region) using Watch, Parallel Watch, or Locals windows while in parallel region. This is where we can take advantage of the Memory window (Discussed at the end of this walkthrough). Click Continue or press F5 to proceed to the next breakpoint (Next breakpoint is on line 79, so you may have to click Continue or press F5 multiple times).
We need to flag all the remaining threads that appear in the Parallel Watch window by clicking on the flag icons in the leftmost column.
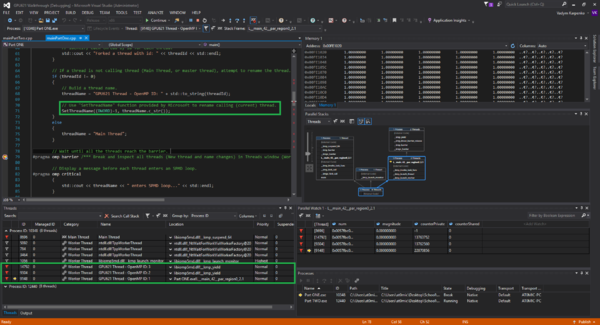
You will notice that threads that reach line 79 have their name changed to "GPU621 Thread - OpenMP ID: {OpenMP thread id}" (We take advantage of Microsoft's "void SetThreadName(DWORD dwThreadID, const char* threadName)" function to change the name of the thread). Ensure that all the flagged threads (Except "Main Thread") have their names changed (You may have to click Continue or press F5 multiple times). Changing the name of the thread may be very useful when debugging a multithreaded application with many threads, especially when using sorting by Name feature of the Threads window. Click Continue or press F5 to proceed to the next breakpoint.
On line 93 we can observe the accumulation into the thread private variable sum on each thread by using Parallel Watch window. After hitting the breakpoint on line 93 for the first time, you may notice that current thread (Yellow arrow in Threads, and Parallel Watch windows indicate a current thread) has sum variable initialized to 0.0f, while other threads may have random (Garbage) value for sum variable. This happens because other threads did not reach line 87 (sum declaration and initialization). You can observe the accumulation into sum on each thread later, when the execution hits line 93 breakpoint again.
It is important to understand what is happening in the following block of code (Line 95 to line 105), because it contains a common mistake that many new developers make when working with OpenMP. This block of code will be executed by each thread once at the most due to its condition, and all it will does is increments the counterShared once per thread and accumulates the result into counterPrivate. Therefore, if counterPrivate is initialized to 0, it will always be equal to counterShared per thread. So the expression on line 101 (if (counterPrivate != counterShared)) should never be true.
NOTE: We initialize both counters (counterPrivate and counterPrivate) to 0 on lines 26 and 29. Then on line 42 we pass both counters to the parallel region as private (private(counterPrivate)) and shared (shared(counterShared)) variables.
Click Continue or press F5 to proceed to the next breakpoint (You may want to disable the breakpoint on line 93 after observing the accumulation into sum on different threads).
Once we hit the breakpoint on line 101, we can see that it will not be evaluated to true, since counterPrivate was not initialized and contains random (Garbage) value. Therefore, the expression on line 101 may or may not evaluate to true. The behaviour is unpredictable at this point and it is likely that we will hit the compiler intrinsic breakpoint (__debugbreak ()) on line 103, which is just a way to show that things could go wrong going forward.
Go ahead and click Continue or press F5 to see what happens.
So why counterPrivate is not initialized properly when we did initialize it on line 29, just before entering the parallel region. Well, it appears that we need to initialize it separately for each thread after entering a parallel region.
Lets uncomment line 89 to resolve this issue and try again. Now the expression on line 101 will never evaluate to true, and this is what we want.
Click Continue or press F5 until you reach a breakpoint on line 117 for the first time. Parallel Watch window observe the accumulation of thread private sum into shared magnitude variable. Click Continue or press F5 until execution breaks on line 137.
Now lets see how #pragma omp parallel for breaks up the work between threads. This can be done by adding i into Parallel Watch. Do it now, and observe its values change as you hold F5 or click Continue many times. You will see that the initial value of i is different on each thread, but how different? Look at N_SIZE value... The work is equally divided. Awesome!
When you are ready to proceed, remove the breakpoint on line 137 and click Continue or press F5 multiple times to pass the barrier on line 151.
If everything went well, your program should get stuck. Introducing a deadlock condition (When none of the threads can execute, for more info visit Deadlock Wiki). In this example, deadlock condition occurs, because one of the threads encounters one more barrier than the other threads. Therefore, barrier can never be placed inside parallel for region. Reference: Frequent Parallel Programming Errors.
Lets stop the execution and modify the expression to bypass this issue. On line 145, change the expression for (int i = 0; i <= numThreads; i++) to for (int i = 0; i < numThreads; i++). Now deadlock condition should not occur. Keep in mind that this is not a solution, but a workaround. You must NOT place barrier inside parallel for region.
Now run the solution again and click Continue or press F5 until you reach line 151.
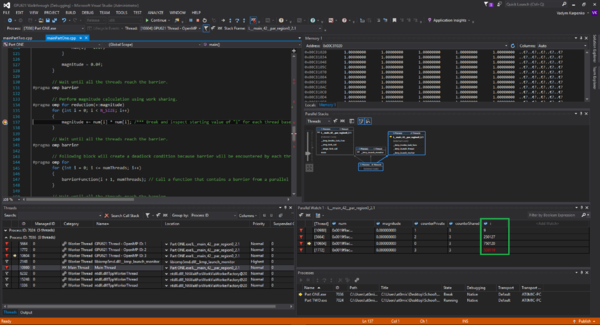
One last thing that is worth mentioning about Parallel Watch window is the fact that variable values can be modified as we debug our program. Change the values of counterShared and counterPrivate (On each thread) variables to 101 by double clicking on variable values in the Parallel Watch window and modifying the value.
After clicking Continue or pressing F5 you will see that expression on line 154 (if (counterPrivate == 101 && counterShared == 101)) evaluates to true.
On line 161, check the value of num array/pointer. Incredible, it is initialized again, just like on line 39. Actually, is has always been there and the best way to see that is to use Memory window.
Enable Memory window by selecting DEBUG > Windows > Memory > Memory 1/2/3/4.
Now restart our program, but make sure that there is a breakpoint on line 39. Once you hit the breakpoint on line 39, type "num" into Address field in Memory window and hit Enter. Then right click on the Memory window and select 32-bit Floating Point. Now you should see values of num array/pointer while you are in parallel region.
This concludes part one of this walkthrough.
Source Code
// Line 1
// Prepared by Vadym Karpenko
// Debugging OpenMP (Without Parallel Stacks)

// This program is using "Vector Magnitude - SPMD - Critical Version" and "Vector Magnitude - Work Sharing Version" examples.
// Source: https://scs.senecac.on.ca/~gpu621/pages/content/omp_1.html

#include <iostream>
#include <string>
#include <omp.h>
#include <windows.h>
#include <intrin.h> // Include for __debugbreak();

#define N_SIZE 1000000

void SetThreadName(DWORD dwThreadID, const char* threadName);

void barrierFunction(int currentThread, int totalThrads);

int main()
{
	// Get a number of maximum threads.
	int maxNumThreads = omp_get_max_threads();

	// A counter that will be shared between threads.
	int counterShared = 0;

	// A counter that will be private for each thread.
	int counterPrivate = 0; // NOTE: counterPrivate needs to be initialized by each thread.

	float* num = new float[N_SIZE];

	// Initialize "num" array.
	for (int i = 0; i < N_SIZE; i++)
	{
		num[i] = 1.0f;
	}

	float magnitude = 0.0f; /*** Break and inspect initial threads in Threads window ***/

							// Enter parallel region and set number of threads to maximum number of threads.
#pragma omp parallel num_threads(maxNumThreads) shared(counterShared) private(counterPrivate) /*** Break and inspect "num" in Watch, Parallel Watch, and Locals windows ***/
	{
		// Get current thread id.
		int threadId = omp_get_thread_num(); /*** Break and inspect "num" in Watch, Parallel Watch, and Locals windows again (Track with Memory window) ***/

		int numThreads = omp_get_num_threads();

		std::string threadName;

		// Display number of threads and identify each thread by id in the console using critical region (To ensure proper formatting).
#pragma omp critical
		{
			// Display number of threads by only a master thread.
#pragma omp master
			{
				std::cout << "Number of threads: " << numThreads << std::endl;
			}

			// Identify each thread by id for each thread.
			std::cout << "Forked a thread with id: " << threadId << std::endl;
		}

		// If a thread is not calling thread (Main Thread, or master thread), attempt to rename the thread.
		if (threadId != 0)
		{
			// Build a thread name.
			threadName = "GPU621 Thread - OpenMP ID: " + std::to_string(threadId);

			// Use "SetThreadName" function provided by Microsoft to rename calling (current) thread.
			SetThreadName((DWORD)-1, threadName.c_str());
		}
		else
		{
			threadName = "Main Thread";
		}

		// Wait until all the threads reach the barrier.
#pragma omp barrier /*** Break and inspect all threads (New thread and name changes) in Threads window (Worker and monitor threads) ***/

		// Display a message before each thread enters an SPMD loop.
#pragma omp critical
		{
			std::cout << threadName << " enters SPMD loop..." << std::endl;
		}

		float sum = 0.0f;

		//counterPrivate = 0; // Uncomment this to initialize private variable.

		for (int i = threadId; i < N_SIZE; i += numThreads)
		{
			sum += num[i] * num[i]; /*** Break and inspect thread private varuable ("sum") accumulation in Parallel Watch window ***/

			if (counterShared == threadId)
			{
				counterShared++;

				counterPrivate += counterShared;

				if (counterPrivate != counterShared) /*** Break and inspect thread shared and private varuables ("counterShared" and "counterPrivate") change each time a new thread reaches this point in Parallel Watch window ***/
				{
					__debugbreak();
				}
			}
		}

		// Accumulate into "magnitude" and display a message when each thread leaves an SPMD loop.
#pragma omp critical
		{
			magnitude += sum;

			std::cout << threadName << " left SPMD loop..." << std::endl;
		}

		// Wait until all the threads reach the barrier.
#pragma omp barrier /*** Break and inspect "magnitude" accumulation in Parallel Watch window ***/

#pragma omp master
		{
			// Reset "magnitude" and "num" array values on master thread.
			for (int i = 0; i < N_SIZE; i++)
			{
				num[i] = 1.0f;
			}

			magnitude = 0.0f;
		}

		// Wait until all the threads reach the barrier.
#pragma omp barrier

		// Perform magnitude calculation using work sharing.
#pragma omp for reduction(+:magnitude)
		for (int i = 0; i < N_SIZE; i++)
		{
			magnitude += num[i] * num[i]; /*** Break and inspect starting value of "i" for each thread based on "N_SIZE" in Parallel Watch window ***/
		}

		// Wait until all the threads reach the barrier.
#pragma omp barrier

		// Following block will create a deadlock condition because barrier will be encountered by each thread more than once (One of the threads will encounter barrier twice).
#pragma omp for
		for (int i = 0; i <= numThreads; i++)
		{
			barrierFunction(i + 1, numThreads); // Call a function that contains a barrier from a parallel for region.
		}

		// Wait until all the threads reach the barrier.
#pragma omp barrier /*** Break and change values of "counterPrivate" and "counterShared" to 101 on one of the threads in Parallel Watch window ***/

		// If values were successfully modified, a message will be displayed in the console.
		if (counterPrivate == 101 && counterShared == 101)
		{
			std::cout << threadName << " successfully modified counters." << std::endl;
		}
	}

	std::cout << "Press any button to exit...";
	std::getchar(); /*** Break and inspect "num" in Watch, Parallel Watch, and Locals windows ***/

	return 0;
}

// This function is taken from https://msdn.microsoft.com/en-us/library/xcb2z8hs.aspx
// It renames the thread specified by thread id. If thread id is -1, then specified thread
// is calling thread.
// Usage: SetThreadName ((DWORD)-1, "Enter thread name here");
const DWORD MS_VC_EXCEPTION = 0x406D1388;

#pragma pack(push,8)

typedef struct tagTHREADNAME_INFO
{
	DWORD dwType; // Must be 0x1000.
	LPCSTR szName; // Pointer to name (in user addr space).
	DWORD dwThreadID; // Thread ID (-1=caller thread).
	DWORD dwFlags; // Reserved for future use, must be zero.
} THREADNAME_INFO;

#pragma pack(pop)

void SetThreadName(DWORD dwThreadID, const char* threadName)
{
	THREADNAME_INFO info;

	info.dwType = 0x1000;
	info.szName = threadName;
	info.dwThreadID = dwThreadID;
	info.dwFlags = 0;

#pragma warning(push)

#pragma warning(disable: 6320 6322)

	__try
	{
		RaiseException(MS_VC_EXCEPTION, 0, sizeof(info) / sizeof(ULONG_PTR), (ULONG_PTR*)&info);
	}
	__except (EXCEPTION_EXECUTE_HANDLER) {}

#pragma warning(pop)
}

// barrierFunction() function allows to create deadlock condition.
void barrierFunction(int currentThread, int totalThrads)
{
#pragma omp critical
	{
		std::cout << "Thread number " << currentThread << " reached barrierFunction()" << std::endl;
	}

	// Wait until all the threads reach the barrier.
#pragma omp barrier
}
Part II: Debugging a simple application using the Parallel Stacks window (By Oleksandr Zhurbenko)
Walkthrough
In this part we will show you how to use Parallel Stacks window and how it can help you find bugs and trace the flow of the program containing multiple threads.
First of all - copy and paste the source code of the simple program we added below to the mainPartTwo.cpp file. We will be referring to line numbers further below, so it's important that the "// FIRST LINE" comment is actually at the first line of the mainPartTwo.cpp file.
We'd like to say a few words about our program. We kept it simple, it consists of 11 functions + main function. In the main function we create a parallel region, send Master thread (with threadId == 0) to one place, and the rest of the threads is split between functions A() and B(). All the even threadIds go to A(), and all the odd threadIds go to B(). A() and B() in their turns create one more fork and split the threads further into a few functions, which makes a nice looking diagram in the Parallel Stacks window.
Alright, our program contains 2 bugs, let's find them together!
1. Put breakpoints to the lines: 59, 106, 116, 122, 132, 138, 148, 154, 164, 169, 179, 185, 195, 201, 211, 219, 227, 231, 240.
2. Debug -> Start Debugging to start our program in a debug mode. It will launch 2 terminals, you can close the terminal for the partOne at this point, you don't need it anymore.
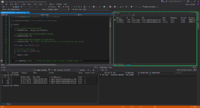
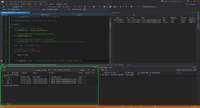
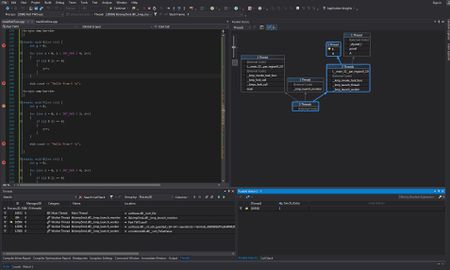
3. Next step would be to open Parallel Stacks window. Once you run the application in the Debug mode - go to Debug -> Windows -> Parallel Stacks and give it some space (see Main Project Window screenshot below), otherwise the diagram will be too small.
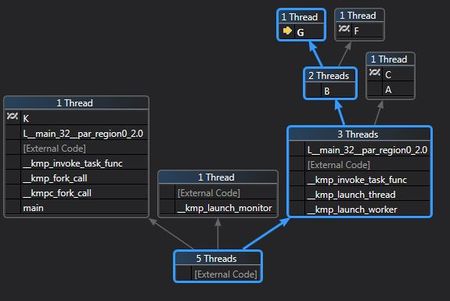
4. At this point you should be able to see something similar to our Main project Window screenshot (above). In the Parallel Stacks window we can see that in the root we have a box with 5 threads. In fact it is just 4 threads. The fifth thread is related to debugging, it stays in the __kmp_launch_monitor task till the end of the program. As you can see 1 thread went to the left, this is our Master thread with id == 0. And the rest, which is just 2 threads in our case (third hasn't been created yet), went to the right. Then they split and one went to function A() and another went to function B(). A, B, F etc - are function names, we kept it simple. Also, you can see on the screenshot (and hopefully in your Visual Studio as well) - in the top right box, in the function A is says "External Code". Our function A invoked printf() to print a Hello message in the console, and this is how it is displayed in the Parallel Stacks window.
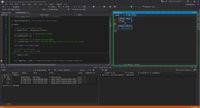
5. Let's hit Continue(or F5) button 3 times. Now you should be able to see something similar to the Program Flow screenshot (below) in your Parallel Stacks window. This is how you can trace and see what each thread is currently doing. In our case Master thread went to the left and is currently in the function K(). 3 other threads went to the right, one of them wen to A() and further to C(), and the other 2 threads got into B() which then split them and sent to functions G() and F().
6. Click Continue button 6 more times, observe the changes and stop here for a moment (give it some time between the clicks since there are long for loops which can take 1-3 seconds to execute). While you were going through the breakpoints you probably saw how our Master thread went from function L to function K, functions C() and G() executed #pragma omp barrier statements and are in a waiting mode now, and you saw that our function F() finished its work and went back to main.
7. Keep clicking Continue let's say 4 times and observe the changes in the Parallel Stacks window. Do you see a bug?
| See the answer |
|---|
| Our Master thread keeps going between functions L() and K(). This is an infinite loop and you just traced it using Parallel Stacks window! |
8. Let's fix this bug. Let's go to the line 51, remove a comment from the J() function call and comment out the call to K() function at the line 52.
9. One bug left. Now stop the program and run it in the debug mode again so that you didn't have this infinite loop in the program anymore. Don't forget to close the partOne terminal.
10. Once you run it - hit the Continue button 7 times and observe the changes. You should be able to see how our Master thread went to J() function instead of the infinite loop between K() and L(). Also, you can see that blocks with functions G(), C(), and our Master thread (which went to J() ) executed barriers.
11. Hit Continue once again. At this point you should see your application getting stuck. You can't click Continue anymore, nothing's happening in the console. This is our second bug - which is also another example of Deadlock, the worst bug in the parallel programming, since it's so difficult to trace it.
12. Our Parallel Stacks window could give us a hint in this particular case. Before you broke your application - you saw how functions J(), G() and C() invoked barriers, but F() didn't. What's happening is that functions J(), G() and C() were waiting for F() to join them, but F() doesn't have a #pragma omp barrier statement, so F() just passes by without letting them know that it has finished its work, but they keep waiting.
13. Add #pragma omp barrier statement to the line 165 and go through the application again. Everything is supposed to work now.
You fixed both bugs from the Part 2, congratulations!
Last but not least, you can try to run this application with 8 threads if your CPU allows it. You will see a bigger picture of the program in the Parallel Stacks. To do this:
- check how many CPU Cores you have. In Windows 7 you can do this by going to Task Manager (Ctrl + Shift + Esc) -> Performance. Count the number of boxes under CPU Usage History, if you have 4 - you don't need to change anything. - If it's 8 - you might want to change our default number of threads from 4 to 8 at the line 30, here:
omp_set_num_threads(4);
Source Code
// FIRST LINE

#include <iostream>
#include <iomanip>
#include <omp.h>

int funcA_status = true;
int funcB_status = true;
int funcC_status = true;
int funcD_status = true;
int funcE_status = true;
int funcF_status = true;
int funcG_status = true;
int funcH_status = true;

static void A(int tid);
static void B(int tid);
static void C(int tid);
static void D(int tid);
static void E(int tid);
static void F(int tid);
static void G(int tid);
static void H(int tid);
static void J(int tid);
static void K(int tid);
static void L(int tid);

int main(int argc, char** argv) {

	omp_set_num_threads(4);

#pragma omp parallel shared(funcA_status, funcB_status, funcC_status, funcD_status, funcE_status, funcF_status, funcG_status, funcH_status)
	{
		int threadId = omp_get_thread_num();
		int numThreads = omp_get_num_threads();

		if (threadId == 0)
		{
			std::cout << "\nnumThreads = " << numThreads << std::endl;
		}
		if (threadId != 0) {
			if (threadId % 2 == 0) {
				A(threadId);
			}
			else {
				B(threadId);
			}
		}
		else
		{
			//J(threadId);
			K(threadId);
		}
	}

	// terminate
	char c;
	std::cout << "Press Enter key to exit ... ";
	std::cin.get(c);
}

static void A(int tid) {

	printf("Hi from Function A \nThread Num %d\n", tid);

	if (funcC_status) {
		funcC_status = false;
		C(tid);
	}
	else if (funcD_status) {
		funcD_status = false;
		D(tid);
	}
	else if (funcE_status) {
		funcE_status = false;
		E(tid);
	}
	else {

		K(tid);
	}
}

static void B(int tid) {

	printf("Hi from Function B \nThread Num %d\n", tid);

	if (funcF_status) {
		funcF_status = false;
		F(tid);
	}
	else if (funcG_status) {
		funcG_status = false;
		G(tid);
	}
	else if (funcH_status) {
		funcH_status = false;
		H(tid);
	}
	else {
		L(tid);
	}
}

static void C(int tid) {
	int y = 0;

	for (int i = 0; i < INT_MAX / 4; i++)
	{
		if ((i % 2) == 0)
		{
			y++;
		}
	}

	std::cout << "Hello from C\n";

#pragma omp barrier
}

static void D(int tid) {
	int y = 0;

	for (int i = 0; i < INT_MAX / 4; i++)
	{
		if ((i % 2) == 0)
		{
			y++;
		}
	}

	std::cout << "Hello from D \n";

#pragma omp barrier
}

static void E(int tid) {
	int y = 0;

	for (int i = 0; i < INT_MAX / 4; i++)
	{
		if ((i % 2) == 0)
		{
			y++;
		}
	}

	std::cout << "Hello from E \n";

#pragma omp barrier
}

static void F(int tid) {
	int y = 0;

	for (int i = 0; i < INT_MAX; i++)
	{
		if ((i % 2) == 0)
		{
			y++;
		}
	}

	std::cout << "Hello from F \n";

}

static void G(int tid) {
	int y = 0;

	for (int i = 0; i < INT_MAX / 4; i++)
	{
		if ((i % 2) == 0)
		{
			y++;
		}
	}

	std::cout << "Hello from G \n";

#pragma omp barrier
}

static void H(int tid) {
	int y = 0;

	for (int i = 0; i < INT_MAX / 4; i++)
	{
		if ((i % 2) == 0)
		{
			y++;
		}
	}

	std::cout << "Hello from H \n";

#pragma omp barrier
}

static void J(int tid) {
	int y = 0;

	for (int i = 0; i < INT_MAX / 4; i++)
	{
		if ((i % 2) == 0)
		{
			y++;
		}
	}

	std::cout << "Hello from J \n";

#pragma omp barrier
}


static void K(int tid) {
	int y = 0;
	for (int i = 0; i < INT_MAX / 2; i++)
	{
		if ((i % 2) == 0)
		{
			y++;
		}
	}
	L(tid);
}

static void L(int tid) {
	int y = 0;

	for (int i = 0; i < INT_MAX / 4; i++)
	{
		if ((i % 2) == 0)
		{
			y++;
		}
	}
	K(tid);
}
