GPU621/Pragmatic
Pragmatic
Group Members
- Vadym Karpenko, Research, and everything else.
- Oleksandr Zhurbenko, Research, and everything else.
Progress
Entry on: October 17th 2016
Group page (Pragmatic) has been created and 3 suggested project topics are being considered (Preference in order specified):
- OpenMP Debugging in Visual Studio - [MSDN Notes]
- Analyzing False Sharing - [Herb Sutter's Article]
- Debugging Threads in Intel Parallel Studio - [Dr Dobbs Article]
Once project topic is confirmed (On Thursday, October 20th 2016, by Professor Chris Szalwinski), group will be able to proceed with topic research.
Entry on: November 1st 2016
Project topic has been confirmed (OpenMP Debugging in Visual Studio - [MSDN Notes]) and team is working on researching material and testing newly acquired knowledge.
Team is considering using Prefix Scan or Convolution workshops for demonstration purposes.
Notes
- All notes are based on the material outlined in "Debug Multithreaded Applications in Visual Studio" section of MSDN documentation at: https://msdn.microsoft.com/en-us/library/ms164746.aspx and other related MSDN documentation.
Entry on: November 6th 2016
Debug Multithreaded Applications in Visual Studio
While parallel processing of multiple threads increases program performance, it makes debugging task harder, since we need to track multiple threads instead of just one (Master thread). Also some potential bugs are introduced with parallel processing, for example, when race condition (When multiple processes or threads try to access same resource at the same time, for more information visit Race Condition Wiki) occurs and mutual exclusion is performed incorrectly, it may create a deadlock condition (When all threads wait for the resource and none can execute, for more info visit Deadlock Wiki), which can be very difficult to debug.
Visual Studio provides many useful tools that make multithreaded debugging tasks easier.
Debug Threads and Processes
A process is a task or a program that is executed by operating system, while a thread is a set of instructions to be executed within a process. A process may consist of one or more threads.
Following are the tools for debugging Threads and Processes in Visual Studio:
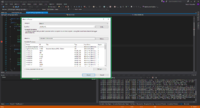
1. Attach to Process (Dialog box) - Allows to attach the Visual Studio debugger to a process that is already running (Select on DEBUG > Attach to Process or press Ctrl + Alt + P);
2. Process (Window) - Shows all processes that are currently attached to the Visual Studio debugger (While debugging select DEBUG > Windows > Processes or press Ctrl + Alt + Z);
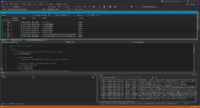
3. Threads (Window) - Allows to view and manipulate threads (While debugging select DEBUG > Windows > Threads or press Ctrl + Alt + H);
4. Parallel Stacks (Window) - Shows call stack information for all the threads in the application (While debugging select DEBUG > Windows > Parallel Stacks or press Ctrl + Shift + D, S);
5. Parallel Tasks (Window) - Displays all parallel tasks that are currently running as well as tasks that are scheduled for execution (While debugging select DEBUG > Windows > Parallel Tasks or press Ctrl + Shift + D, K);
6. Parallel Watch (Window) - Allows to see and manipulate the values for one expression executed on multiple threads (While debugging select DEBUG > Windows > Parallel Watch > Parallel Watch 1/2/3/4 or press Ctrl + Shift + D, 1/2/3/4);
7. GPU Threads (Window) - Allows to examine and work with threads that are running on the GPU in the application that is being debugged (While debugging select DEBUG > Windows > GPU Threads);
8. Debug Location (Toolbar) - Allows to manipulate processes and threads while debugging the application (Select on VIEW > Toolbars > Debug Location);
Above mentioned tools can be classified as follows:
- The primary tools for working with processes are the Attach To Process dialog box, the Processes window, and the Debug Location toolbar;
- The primary tools for working with threads are the Threads window and the Debug Location toolbar.
- The primary tools for working with multithreaded applications are the Parallel Stacks, Parallel Tasks, Parallel Watch, and GPU Threads windows.
Debug Multiple Processes
Configuration:
- Multiple processes execution behaviour can can be configured by selecting DEBUG > Options, and in Options dialog by checking/un-checking "Break all processes when one process breaks" checkbox under Debugging > General tab;
- When working with multiple projects in one solution, startup project (One or many) can be set by right clicking on solution and selecting Properties option (Or selecting a solution in Solution Explorer and pressing Alt + Enter), then (In Property pages dialog) selecting appropriate action for each project in the solution under Common Properties > Startup Project tab;
- To change how Stop Debugging affects attached processes, open to Processes window (Crtl + Alt + Z), right click on individual process and check/un-check the "Detach when debugging stopped" check box;
Entry on: November 9th 2016
How to: Use the Threads Window
Threads window columns:
- The flag column - can be used to flag a thread for special attention;
- The active thread column - indicates an active thread (Yellow arrow), and the thread where execution broke into debugger (Black arrow);
- The ID column - displays identifier of the thread;
- The Managed ID column - displays managed identifier for managed threads;
- The Category column - displays category of the thread, for example, Main Thread or Worker Thread;
- The Name column - displays name of the thread;
- The Location column - displays where the thread is running (Can be expanded to provide full call stack for the thread);
- The Priority column - displays assigned (By system) priority for the thread;
- The Suspended Count column - displays suspended count value (Suspended count indicates whether a thread is suspended or not. If suspend count value is 0, a thread is NOT suspended);
- The Process Name column - displays the process name to which each thread belongs;
How to: Set a Thread Name
Thread name can be set using SetThreadName function provided by Microsoft:
#include <windows.h>

...

// This function is taken from https://msdn.microsoft.com/en-us/library/xcb2z8hs.aspx
// Usage: SetThreadName ((DWORD)-1, "Enter thread name here");
const DWORD MS_VC_EXCEPTION = 0x406D1388;

#pragma pack(push,8)

typedef struct tagTHREADNAME_INFO
{
	DWORD dwType; // Must be 0x1000.
	LPCSTR szName; // Pointer to name (in user addr space).
	DWORD dwThreadID; // Thread ID (-1=caller thread).
	DWORD dwFlags; // Reserved for future use, must be zero.
} THREADNAME_INFO;

#pragma pack(pop)

void SetThreadName(DWORD dwThreadID, const char* threadName)
{
	THREADNAME_INFO info;

	info.dwType = 0x1000;
	info.szName = threadName;
	info.dwThreadID = dwThreadID;
	info.dwFlags = 0;

#pragma warning(push)

#pragma warning(disable: 6320 6322)

	__try
	{
		RaiseException(MS_VC_EXCEPTION, 0, sizeof(info) / sizeof(ULONG_PTR), (ULONG_PTR*)&info);
	}
	__except (EXCEPTION_EXECUTE_HANDLER) {}

#pragma warning(pop)
}
NOTE: When using -1 as a thread identifier argument, a thread that calls this function will have it's name changed as per second argument.
