Difference between revisions of "GPU621/Weekender"
(→Steps for using the Intel Inspector) |
(→Steps for using the Intel Inspector) |
||
| Line 19: | Line 19: | ||
Next run the command inspxe-gui to open up the inspector. | Next run the command inspxe-gui to open up the inspector. | ||
| − | [[File:Commands.png| | + | [[File:Commands.png|500px|thumb|left|Commands for Intel Inspector]] |
| + | |||
For the project in Visual Studio have the toolbar set to Debug. For the Properties go to General under C/C++ and make sure the Debug Information Format field is set to Program Database (/Zi) or Program Database for Edit & Continue (/ZI).Then choose Optimization and insure the Optimization field is set to Disabled (/Od). Also in Code Generation set the Runtime Library field to Multi-threaded DLL (/MD) or Multi-threaded Debug DLL (/MDd) and the Basic Runtime to Default. Lastly choose Configuration Properties > Linker > Debugging and set the Generate Debug Info field to Yes (/DEBUG). | For the project in Visual Studio have the toolbar set to Debug. For the Properties go to General under C/C++ and make sure the Debug Information Format field is set to Program Database (/Zi) or Program Database for Edit & Continue (/ZI).Then choose Optimization and insure the Optimization field is set to Disabled (/Od). Also in Code Generation set the Runtime Library field to Multi-threaded DLL (/MD) or Multi-threaded Debug DLL (/MDd) and the Basic Runtime to Default. Lastly choose Configuration Properties > Linker > Debugging and set the Generate Debug Info field to Yes (/DEBUG). | ||
Revision as of 22:00, 27 November 2016
Contents
Weekender
Group Members
- Andy Cooc Research, etc.
- Eugueni Antsyferov Research, etc.
Progress
Intel Parallel Studio Inspector
Notes
The Intel Inspector is a tool that finds the source of memory and threading related errors for C, C++ and Fortran projects.
Steps for using the Intel Inspector
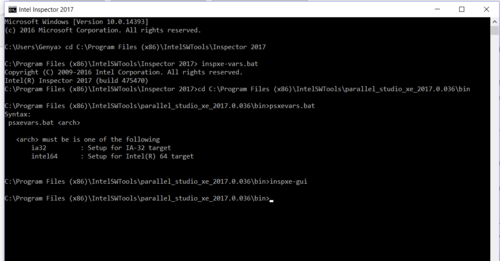
Open up the Command prompt and change the directory to IntelSWTools\Inspector 2017 then ran the command inspxe-vars.bat. Then change the directory to IntelSWTools\parallel_studio_xe_2017.0.036\bin and run the command psxevars.bat
Next run the command inspxe-gui to open up the inspector.
For the project in Visual Studio have the toolbar set to Debug. For the Properties go to General under C/C++ and make sure the Debug Information Format field is set to Program Database (/Zi) or Program Database for Edit & Continue (/ZI).Then choose Optimization and insure the Optimization field is set to Disabled (/Od). Also in Code Generation set the Runtime Library field to Multi-threaded DLL (/MD) or Multi-threaded Debug DLL (/MDd) and the Basic Runtime to Default. Lastly choose Configuration Properties > Linker > Debugging and set the Generate Debug Info field to Yes (/DEBUG).
After all these settings are done build the Project. Now go back to the Inspector and choose File > New > Project to start setting up the project for the Inspector. Enter the Project Name and browse for the location of where the file will be saved.
Then in next menu selct the Browse... button next to the Application field and select the .exe file in the Debug folder of the project application. Next click the Modify button next to the Application Parameters field. In the Application Parameters window, Browse to insert file path button, change the Select the file to launch window to show all files, select the .dat output file, click the OK button to close the Application Parameters window, then click the OK button, the name of the opened project will be displayed in the title bar and in the Project Navigator pane.
