GPU621/Group 2
GPU621/DPS921 | Participants | Groups and Projects | Resources | Glossary
Contents
Group Members
Definitions
Processes
Every process is a separate instance of a particular program that is being run on a computer.
Threads
Threads are sets of instructions that get executed by the processes that contain them. The existence of multiple threads enables a process to separate work to be performed in parallel.
Debugging Single-threaded V.S. Multi-threaded Programs
Debugging usually occurs on a single threaded program by pausing the execution at a specific line of code. While the execution is paused, the values of all the variables can be inspected. This can be helpful to closely view what is occurring between each line of code.
Debugging a multithreaded program is different from debugging a single threaded program because each thread has its own sequence of execution, meaning that the point that the execution is paused at can vary for each thread.
OpenMP Debugging in Visual Studio
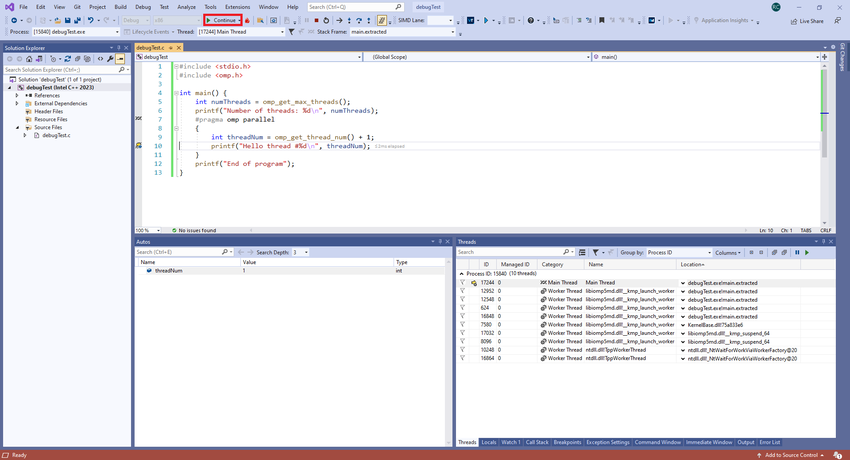
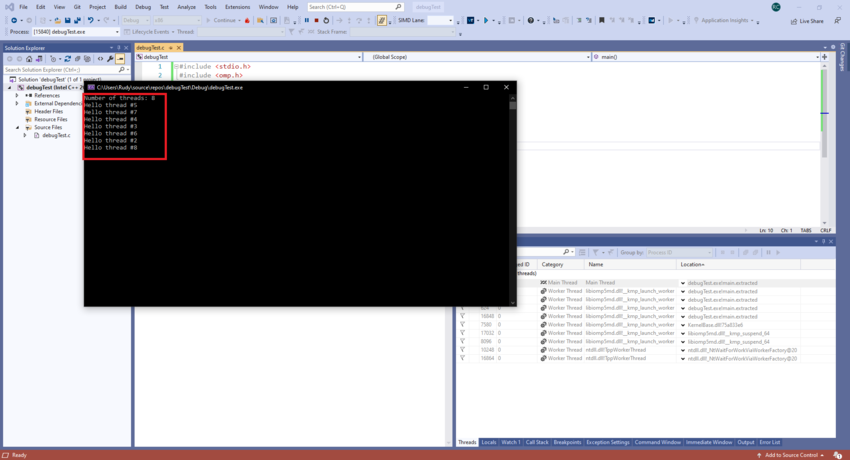
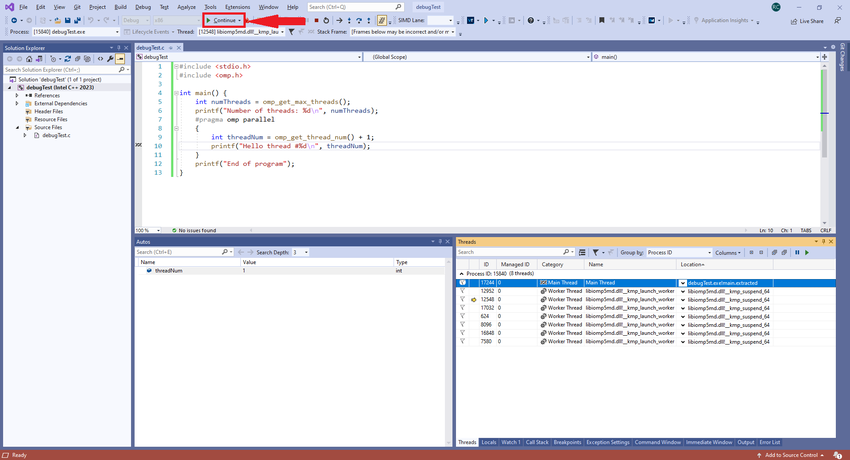
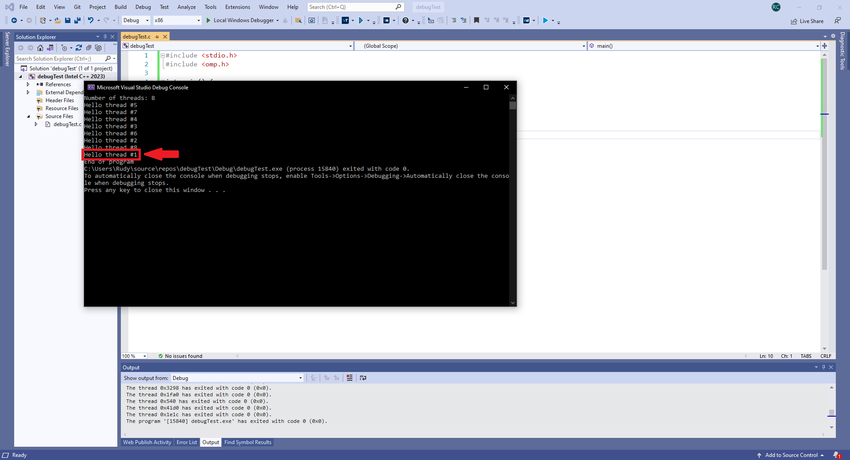
Debugging in Visual Studio will be demonstrated using this code:
#include <stdio.h>
#include <omp.h>

int main() {
	int numThreads = omp_get_max_threads();
	printf("Number of threads: %d\n", numThreads);
	#pragma omp parallel
	{
		int threadNum = omp_get_thread_num() + 1;
		printf("Hello thread #%d\n", threadNum);
	}
	printf("End of program");
}
Threads Window
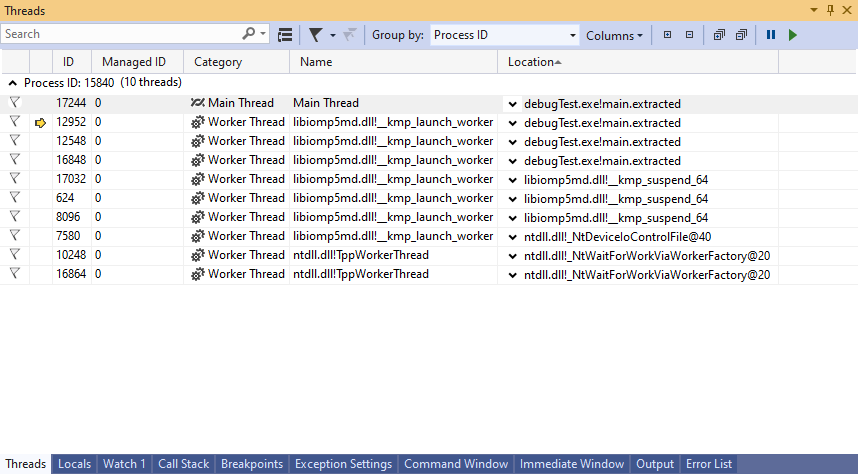
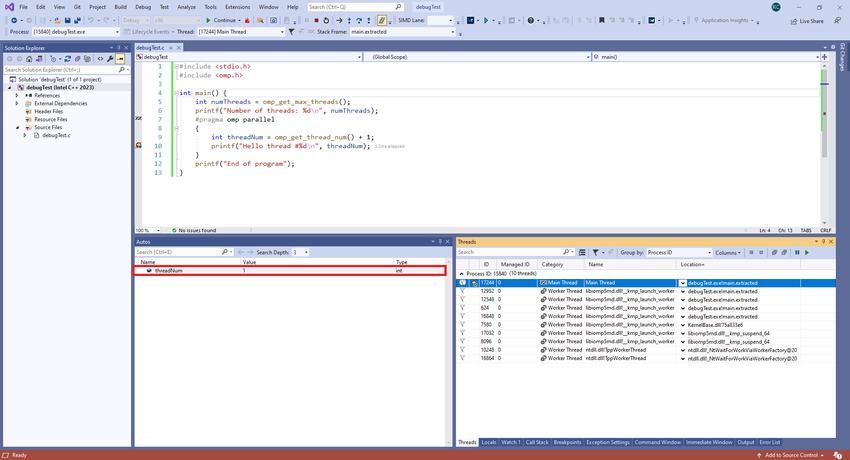
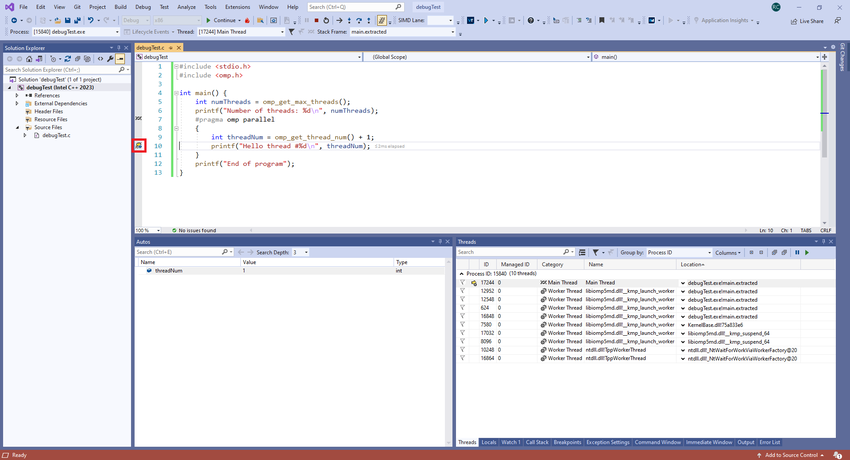
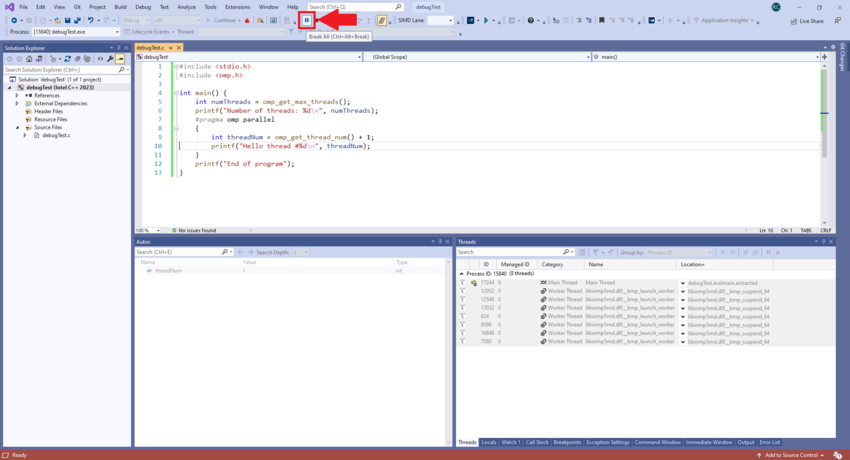
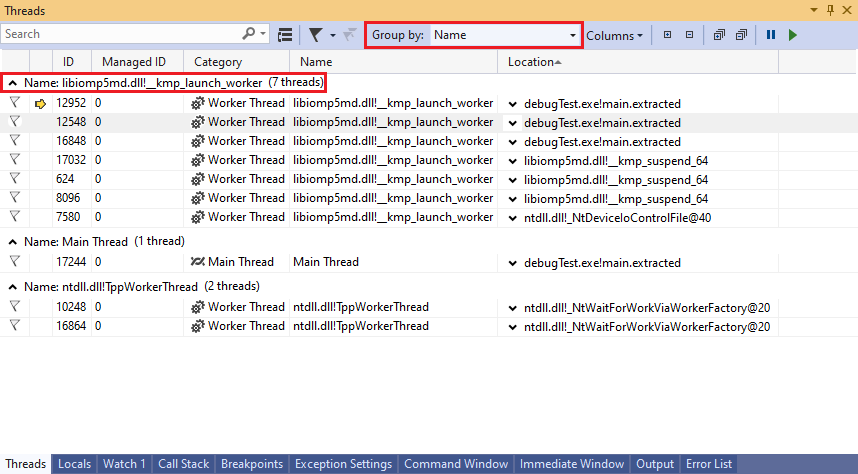
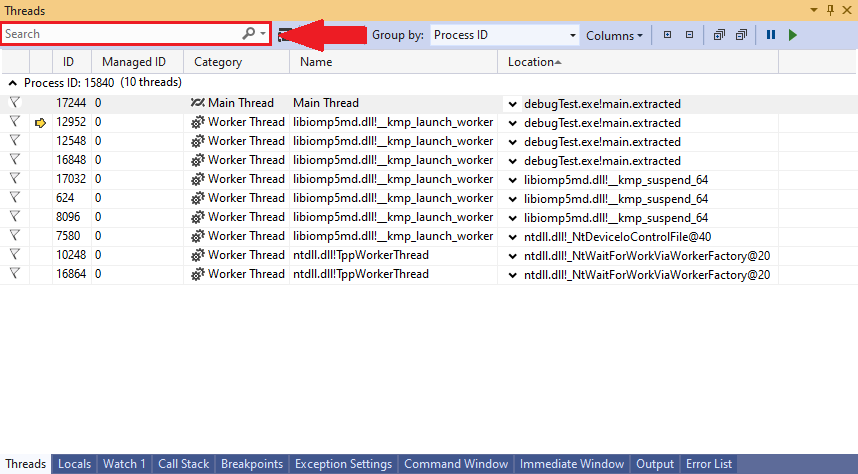
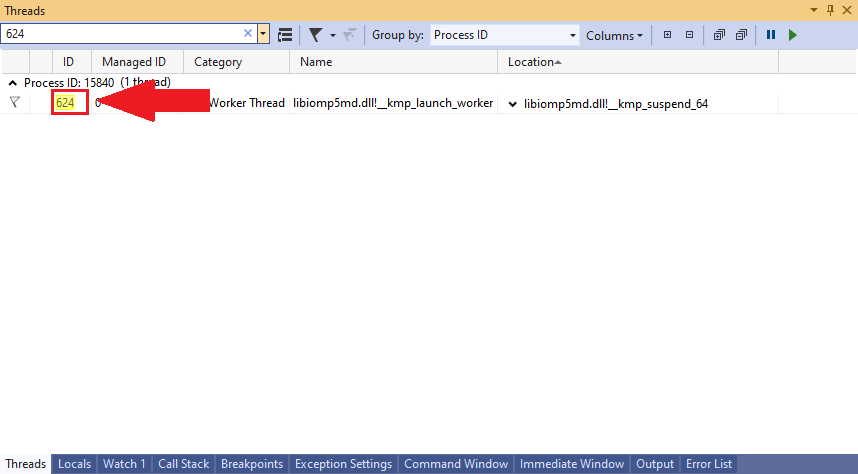
The threads window provides a detailed display of every thread running in your application. Here, you can observe the steps each thread takes and how each thread affects the data of your application, along with a number of other features like searching for specific threads, applying filters on what threads to display, freezing threads in place, etc.
The ID column indicates the thread’s unique identifier number. The category column indicates if the thread is the main thread or a worker thread, meaning a thread that is executing in parallel. Threads can be sorted by each of the columns in order to organize the threads in the desired order.
The yellow arrow on the row of a thread’s information indicates the current thread that execution is paused on.
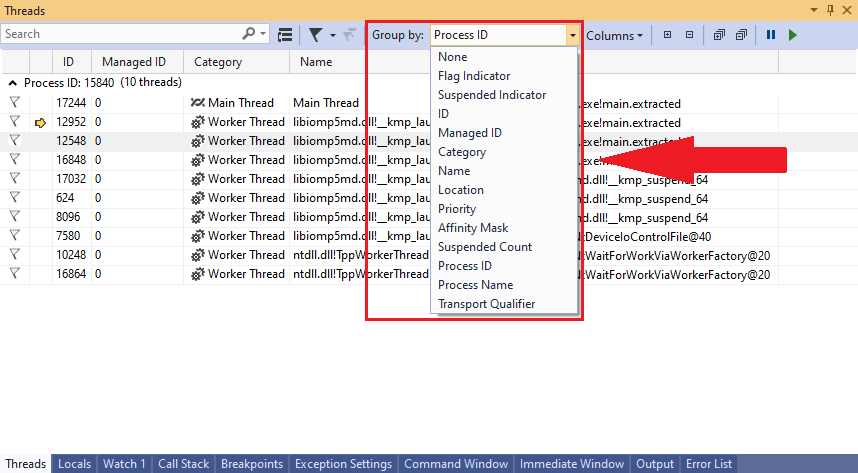
Threads in the thread window searched for by each of their information fields, can be flagged in order to mark certain threads apart from others, and grouped by different fields of information.
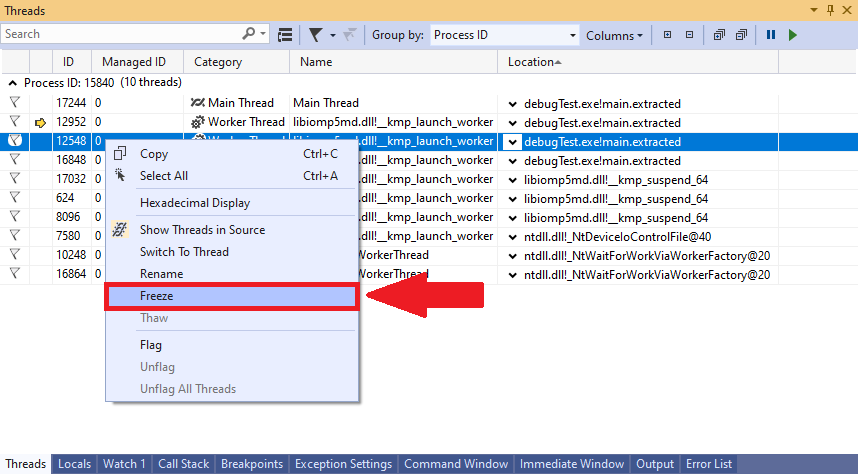
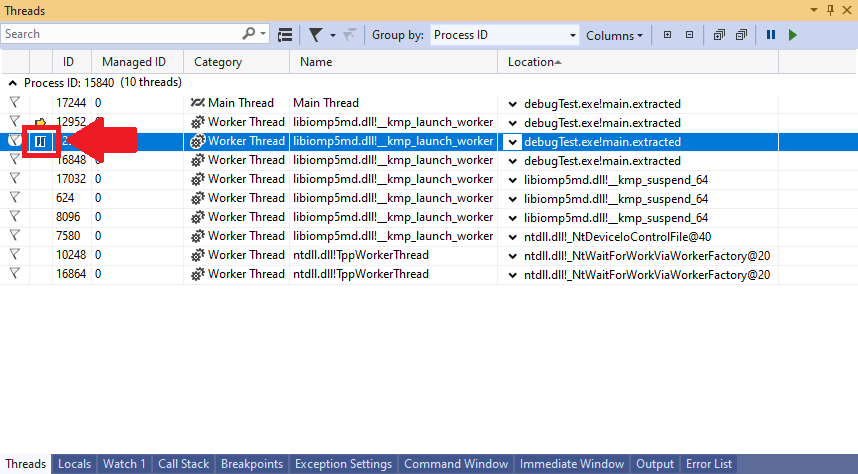
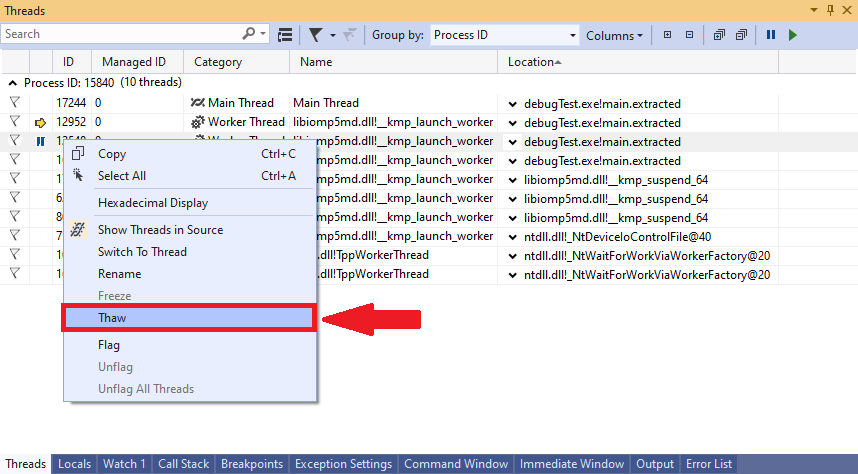
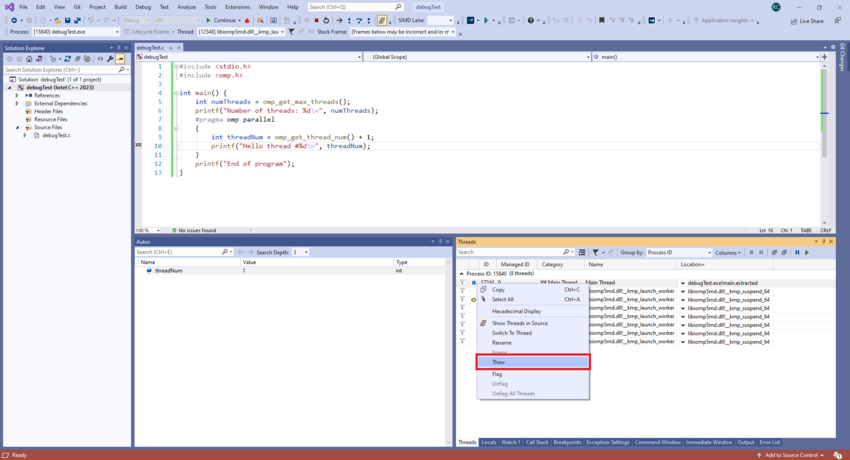
While execution is paused, threads can be switched between or frozen to pause their individual execution until they are thawed.
Switching Threads
One of the features of the thread window is the ability to switch between which thread you want to be actively debugging. This can be useful in various cases, such as when you have a block of code meant for only 1 thread to run through, or if you want to make sure that different parallel threads are each performing as intended.
The steps to switch your currently active thread are as follows:
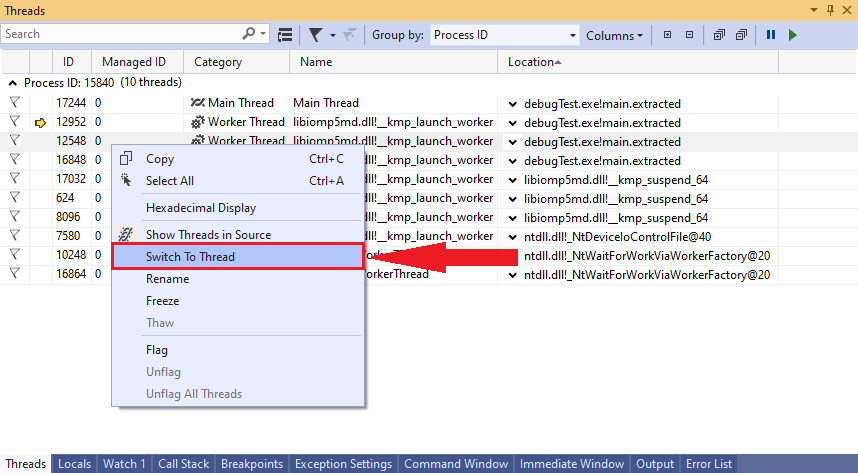
From your list of threads, right-click on the thread that you wish to switch to. On the menu that will appear, click on the option labeled "Switch to Thread".
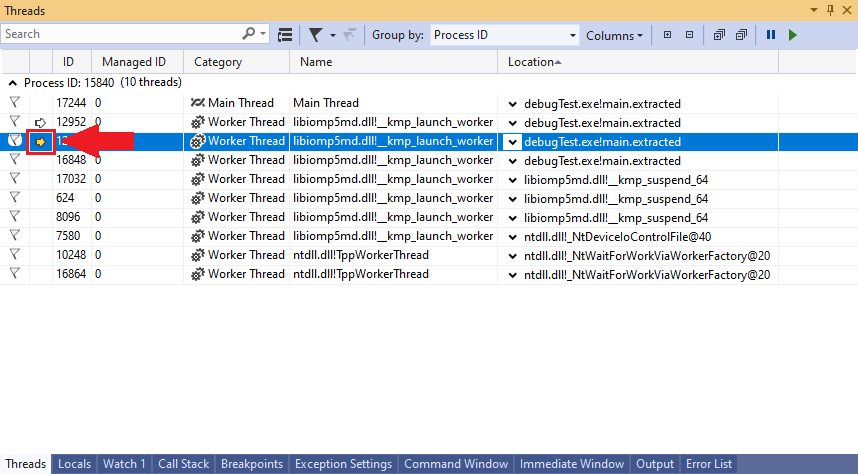
You will now see that the arrow that was previously pointing to the last active thread will now appear hollow, and a new arrow will be pointing to the currently active thread that you switched to.
Freezing/Thawing Threads
Flagging Threads
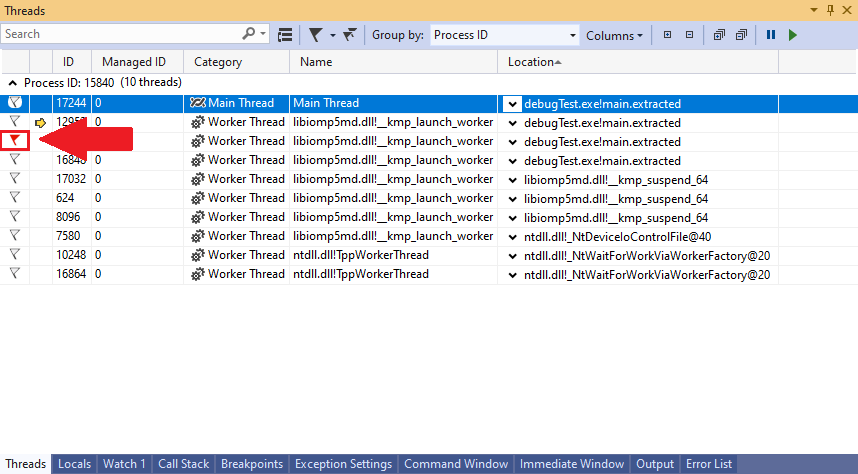
Threads can be set as “flagged” in order to help distinguish them from other threads. This can help in situations where you want to keep track of specific threads that are not necessarily the active thread.
To flag a thread, click on the flag icon in the first column for the thread you wish to have flagged. The uncoloured flag should change to a red flag, indicating that the thread is now flagged.
To unflag a thread, click the flag icon again for the specified thread. The flag should change from a red flag back to an uncoloured flag.
