GPU621/VTuners
Contents
Intel Vtune Profiler
Group Members
Vtune Profiler Features
The Vtune Profiler has a variety of features that provide information to assist in the optimization of application performance, system performance. The profiler also assists in system configuration for HPC, Cloud, IoT, media, storage, etc.
The profiler provides compatibility for a variety of systems and platforms that include the following:
CPU, GPU, and FGPA
Any combination of the following languages: SYCL, C, C++, C+, Fortran, OpenCL, Python, Google Go, Java, .NET, Assembly
Optimized performance that avoids power or thermal throttling
Collection of coarse-grained data over extended periods with details results including mapping to source code
Algorithm Optimization
Analyzing Hot Code Paths
Flame Graphs
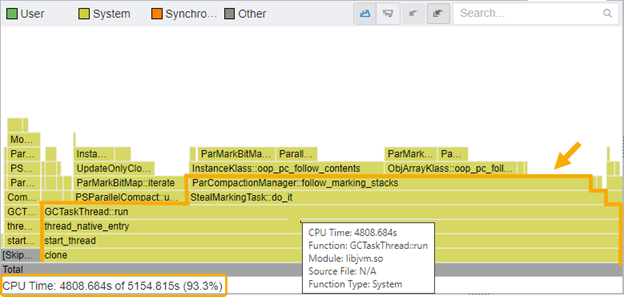
The Intel Vtune Profiler provides flame graphs to display a representation of stacks and stack frames in an application. All functions in an application are plotted on a graph and the associated stack depth is represented as height on the y-axis and the width of the bar represents the amount of CPU usage time. The “hottest” functions in an application are then the widest parts on the flame graph.
Analyzing Hot Spots
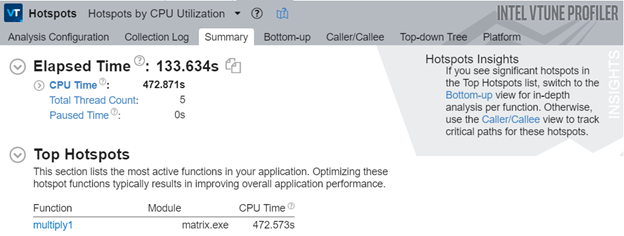
The Hotspot analysis feature in the Intel Vtune Profiler allows you to dig deeper into your application and identify pieces of code which are taking a long time to execute. These hot spots can be used to identify problem areas in your application and help improve performance.
User-Mode Sampling
User-Mode sampling is the default option for the Vtune Profiler and this sampling method utilizes a low overhead that allows collection of information without a significant impact on the run time of your application. Utilizing a sampling interval of 10ms, the profiler collects data using the following steps:
• Interrupts the process
• Collects samples of active instruction addresses
• Records a copy of the stack
The profiler then stores the sampled instruction pointer as well as the stacks to analyze and display back the data. The instruction pointers along with the stack data enable the profiler to put together a top-down tree which will allow a better understanding of the control flow of important code blocks.
The user-mode sampling method will only gather data relating to your application and not the wider system performance. The results will show total time usage of functions within the application. If many samples are collected during a specific process or thread, we can identify these as hotspots and potential bottlenecks in the performance of the application.
Hardware Event-Based Sampling
Event-Based sampling is based more on hardware events. It utilizes the hardware events to collect data on all the processes running on your CPU for a given moment and provides analysis for performance of the whole system. Similar to the user-mode sampling the profiler generates a list of the functions being used in your application and the time spent for each of them. By default the event-based sampling mode does not collects stacks like user-mode sampling, but you can choose to turn that option on.
Microarchitecture and Memory Bottlenecks
Identifying significant hardware issues affecting performance using microarchitecture exploration analysis
Accelerators and XPUs
Parallelism
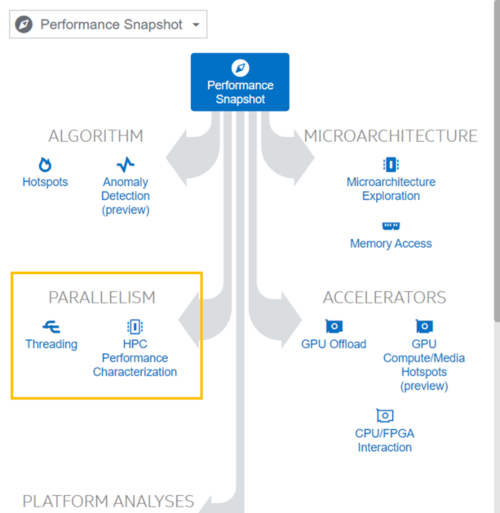
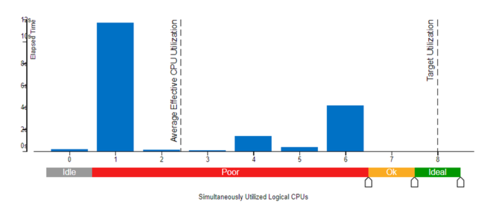
By evaluating compute-intense or throughput high-performance computing (HPC) applications for CPU efficiency, vectorization, and memory allocation, the parallelism feature enables users to check how efficient their threaded code is and can identify the thread issues that affect performance. The terms explained below are the most common statistics, in an advanced version, algorithm-specific analysis may be available, (see Method for OpenMP Code Analysis and Schedule Overhead in Intel® oneAPI Threading Building Blocks Applications)
| Main Analysis Features | Threading, HPC Performance Characterization |
| Suggested Intel Compiler Version | Intel Composer XE 2013 Update 2 or higher (for CPU utilization analysis) |
| Parallelism Pattern | OpenMP, OpenMP-MPI, TBB |
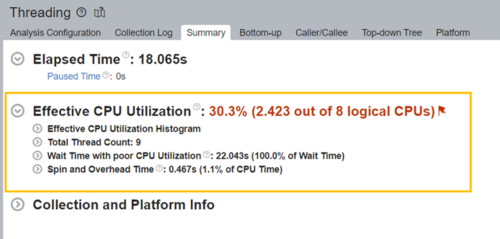
Total Thread Count: This section indicates the number of threads used when running the application. The term Thread Oversubscription indicates time spent in the code with the number of simultaneously working threads more than the number of available logical cores on the system.
Wait Time with poor CPU Utilization The value is the accumulated wait time of each thread where APIs blocks or cause synchronization. Therefore, this value can be higher than the application's Elapsed Time.
Top waiting objects': the Top Waiting Object section provides a table listing object names that took most time waiting in the application. Reasons for waiting could be function calls or synchronization. The higher wait time the more reductions of parallelism.
Spin and Overhead Time
Spin time is the Wait time occurred when the CPU is busy. This often happens when a synchronization API causes the CPU to poll while the software thread is waiting. Overhead time is CPU time spent on the overhead of known synchronization and threading libraries, such as system synchronization APIs, Intel TBB, and OpenMP. This section lists the top functions in the application with the most spin and overhead time. Bottom-Up Tab
The Bottom-up Tab
enables us to investigate the concurrency problems in the application and time-dependent the performance of each thread. In the figure below in the lower half part of the window is the timeline view. As shown in brown colour which indicates the CPU time. Not until ~12 second, the mater thread was split into 8 threads and the first five were off-loaded, while the last threes (TID: 14500, 16268, 28576) were waiting (shown in light green colour) and the last two even waited all the way end which weakened parallelism. When brown band (CPU Time) concurrently happened to multiple threads, it means high level of parallelism.
Platform and I/O
The VTune profiler can reveal to developers the utilization efficiency of Intel's Xeon processors by analyzing the input and output of the DDIO. The profiler analyses the DDIO (Data Direct I/O) technology hardware feature that is built into the processors. This functionality is always available, and always on.
Essentially, when a Network Interface Controller is being fully utilized and a new packet comes in. If any component in the chain takes longer than expected, we get packet loss. This is the main bottle neck of the traditional Direct Memory Approach (DMA).
Intel's solution to this problem is their DDIO Xeon hardware technology. It allows PCIe devices to read and write operation to and from the L3 cache. This gets the incoming data packets as close to the cores as possible. When properly utilized the device interactions can be solely served by the L3 cache.
Advantages:
• Completely remove the need for Dynamic Random Access Memory (DRAM)
• Low inbound read and write latencies that allow for high throughput
• Reduced DRAM bandwidth and power consumption
Depending on implementation, there can be the potential for non-optimal code performance. The areas that can be tuned are the Topology configuration, and L3 cache management.
Multi-Node
VTune profiler helps analyze large-scale Message Passing Interfaces (MPI) and OpenMP workloads. It can help identify issues related to scalability, highlight threading implementation issues, identify imbalances and communications issues in MPI applications. It provides in-depth analysis and recommendations to the user. This functionality extends to High Performance Computing (HPC).
The Profiler can typically (by default) takes a snapshot of the whole application. Although, there is functionality to have it focus on particular area within an application to analyze. It will provide a general program overview, while highlighting specific problematic areas. These problematic areas can then be further analyzed to improve performance.
