GPU621/VTuners
Contents
Intel Vtune Profiler
Group Members
Vtune Profiler Features
The Vtune Profiler has a variety of features that provide information to assist in the optimization of application performance, system performance. The profiler also assists in system configuration for HPC, Cloud, IoT, media, storage, etc.
The profiler provides compatibility for a variety of systems and platforms that include the following:
CPU, GPU, and FGPA
Any combination of the following languages: SYCL, C, C++, C+, Fortran, OpenCL, Python, Google Go, Java, .NET, Assembly
Optimized performance that avoids power or thermal throttling
Collection of coarse-grained data over extended periods with details results including mapping to source code
Algorithm Optimization
Analyzing Hot Code Paths
Flame Graphs
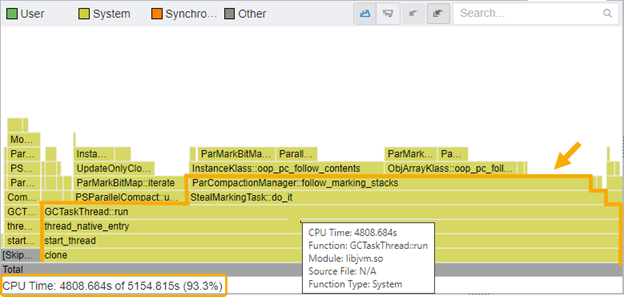
The Intel Vtune Profiler provides flame graphs to display a representation of stacks and stack frames in an application. All functions in an application are plotted on a graph and the associated stack depth is represented as height on the y-axis and the width of the bar represents the amount of CPU usage time. The “hottest” functions in an application are then the widest parts on the flame graph.
Analyzing Hot Spots
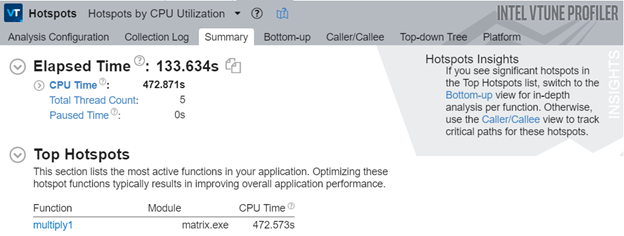
The Hotspot analysis feature in the Intel Vtune Profiler allows you to dig deeper into your application and identify pieces of code which are taking a long time to execute. These hot spots can be used to identify problem areas in your application and help improve performance.
User-Mode Sampling
User-Mode sampling is the default option for the Vtune Profiler and this sampling method utilizes a low overhead that allows collection of information without a significant impact on the run time of your application. Utilizing a sampling interval of 10ms, the profiler collects data using the following steps:
• Interrupts the process
• Collects samples of active instruction addresses
• Records a copy of the stack
The profiler then stores the sampled instruction pointer as well as the stacks to analyze and display back the data. The instruction pointers along with the stack data enable the profiler to put together a top-down tree which will allow a better understanding of the control flow of important code blocks.
The user-mode sampling method will only gather data relating to your application and not the wider system performance. The results will show total time usage of functions within the application. If many samples are collected during a specific process or thread, we can identify these as hotspots and potential bottlenecks in the performance of the application.
Hardware Event-Based Sampling
Event-Based sampling is based more on hardware events. It utilizes the hardware events to collect data on all the processes running on your CPU for a given moment and provides analysis for performance of the whole system. Similar to the user-mode sampling the profiler generates a list of the functions being used in your application and the time spent for each of them. By default the event-based sampling mode does not collects stacks like user-mode sampling, but you can choose to turn that option on.

