GPU621/VTuners
Contents
Intel Vtune Profiler
Group Members
Vtune Profiler Features
The Vtune Profiler has a variety of features that provide information to assist in the optimization of application performance, system performance. The profiler also assists in system configuration for HPC, Cloud, IoT, media, storage, etc.
The profiler provides compatibility for a variety of systems and platforms that include the following:
CPU, GPU, and FGPA
Any combination of the following languages: SYCL, C, C++, C+, Fortran, OpenCL, Python, Google Go, Java, .NET, Assembly
Optimized performance that avoids power or thermal throttling
Collection of coarse-grained data over extended periods with details results including mapping to source code
Algorithm Optimization
Analyzing Hot Code Paths
Flame Graphs
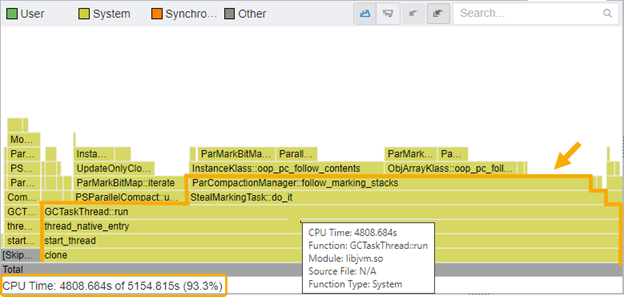
The Intel Vtune Profiler provides flame graphs to display a representation of stacks and stack frames in an application. All functions in an application are plotted on a graph and the associated stack depth is represented as height on the y-axis and the width of the bar represents the amount of CPU usage time. The “hottest” functions in an application are then the widest parts on the flame graph.

