File:Flame Graph.png
Flame_Graph.png (624 × 297 pixels, file size: 81 KB, MIME type: image/png)
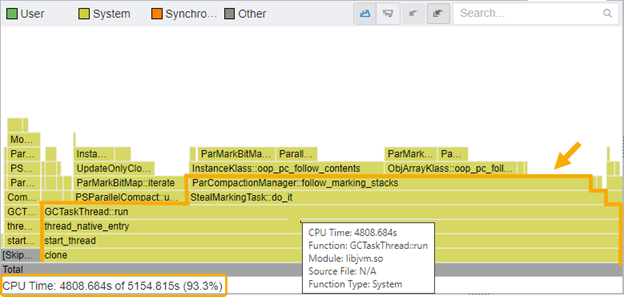
Here we can see an example of a flame graph selecting the “hottest” processes run in an application which represent 93.3% of the total CPU usage time
File history
Click on a date/time to view the file as it appeared at that time.
| Date/Time | Thumbnail | Dimensions | User | Comment | |
|---|---|---|---|---|---|
| current | 14:30, 27 November 2022 |  | 624 × 297 (81 KB) | Nko4 (talk | contribs) | Here we can see an example of a flame graph selecting the “hottest” processes run in an application which represent 93.3% of the total CPU usage time |
- You cannot overwrite this file.
File usage
The following page links to this file:
