Test Team Please Ignore
Contents
BarraCUDA Boiz
Team Members
BarraCUDA Boiz
BarraCUDA Boiz
Progress
Assignment 1
Image Rotation
I profiled a code found on http://www.dreamincode.net/forums/topic/76816-image-processing-tutorial/ There are multiple functions available within the code, and I decided to try three of them (enlarge, flip, and rotate image) It turned out that rotation takes the longest time and good place to apply parallelization.
Flat profile:
Each sample counts as 0.01 seconds.
 %   cumulative   self              self     total
time   seconds   seconds    calls  ms/call  ms/call  name
34.55      0.19     0.19                             Image::rotateImage(int, Image&)
25.45      0.33     0.14                             Image::Image(Image const&)
18.18      0.43     0.10        1   100.00   100.00  Image::operator=(Image const&)
12.73      0.50     0.07        1    70.00    70.00  Image::Image(int, int, int)
 5.45      0.53     0.03                             writeImage(char*, Image&)
 3.64      0.55     0.02                             readImage(char*, Image&)
 0.00      0.55     0.00        1     0.00     0.00  _GLOBAL__sub_I_main
 0.00      0.55     0.00        1     0.00     0.00  Image::~Image()
Mandelbrot set
Erquan Bi code source: https://people.sc.fsu.edu/~jburkardt/cpp_src/mandelbrot/mandelbrot.cpp
This program computer an image of the Mandelbrot set through function:
that 1, carry out the iteration for each pixel: void iterPixel(int n, int* count, int count_max, double x_max, double x_min, double y_max, double y_min); Which inludes a three nested loop, a hotspot, consuming around 70% of the total time
2, Determine the coloring of each pixel: void pixelColor(int& c_max, int n, int *count);
3, Set the image data: void setImageData(int n, int *r, int *g, int *b, int c_max, int* count); which includes 2 nested loop, a hotspot, taking up 26% of the time.
4, Then, write an image file: bool ppma_write(string file_out_name, int xsize, int ysize, int *r, int *g, int *b);
The Big-O class of iterPixel is O(n^3). For each iteration which is the (n+1)th row and the (n+1) column, the extra steps that needed to be taken for the mulitplication are (n+1)^3, which are O(n^2) - cubic mulitiply(n), is the hotspot logic of this program. It consumes up 75% of the elasped time and grow significantly. The program will be faster if this function can be speed up.
time A1 501 real 0m0.336s user 0m0.220s sys 0m0.068s
time A1 1001 real 0m1.289s user 0m0.948s sys 0m0.188s
time A1 1501 real 0m2.859s user 0m2.204s sys 0m0.368s
A1.501.flt Flat profile: Each sample counts as 0.01 seconds.
 %   cumulative   self              self     total
time   seconds   seconds    calls  Ts/call  Ts/call  name
75.00      0.09     0.09                             iterPixel(int, int*, int, double, double, double, double)
25.00      0.12     0.03                             setImageData(int, int*, int*, int*, int, int*)
 0.00      0.12     0.00        1     0.00     0.00  _GLOBAL__sub_I_main
 0.00      0.12     0.00        1     0.00     0.00  ppma_write_data(std::basic_ofstream<char, std::char_traits<char> >&,
int, int, int*, int*, int*)
 0.00      0.12     0.00        1     0.00     0.00  ppma_write_header(std::basic_ofstream<char, std::char_traits<char> >&,
                                                     std::string, int, int, int)
A1.1001.flt Flat profile: Each sample counts as 0.01 seconds.
 %   cumulative   self              self     total
time   seconds   seconds    calls  ms/call  ms/call  name
67.31      0.35     0.35                             iterPixel(int, int*, int, double, double, double, double)
26.92      0.49     0.14                             setImageData(int, int*, int*, int*, int, int*)
 5.77      0.52     0.03        1    30.00    30.00  ppma_write_data(std::basic_ofstream<char, std::char_traits<char> >&,
                                                     int, int, int*, int*, int*)
 0.00      0.52     0.00        1     0.00     0.00  _GLOBAL__sub_I_main
 0.00      0.52     0.00        1     0.00     0.00  ppma_write_header(std::basic_ofstream<char, std::char_traits<char> >&,
                                                     std::string, int, int, int)
A1.1501.flt Flat profile: Each sample counts as 0.01 seconds.
 %   cumulative   self              self     total
time   seconds   seconds    calls  ms/call  ms/call  name
67.31      0.35     0.35                             iterPixel(int, int*, int, double, double, double, double)
26.92      0.49     0.14                             setImageData(int, int*, int*, int*, int, int*)
 5.77      0.52     0.03        1    30.00    30.00  ppma_write_data(std::basic_ofstream<char, std::char_traits<char> >&,
                                                     int, int, int*, int*, int*)
 0.00      0.52     0.00        1     0.00     0.00  _GLOBAL__sub_I_main
 0.00      0.52     0.00        1     0.00     0.00  ppma_write_header(std::basic_ofstream<char, std::char_traits<char> >&,
                                                     std::string, int, int, int)
PI calculation
I've chosen to profile the algorithm for estimating the value of PI as described on this page: https://computing.llnl.gov/tutorials/parallel_comp/#ExamplesPI The run time of the program is determined by the number of samples (random points generated) that are used to estimate pi. Greater number of samples results in a a more accurate value of pi. In my trial runs, doing ~10 million samples results in a value accurate to 3 decimal places. Run time for this algorithm increases in a linear fashion, and as such the proportion of time taken up by each function remains the same. Here are average values for percentage of run time taken up by a given function: main(): 22% getRandom(): 60% insideCircle(): 15%
main() includes some simple set up and result calculation, but I'm going to guess that the loop control takes up most of the run time, in fact, it's actually more than the insideCircle() function which uses the Pythagorean theorem to check if a point is inside the circle. getRandom() generates a random float value between 0 and 1, and takes up most of the time. It is called twice to generate a single point.
Recommendation: The largest hot spot is the generation of random numbers, which is something that GPU can do quite well. The other functions comprise a smaller portion but will be sped up as well. Judging from the profiling data, this algorithm will greatly benefit from being run on the GPU, because every point is generated and evaluated independently of others. The technique of reduction can be used to solve this problem. Step 1: Generate 2 * n random floats between 0 and 1 where n is the number of samples that the user wishes to use Step 2: Reduce this array of random numbers by applying the Pythagorean theorem to pairs of numbers Step 3: Reduce again to count how many values in step 2 were below 1 Step 4: Plug the answer into the formula mentioned on the web page to get the result, this can be done on the CPU
Assignment 2
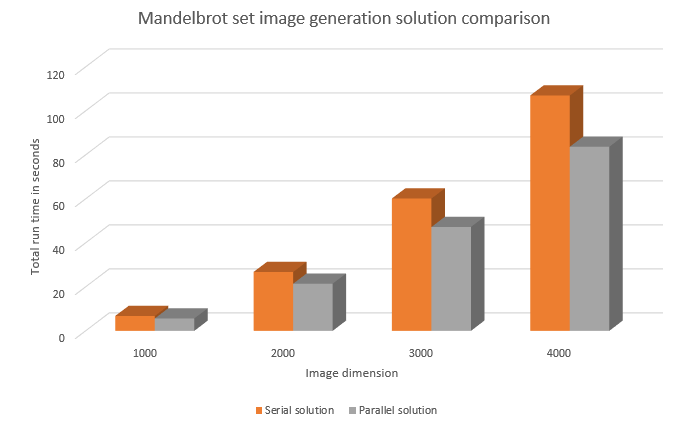
We've chosen to optimize the Mandelbrot set problem. We parallelized the functions iterPixel and setImageData, this improved the run time significantly as the chart below demonstrates.
While the times are improved, it's not as dramatic as we would like, but that is because the majority of the time is still being taken up by the file writing operation. To our knowledge, this part of the problem cannot be parallelized.
Assignment 3
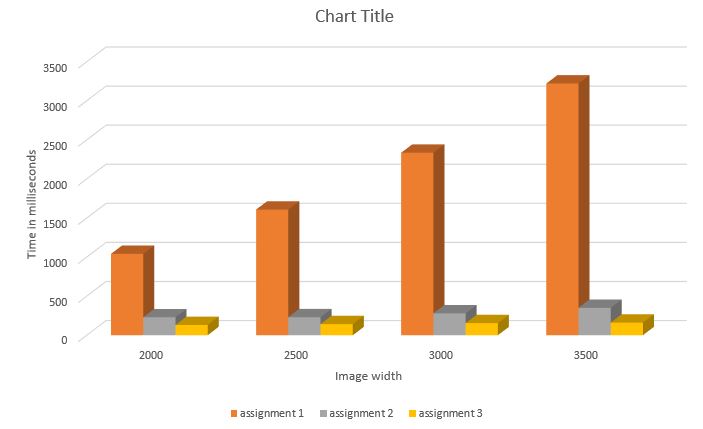
This chart illustrates the program's run time comparison through the assignments, going from a serial approach, to a naive GPU approach, to a more optimized approach. Note that it only includes measurement of the image creation phase, and not the file output. The original algorithm used doubles to do all of the calculations so the biggest increase in speed was gained from switching from the data type to float. While this reduced the precision, the end result looked about the same, and extreme precision isn't needed for this visualization anyways. Additional speed increases were gained from reducing global memory access in the kernels and taking some initialization work outside. Furthermore, we've used Thrust to speed up a few more parts of the calculations that were not using the GPU previously. Lastly, we've reduced the number of memory allocations by allocating a single large block and splitting it up manually.
There was one large part of the program's run time we could not optimize during this course. The image was generated in the ppm format, which is an ascii text file. The slowest part was going through the entire array of pixels and composing the string output. Even an image of 5000 pixels on a side would result in a file gigabytes in size. While I didn't realize it at the time, we could calculate a maximum width for each row and then allocate enough memory and split the work by giving each thread a row to work on. An alternative to this is to create the image in a more familiar binary format like PNG or JPG, which lend themselves to optimization much easier.

