GPU621/Intel Advisor Assistant
Contents
Intel Advisor
Group Members
Introduction to Intel Advisor
Intel advisor is a tool used by developers writing code in Fortran, C, C++, Data Parallel C++ (DPC++), OpenMP, and Python. It will analyze your code written in these languages and help you figure out where you can optimize, and make your application run faster.
It is a part of the Intel OneAPI Base Toolkit that we used in our course – GPU621.
This tool will take your code and help with its performance, it does this through analyzing your code through following key points:
• Vectorization and Code Insights
• CPU/ Memory Roofline Insights and GPU Roofline Insights
• Offload Modeling
• GPU Roofline Insights
• Threading
Intel Advisor will not write your code, but it will help with optimization. It allows you to:
• Model your application performance on an accelerator
• Visualize performance bottlenecks on a CPU or GPU using a Roofline chart
• Check vectorization efficiency
• Prototype threading designs
How to install Intel Advisor
The standalone tool is available on Intel’s official website at https://www.intel.com/content/www/us/en/developer/tools/oneapi/advisor.html and it is also a part of the Intel OneAPI Base Toolkit.
Advantages of Using Intel Advisor
To talk about the advantages of using Intel Advisor we need to discuss a major concern of programmers today; CPU speeds are not increasing and there is a larger emphasize on producing code that will perform more efficiently with the resources available.
With newer processors more options for multi-threading processes become available to coders, as such code produced in this era of computing needs to be parallelized to reach its capabilities.
Intel Advisor is a tool designed to help you take advantage of all the cores available on your CPU. Compiling your code with the proper instruction set will allow your program to take full advantage all the processing power of your CPU.
As it is, with Visual Studio, having optimization turned off simply has the compiler create assembly code for your code as written. With optimization Visual Studio uses Profile-Guided Optimization (PGO) to produce a more optimized code, but no where near as optimized as is possible.
How It Displays Information
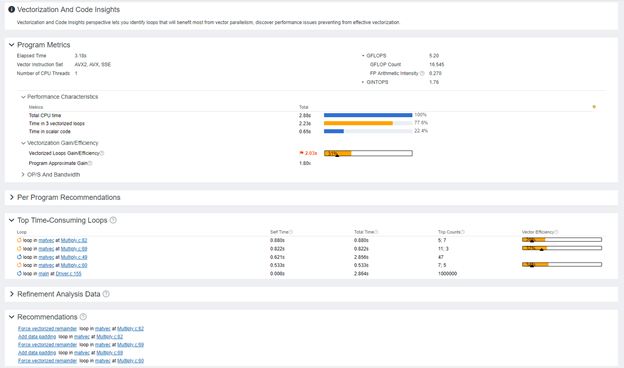
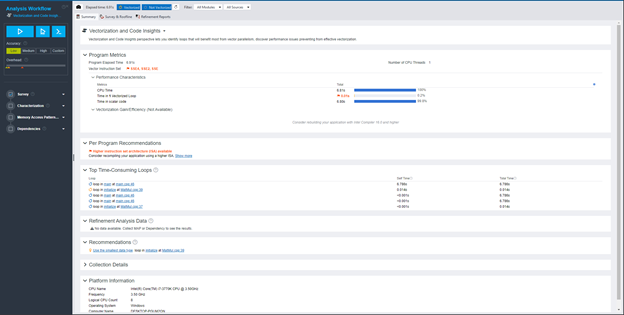
A key feature of Intel Advisor is it offers information to the user via a graphical user interface (GUI) or Command Line. Here in an example taken from the Intel Website site we can see an example of vectorization and code insights offered by their application:
Here this offers several important pieces of information such as:
• Performance metrics
• Top time-consuming loops as sorted by time
• A recommendation list for fixing performance issues with your code
How Vectorization and Code Insights works :
• Get integrated compiler report data and performance data by running a survey analysis
• Identifies the number of times loops are invoked and execute and the number of floating-point and integer operations by running a Characteristic analysis
• Checks for various memory issues by running the Memory Access Patterns (MAP) analysis
• Checks for data dependencies in loops that the compiler did not vectorize by running the Dependencies analysis.
To expand on a few of these points.
Survey analysis is the process where Intel Advisor looks to identify loop hotspots and will use that to provide recommendations on how to fix vectorization issues.
Memory Access Patterns will check for memory access issues with such as non-contiguous parts. Dependencies analysis will check for real data dependencies in loops which the compiler failed to vectorize.
Important Features of Intel Advisor
Below are few of the main features of the Intel Advisor:
Optimize Vectorization for Better Performance
Vectorization is one of the most important features of the Intel Advisor, it is an operation of Single instruction Multiple Data(SIMD) instructions on multiple data objects in parallel in single core of a CPU. This can very effectively increase performance by reducing loop overhead and making better use of math unit.
It does the following:
• Find loops that will benefit from better vectorization.
• Identify where it is safe to force compiler vectorization.
• Pinpoint memory-access issues that may cause slowdowns.
• Get actionable user code-centric guidance to improve vectorization efficiency.
//Screenshot if possible
Model, Tune, and Test Multiple Threading Designs
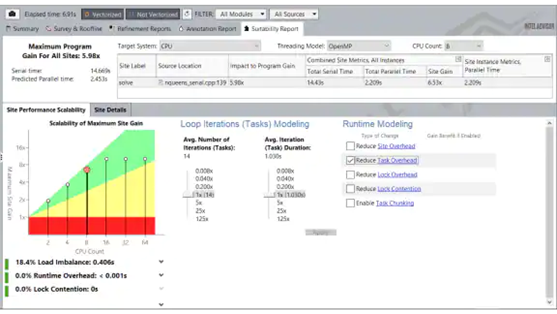
The Threading Advisor tool is applied to the model and tests the performance of various multi-threading designs such as OpenMP, Threading Building Blocks (TBB), and Microsoft Task Parallel Library (TPL) without limiting the development of the project. The tool achieves this by helping you with prototyping, testing the project's scalability for larger systems, and optimizing faster. It will also help identify issues before implementing parallelization.
The tool is primarily used for adding threading to the C, C++, C#, and Fortran languages.
Flow Graph Analyzer – FGA is a
Optimize for Memory and Compute
The analysis gives a realistic visual representation of application performance against hardware-imposed conditions, such as memory bandwidth and computer capacity.
With automated roofline analysis, you can:
• See performance headroom against hardware limitations
• Get insights into a practical optimization roadmap
• Visualize optimization progress
Roofline Chart Data
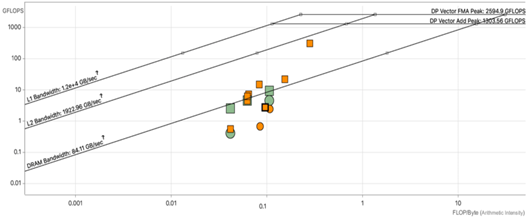
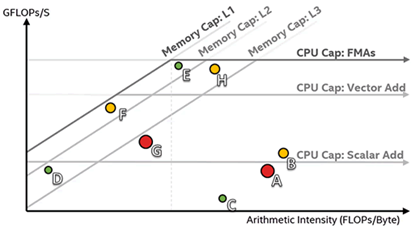
The Roofline chart plots an application's achieved performance and arithmetic intensity against the machine's maximum achievable performance.
• Arithmetic intensity (x-axis) - measured in number of floating-point operations (FLOPs) or integer operations (INTOPs) per byte, based on the loop algorithm, and transferred between CPU/VPU and memory
• Performance (y-axis) - measured in billions of floating-point operations per second (GFLOPS) or billions of integer operations per second (GINTOPS)
Efficiently Offload Your Code to GPUs
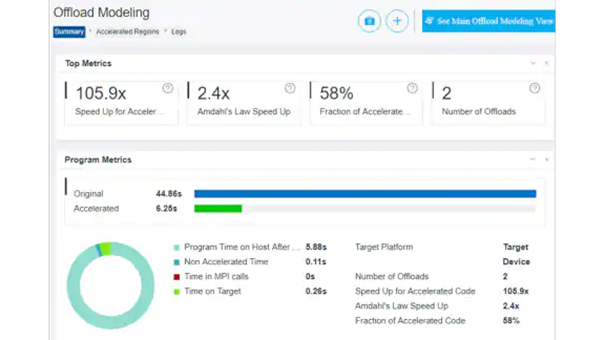
The Offload Advisor is an extended version of the Intel® Advisor, a code modernization, and performance estimation tool that supports OpenCL and SYCL/Data-Parallel C++ languages on CPU and GPU.
Benefits of using Offload Advisor:
• It will Estimate data-transfer costs and get guidance on how to optimize data transfer.
• Identify offload opportunities where it pays off the most.
Create, Visualize, and Analyze Task and Dependency Computation Graphs
Flow Graph Analyzer (FGA) is a rapid visual prototyping environment for applications that can be expressed as flow graphs using Intel Threading Building Blocks (Intel TBB) applications.
• It helps construct, validate and model application design and performance before coding in Intel TBB.
• It provides insights into the parallel algorithm efficiency
• Apart from TBB, it helps visualize DPC++ asynchronous task graphs, provides insights to task scheduling inefficiencies and analyzes open MP task dependencies for better performance
Example of How to Use Intel Advisor
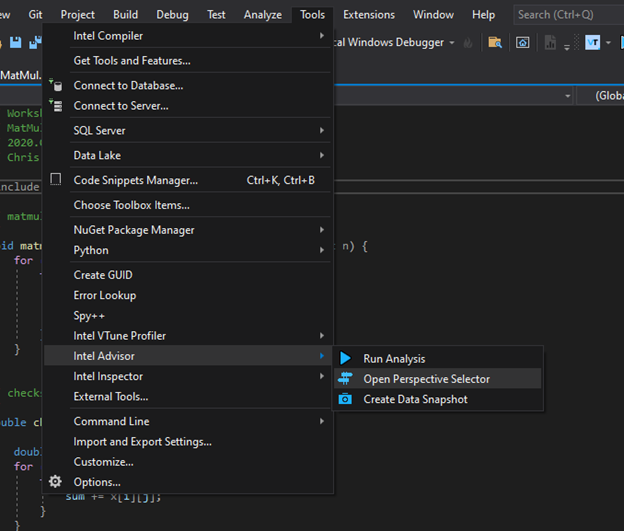
Intel Advisor is available in either stand alone or as part of OneApi. Using it as part of its integration into Visual Studio, here we run through some basic steps using the code from Workshop 03 (Matmul) for demonstration: Step One – Launching Advisor Launching Intel Advisor, found under Tools/Intel Advisor:
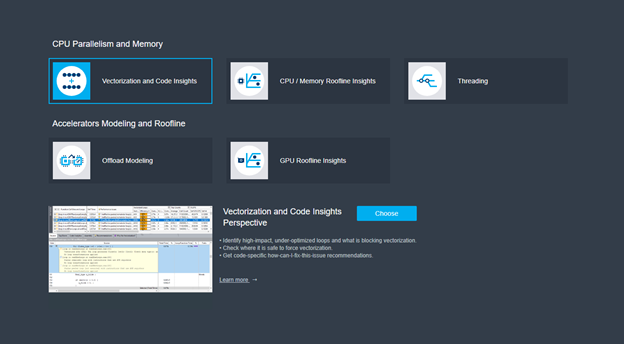
Which opens the following window:
Here we will select Vectorization and Code Insights first and get the when running a survey (using the play key on the left menu):
Selecting the Characterization section on the right and running that will give us a Roofline report:
