GPU621/Debugging OpenMP
Group Members
// TODO: Create a tutorial on how to debug parallel programs using OpenMP in Visual Studio
// remember to add pictures if possible
// Steps
1. Read the Microsoft Documentation for your section
2. Paraphrase the contents of your section onto the Wiki
3. Test it yourself in Visual Studio and add examples
// Uploading Files
To upload a file, go to https://wiki.cdot.senecacollege.ca/wiki/Special:Upload
To include a file in a page, use [[File:File.jpg]] to use the full version of the file
Process and Thread
Process
A process is an instance of a program executed by the computer. Processes are started when programs are initiated, and they can be comprised of one or more threads.
On Windows operating systems, you can look at your running processes on the Task Manager.
Thread
A single thread is a set of instructions that the CPU schedules and executes independently. A process consists of one or more threads which are able to be run concurrently. This forms the basis of multithreading.
Multiple Processes
Background
Visual Studio supports the creation of solutions with multiple processes. Visual Studio's debugger will by default run the first project (selected in bold), but this can be changed in the Solution Explorer by right-clicking on a different project and selecting Set as Startup Project. This will allow you when debugging to switch between processes, as well as break, stop, and continue currently debugging processes.
Setup
Startup Project
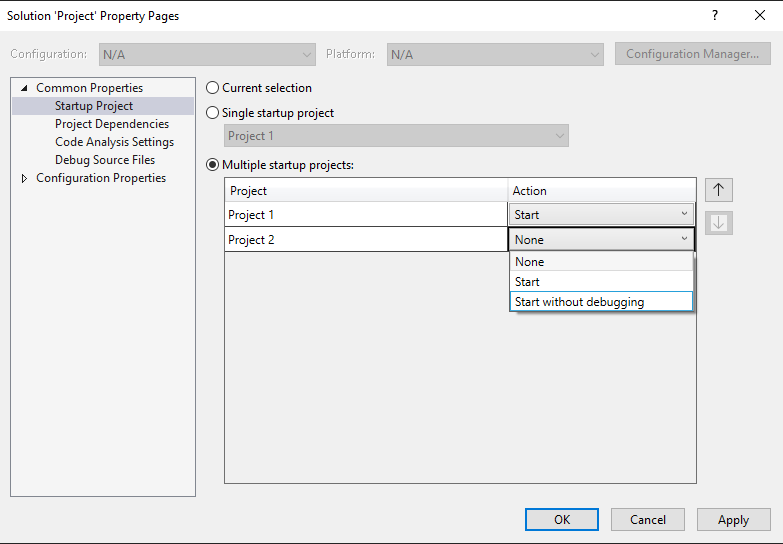
To set the startup project or multiple projects:
- Right-click the solution in the Solution Explorer and select Properties.
- In the Properties window, select Common Properties > Startup Project.
- Here you can change the Startup Project to either the currently selected project, a single startup project (this is selected by default), or multiple startup projects.
- When selecting Multiple startup projects, you can modify the execution order and action for each project between Start, Start without debugging, or None.
- Save your settings by selected Apply or OK.
Command Scope
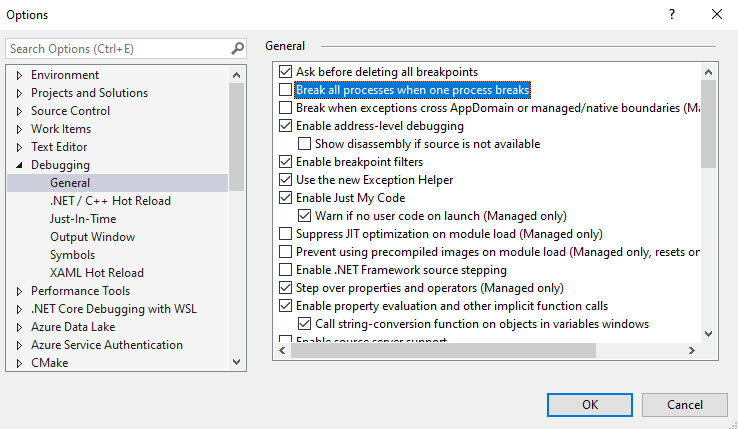
When debugging with multiple processes, the break, step, and continue debugger commands will affect all processes by default. This can have unintended consequences when debugging. To gain more control over the targets, you can and should change these settings. You can do so by going to Tools (or Debug) > Options > Debugging > General, and clearing the checkbox Break all processes when one process breaks.
Attach to Process
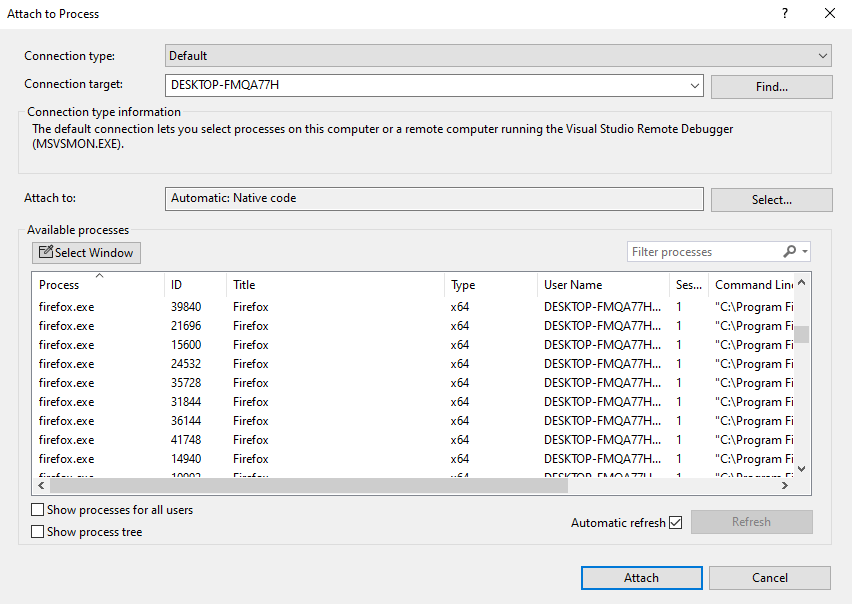
The Visual Studio debugger has the capability to attach to applications running in processes outside of Visual Studio locally and remotely. This is useful You can use the debugger while attached to a separate app, though some features may be limited. To attach to a running process:
- With the app and Visual Studio running, select Debug > Attach to Process.
- Select the desired process from the list and select Attach.
- If you have multiple identical processes, use the w3wp process details or Command Line column to identify the correct process to use.
- In the Attach to field, change the setting to Automatic to the specific type if necessary. Automatic will work for most applications.
Keep in mind that Visual Studio will not attach to any child process spawned by the debugged process. You will have to manually attach it to the new child.
Registry Editor
The Windows Registry Editor can be used to automatically start a process in the debugger. This will allow you to debug the startup code for an app that is launched by another process, such as Windows services.
- Start the Windows Registry Editor by running regedit.exe from the run window (Windows + R).
- In the Registry Editor, go to HKEY_LOCAL_MACHINE\SOFTWARE\Microsoft\Windows NT\CurrentVersion\Image File Execution Options.
- Select the folder of the app to start in the debugger.
- If the app isn't listed, right-click Image File Execution Options, select New > Key, and enter the application's name.
- Right-click the new key in the tree and select New > String Value.
- Change the name of the new value from New Value #1 to
debugger. - Right-click the new value and select Modify. Change the value data to
vsjitdebugger.exeand select OK. - In the Edit String dialog box, enter
vsjitdebugger.exein the Value data box, and then select OK.
Debugging
Switching Between Processes
While you've done all this work to be able to use multiple processes, only one process can be debugged at a time. You will need to break all processes in order to switch between processes. There are two ways to set the current process:
- Open the Debug Location toolbar through View > Toolbars > Debug Location.
- While you are debugging, select the process to set on the Debug Location toolbar.
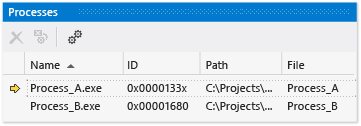
The other method is to use the processes window.
- While you are debugging, open the processes window through Debug > Windows > Processes.
- Double-click the process you want to set as the current process. The current active process is marked by a yellow arrow.
You can now start debugging multiple processes with Visual Studio! You can break, step, and continue processes independent of each other, as well as being able to switch between multiple active processes in your solution. The next step is to familiarize yourself with the Visual Studio parallelization user interface.
Stopping Debugging
When you stop debugging, the process is ended by default. This will detach the debugger from any attached applications if necessary and then end the process. This will keep the previously attached process running. You can change this default setting by right-clicking the process in the Processes window and clearing the Detach when debugging stopped option.
User Interface
// TODO: Show the window and explain what it does for every single window below (medium)
// documentation for windows are here: https://learn.microsoft.com/en-us/visualstudio/debugger/debug-threads-and-processes?view=vs-2022
Attach to Process Dialog Box
Process Window
Thread Window
Source Window
Debug Location Window
Parallel Stacks Window
Parallel Tasks Window
Parallel Watch Window
Walkthrough
Environment
IDE
- Microsoft Visual Studio 2019
Compiler
- Intel oneAPI DPC++/C++
Sample Code
#include <stdio.h>
#include <omp.h>

int main(int argc, char** argv) {
    int partial_Sum, total_Sum;

#pragma omp parallel private(partial_Sum) shared(total_Sum)
    {
        partial_Sum = 0;
        total_Sum = 0;

#pragma omp for
        {
            for (int i = 1; i <= 1000; i++) {
                partial_Sum += i;
            }
        }

        //Create thread safe region.
#pragma omp critical
        {
            //add each threads partial sum to the total sum
            total_Sum += partial_Sum;
        }
    }
    printf("Total Sum : % d\n", total_Sum);
    return 0;
}
Configuration
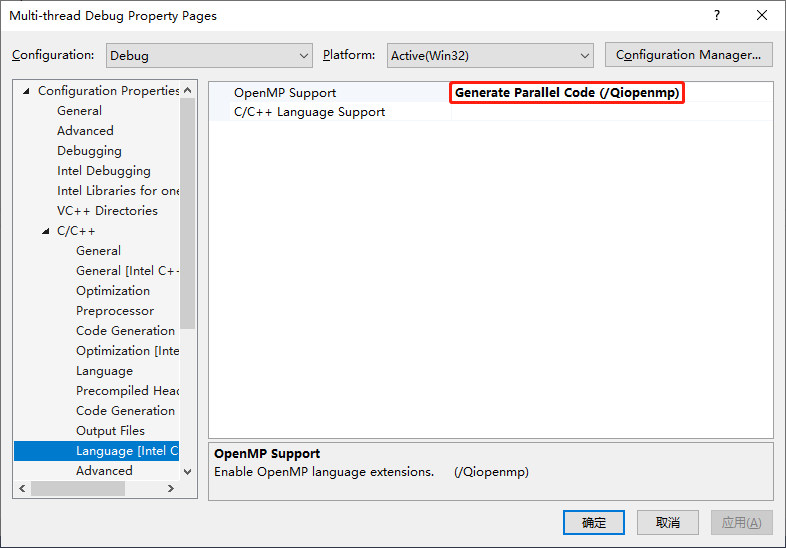
Enable OpenMP for the current project file
Project - Property - C/C++ - Language [Intel C++] - OpenMP Support - Generate Parallel Code (/Qiopenmp)
Output
- The output of the sample program
Case A: Using the Thread Window
// TODO: walkthrough on using thread window to debug (medium)
Case B: Using the Parallel Stacks Window
// TODO: walkthrough on using parallel stacks window to debug (long)
