GPU621/OpenMP Debugging
Group Members
Process and thread
Process
A process is the instance of a computer program that is being executed by one or many threads.
Thread
A thread is a sequence of instructions to which the operating system grants processor time. Every process that is running in the operating system consists of at least one thread. Processes that have more than one thread are called multithreaded.
Multiple Processes Debug
Visual Studio can debug a solution that has several processes. You can start and switch between processes, break, continue, and step through source, stop debugging, and end or detach from individual processes.
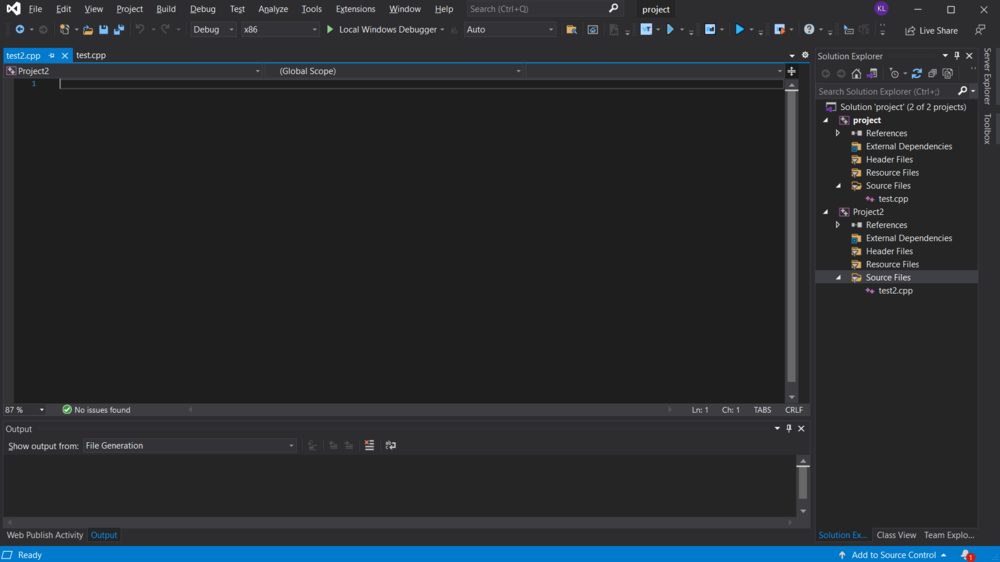
Create two projects
To test it, the best way with Visual Studio is creating two projects.
- 1. Create a new project of Visual Studio
- 2. Add a new project within the Solution
- 3. Add test files on each projects
Start debugging with multiple processes
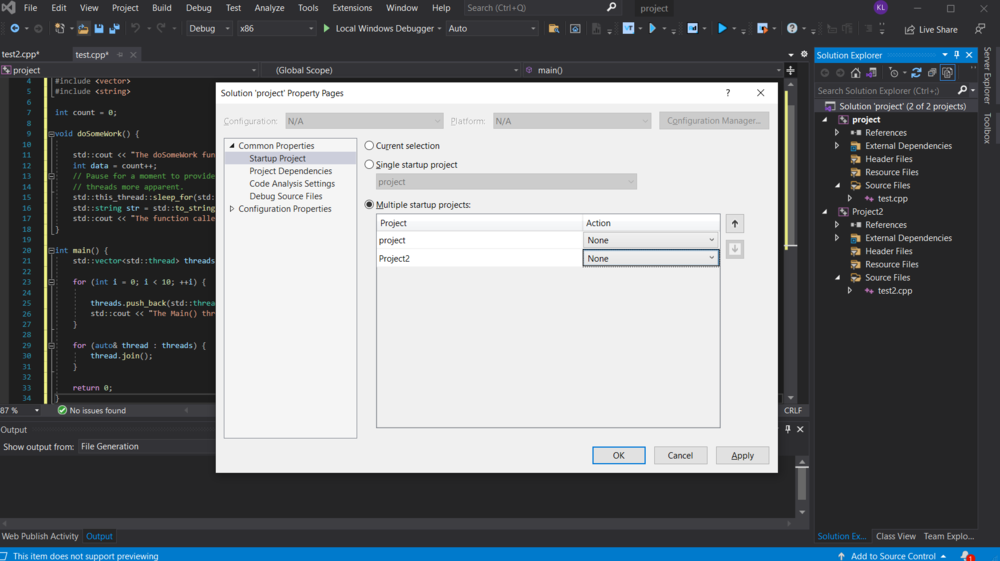
If you have more than one project in a project solution, you can choose which projects the debugger starts.
Follow this:
- Select the solution in Solution Explorer and then select the Properties icon in the toolbar, or right-click the solution and select Properties.
- On the Properties page, select Common Properties > Startup Project.
- Select Current selection, Single startup project and a project file, or Multiple startup projects.
- If you select Multiple startup projects, you can change the startup order and action to take for each project: Start, Start without debugging, or None.
- Select Apply, or OK to apply and close the dialog.
Attach to a process
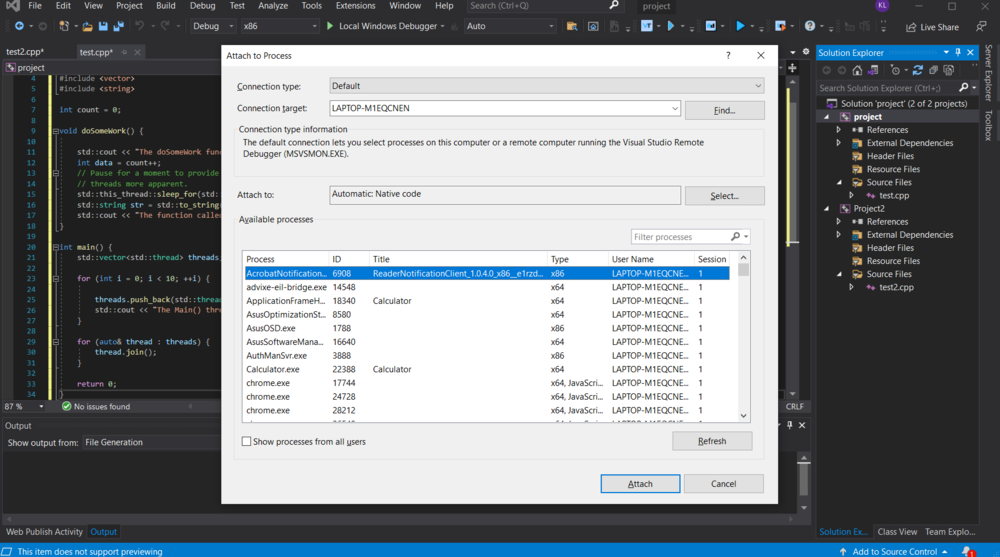
The debugger can also attach to apps running in processes outside of Visual Studio, including on remote devices. After we attach to an app, we can use the Visual Studio debugger.
Follow this:
- With the app running, select Debug > Attach to Process.
- In the Attach to Process dialog box, select the process from the Available Processes list, and then select Attach.
Use the Registry Editor to automatically start a process in the debugger
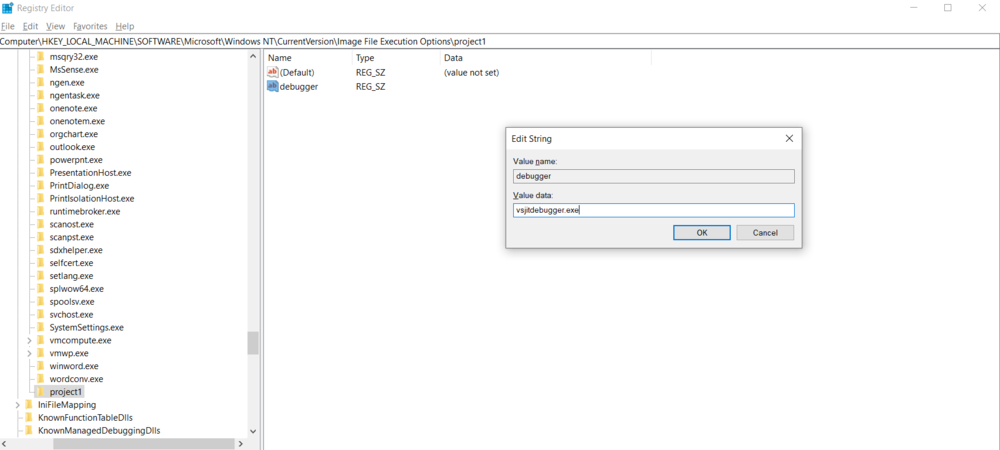
We might need to debug the startup code for an app that is launched by another process. You can have the debugger launch and automatically attach to the app.
Follow this:
- Start the Windows Registry Editor by running regedit.exe.
- In Registry Editor, navigate to HKEY_LOCAL_MACHINE\Software\Microsoft\Windows NT\CurrentVersion\Image File Execution Options.
- Select the folder of the app that you want to start in the debugger.
- If the app isn't listed as a child folder, right-click Image File Execution Options, select New > Key, and type the app name. Or, right-click the new *key in the tree, select Rename, and then enter the app name.
- Right-click the new key in the tree and select New > String Value.
- Change the name of the new value from New Value #1 to debugger.
- Right-click debugger and select Modify.
Debug with multiple processes
When debugging an app with several processes, the breaking, stepping, and continuing debugger commands affect all processes by default. You can change this option.
Follow this:
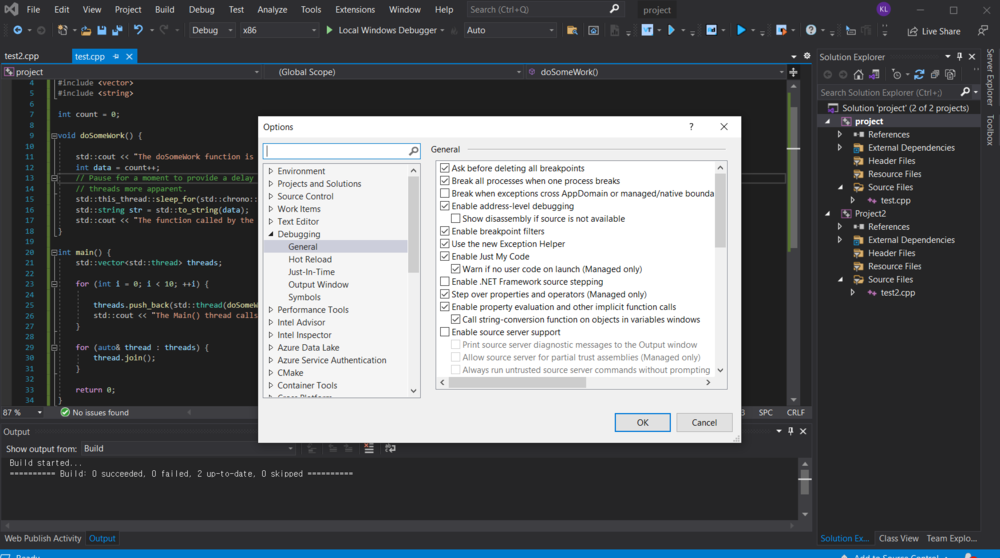
- Under Tools (or Debug) > Options > Debugging > General, select or clear the Break all processes when one process breaks check box.
Switch between processes
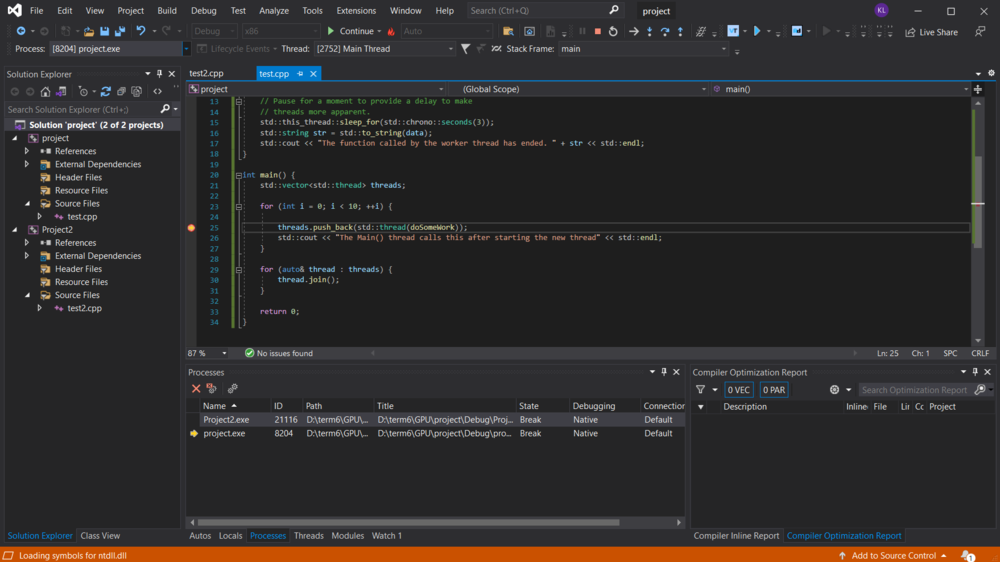
Only one process should be active in the debugger at any given time. We can set the active or current process in the Debug Location toolbar, or in the Processes window. To switch between processes, both processes must be in break mode.
To set the current process from the Debug Location toolbar:
- To open the Debug Location toolbar, select View > Toolbars > Debug Location.
- During debugging, on the Debug Location toolbar, select the process you want to set as the current process from the Process dropdown.
To set the current process from the Processes window:
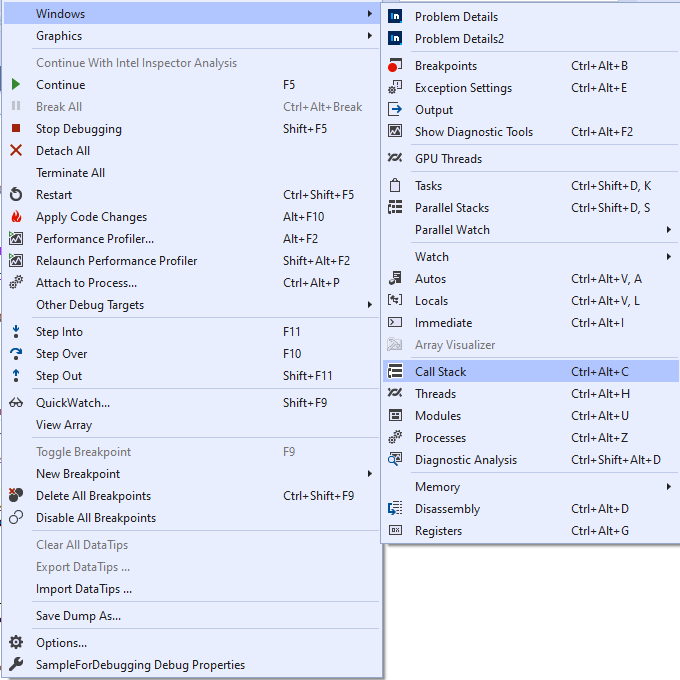
- To open the Processes window, while debugging, select Debug > Windows > Processes.
- In the Processes window, the current process is marked by a yellow arrow. Double-click the process you want to set as the current process.
User Interface
For processes, the primary tools are the Attach to Process dialog box, the Processes window, and the Debug Location toolbar.
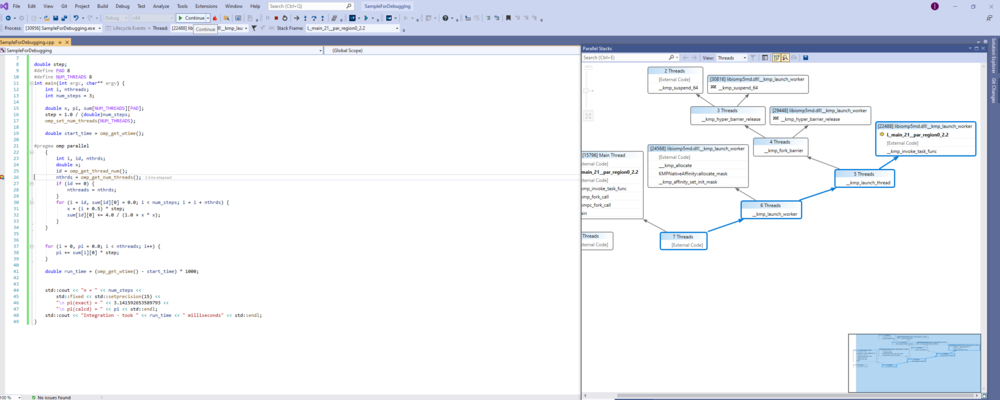
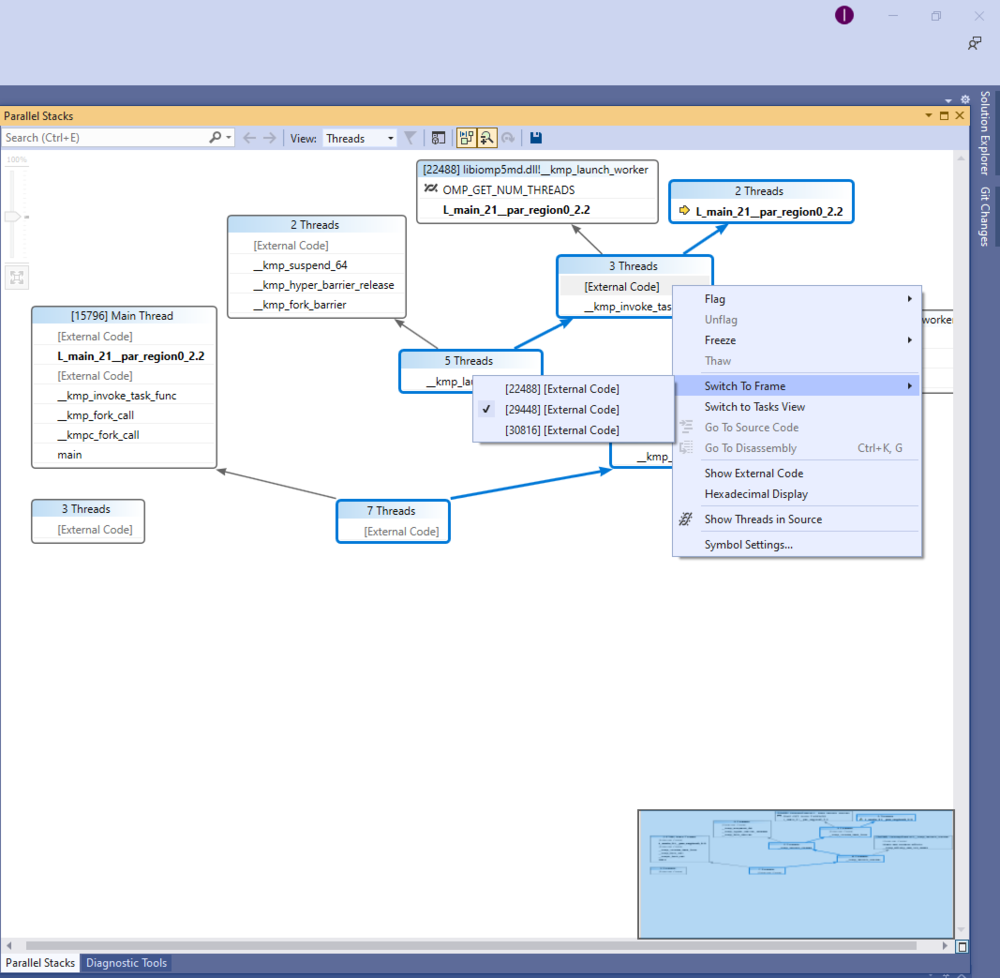
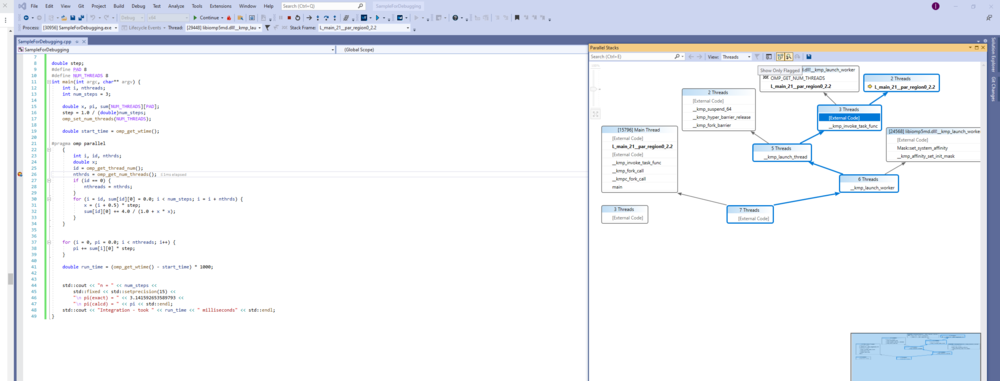
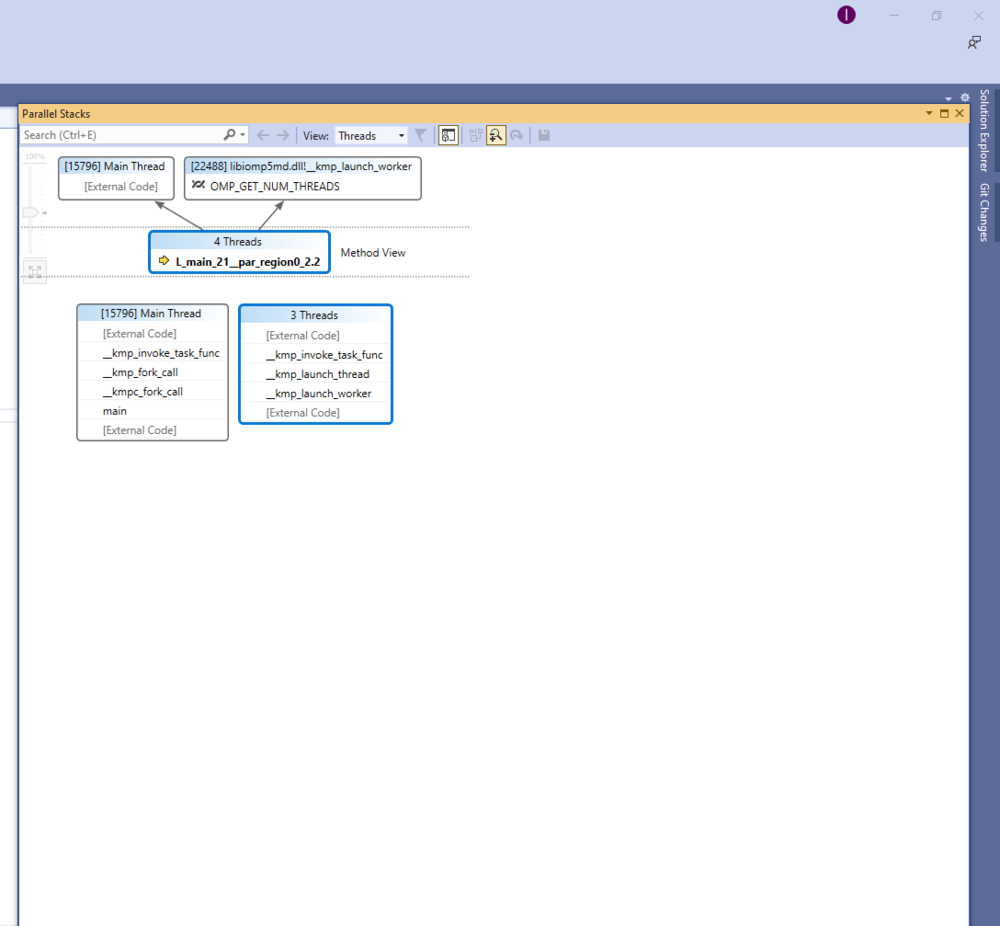
For threads, the primary tools for debugging threads are the Threads window, thread markers in source windows, Parallel Stacks window, Parallel Watch window, and the Debug Location toolbar.
Attach to Process dialog box
The Attach to Process dialog box shows outside processes to be attached to the visual Studio debugger.
You can attach the following processes
- Process name (.exe)
- Process ID number
- Menubar Title
- Type (Managed v4.0; Managed v2.0, v1.1, v1.0; x86; x64; IA64)
- User Name (account name)
- Session number
Action you can perform
- Select a process to attach to
- Select a remote computer
- Change transport type for connecting to remote computers
Processes window
The Process Window shows processes attached to the Visual Studio debugger. You can choose one of the processes during debugging mode.
Threads window
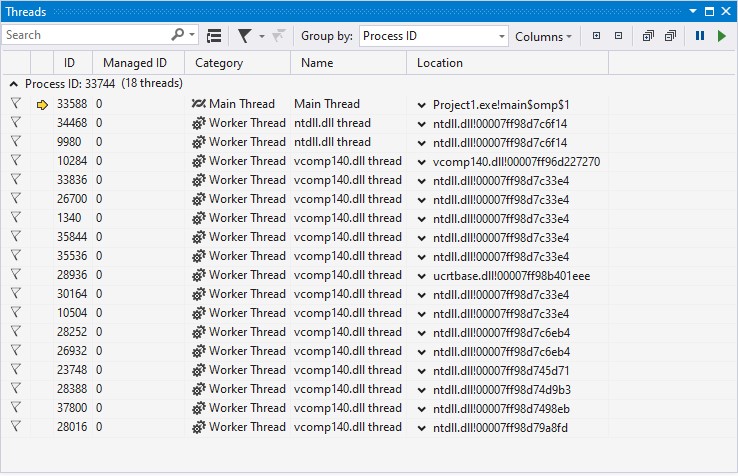
Threads window is a utility built into Visual Studio. It allows for easy management/monitoring of a program's threads, while debugging.
Setup: In the program in question, add breakpoints on lines where you would like to inspect thread activity. To add a breakpoint, right-click the line and add a breakpoint from the menu.
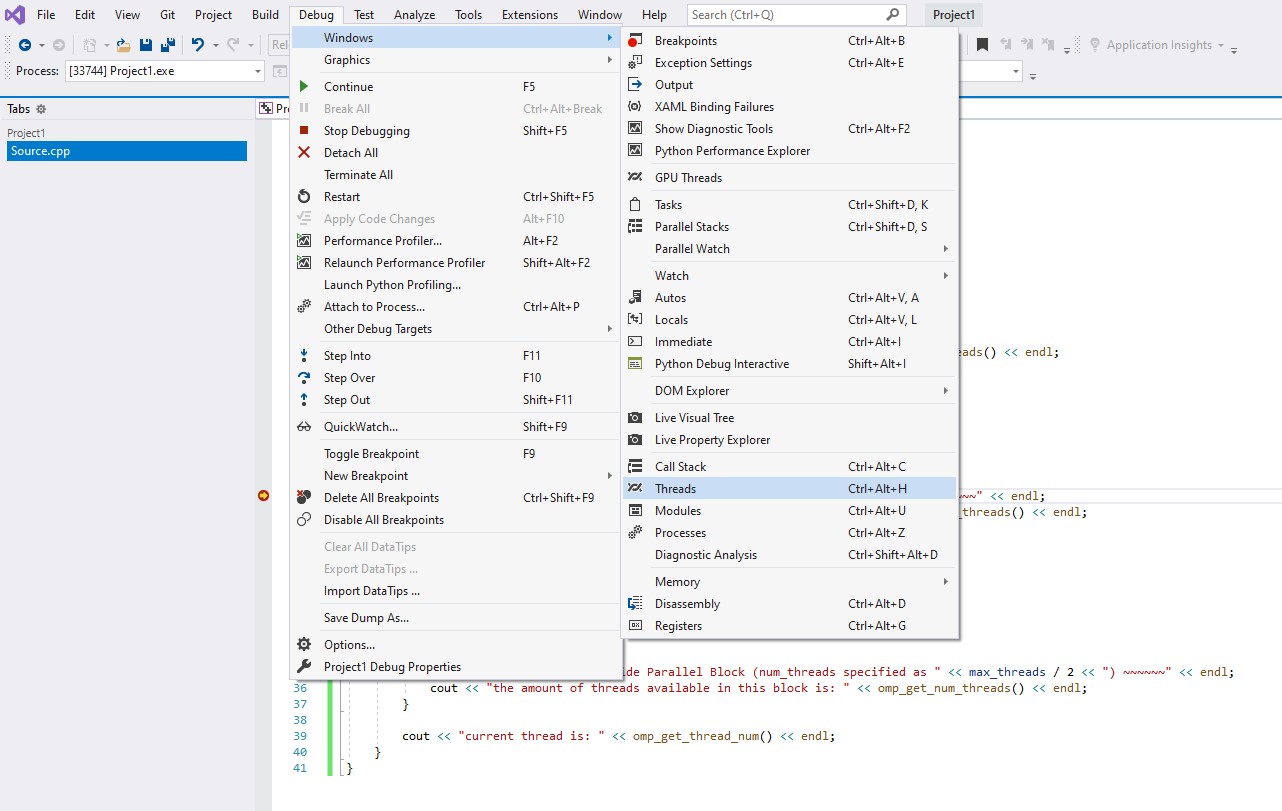
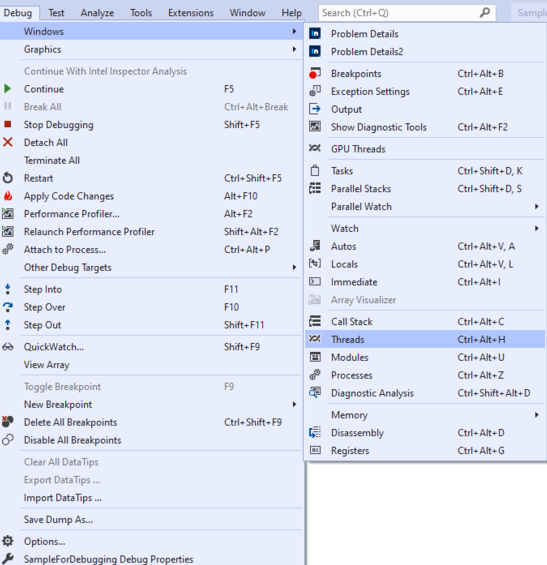
When you run the code from Visual Studio, execution will stop when the program reaches your breakpoint(s). From here, go to Debug > Windows > Threads. Alternatively, you can press CTRL + ALT + H.
How to Use:
Usage of the Thread Window is intuitive and ultimately up to the user. It has several columns (some hidden by default) which display several fields of data.
Columns:
Flag Denotes which threads a user would like to pay special attention to.
Current Thread An arrow in this column indicates the current thread.
ID Displays a thread's identification number.
Managed ID Displays managed identification numbers.
Category Shows a thread's category. Categories are: User Interface Threads, Remote Call Procedure Handlers, or Worker Threads.
Name Identifies each thread by name.
Location Shows where a thread runs.
Priority Shows the precedence assigned to a thread by the system (hidden by default).
Affinity Mask Shows the affinity mask for a thread. Affinity mask determines which processors a thread can run on. This column is hidden by default.
Suspended Count This determines if a thread can run. This column is hidden by default.
Process Name Displays the name of the process to which a thread belongs. This column is hidden by default.
Process ID Displays the ID of the process to which a thread belongs. This column is hidden by default.
Transport Qualifier Identifies the machine to which the debugger is connected.
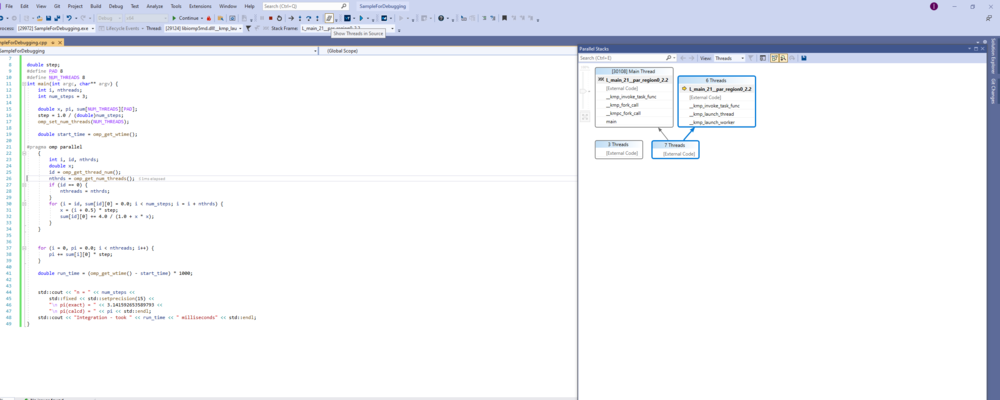
Source window
Visual Studio's Source Window displays a project's source code.
Setup:
This is the default window when working in visual studio. If it is closed for a particular file, it can be re-opened by double clicking any linked items (like functions imported from it), or by double clicking the filename in the project pane.
Alternatively, should you start your program in debug mode (f5) and your program for some reason pauses (at a breakpoint or otherwise), a source window for the script where the program paused is opened.
How to Use:
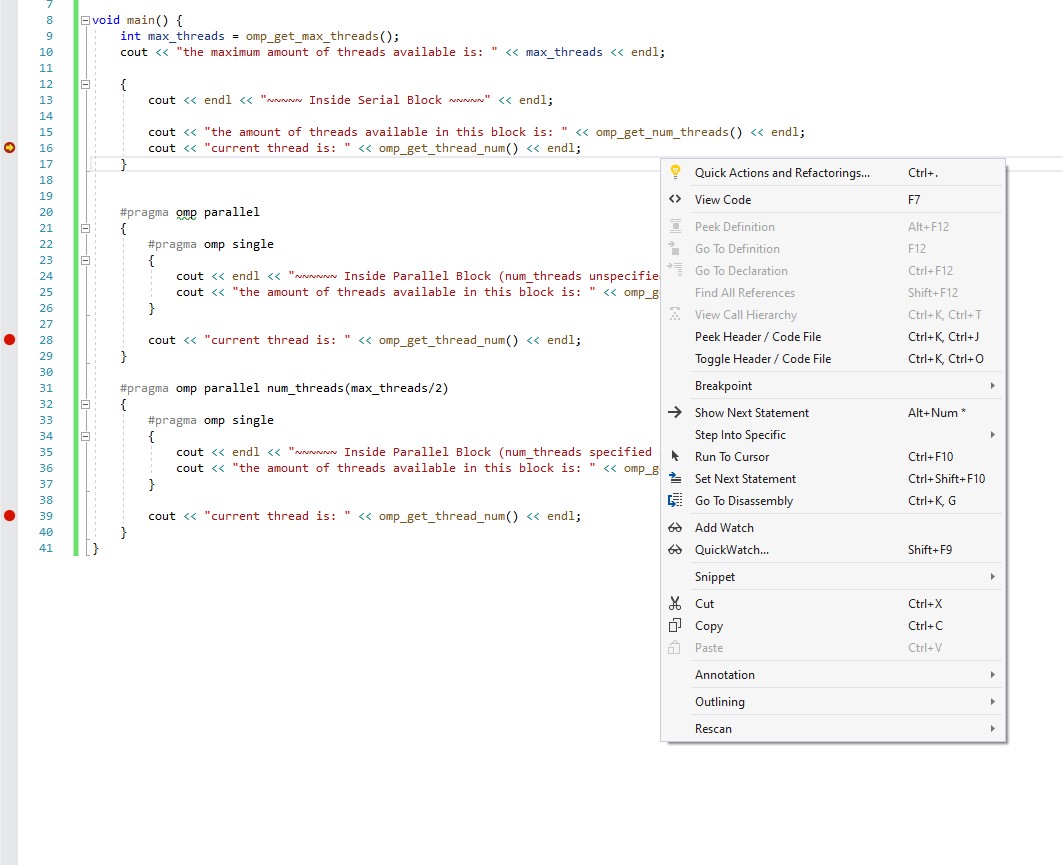
Source Window has many options for debugging. From the debug menu, many diagnostic tools can be accessed. Furthermore, the context menu in this window has many features which can help in debugging. See this image for more details.
In the this window's gutter, breakpoints appear as red dots. They can be added or removed by clicking in the gutter.
Debug Location toolbar
You can set the active or current process in the Debug Location toolbar.
Debug Location toolbar has the following options:
- Current process
- Suspend the application
- Resume the application
- Suspend and shut down the application
- Current thread
- Toggle current thread flag state
- Show only flagged threads
- Show only current process
- Current stack frame
With this options you can perform the following actions:
- Switch to another process
- Suspend, resume, or shut down the application
- Switch to another thread in current process
- Switch to another stack frame in current thread
- Flag or unflag current threads
- Show only flagged threads
- Show only the current process
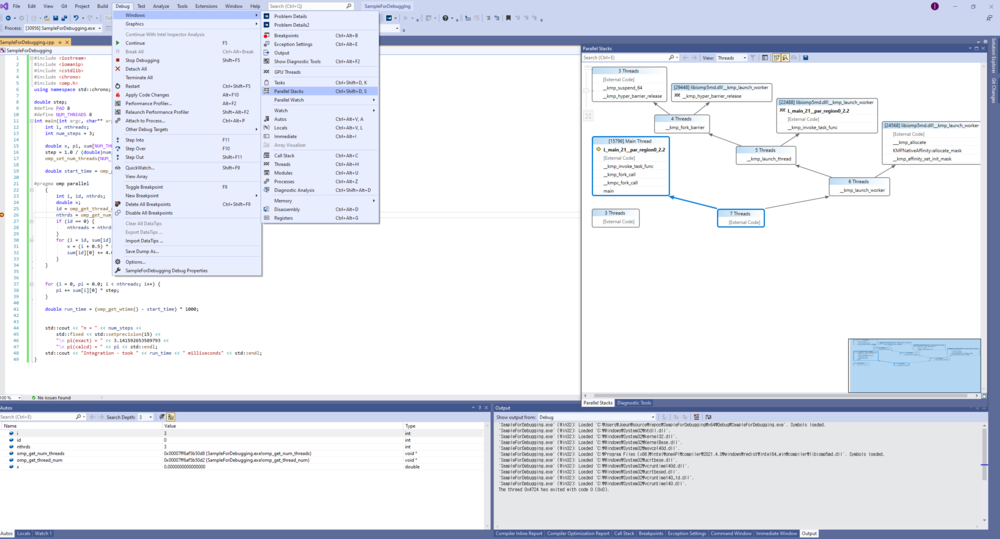
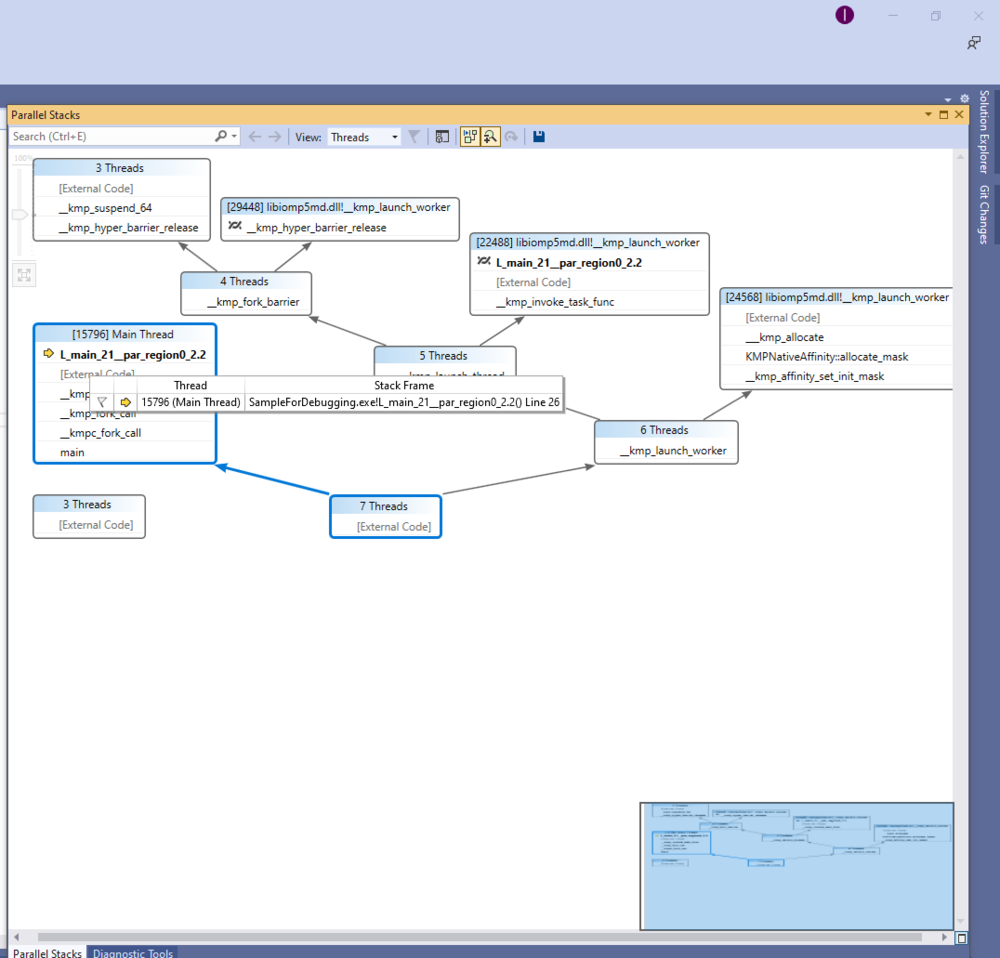
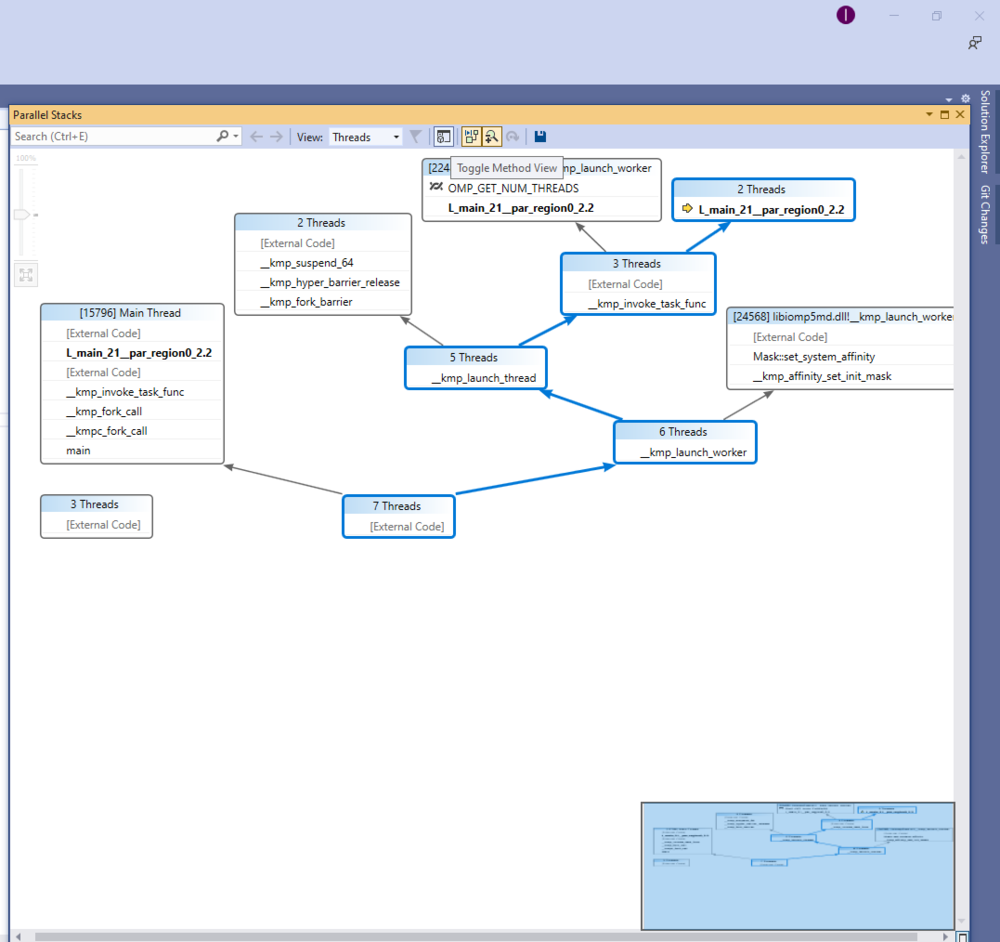
Parallel Stacks window
Setup: Run Debug with a breakpoint
Select Debug from menu
How to Use:
1000px
Features:
Parallel Tasks window
Parallel Watch window
Setup:
How To Use:
Features:
Walkthrough
Case A - Using the Thread window
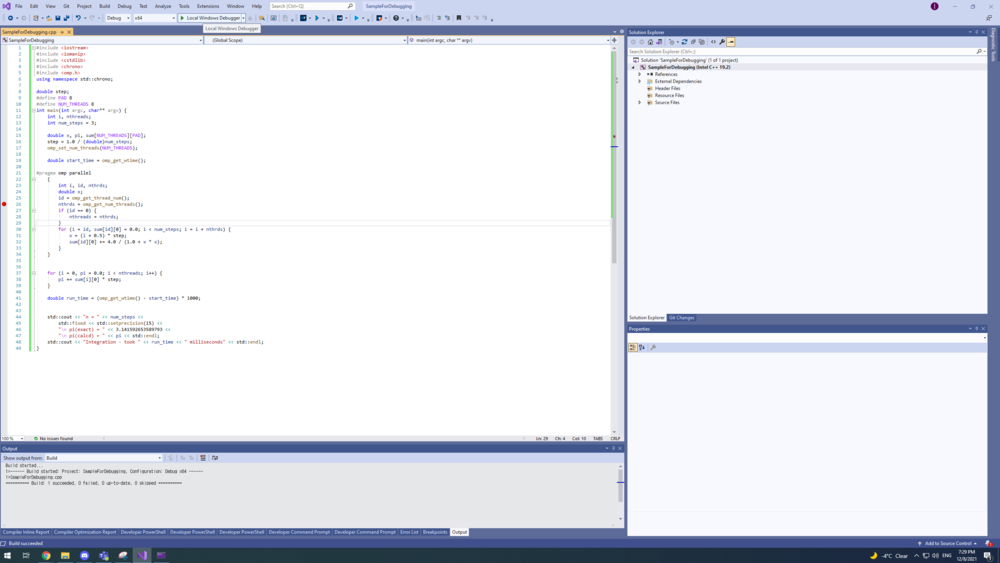
The following example of how to use Visual Studio's thread window was performed on Microsoft Visual Studio 2019 with Intel OneAPI Libraries and Intel Visual C++ Compiler.
This is the code used in the example.
// Thread Window Example

#include <iostream>
#include <omp.h>

using namespace std;

void main() {
	int max_threads = omp_get_max_threads();
	cout << "the maximum amount of threads available is: " << max_threads << endl;

	{
		cout << endl << "~~~~~ Inside Serial Block ~~~~~" << endl;

		cout << "the amount of threads available in this block is: " << omp_get_num_threads() << endl;
		cout << "current thread is: " << omp_get_thread_num() << endl;
	}


	#pragma omp parallel
	{
		#pragma omp single
		{
			cout << endl << "~~~~~~ Inside Parallel Block (num_threads unspecified) ~~~~~~" << endl;
			cout << "the amount of threads available in this block is: " << omp_get_num_threads() << endl;
		}


		cout << "current thread is: " << omp_get_thread_num() << endl;
	}

	#pragma omp parallel num_threads(max_threads/2)
	{
		#pragma omp single
		{
			cout << endl << "~~~~~~ Inside Parallel Block (num_threads specified as " << max_threads / 2 << ") ~~~~~~" << endl;
			cout << "the amount of threads available in this block is: " << omp_get_num_threads() << endl;
		}

		cout << "current thread is: " << omp_get_thread_num() << endl;
	}
}
The first step is to enable openmp in project settngs. Project > Properties > C/C++ > Language >Open MP Support > Yes(/openmp)
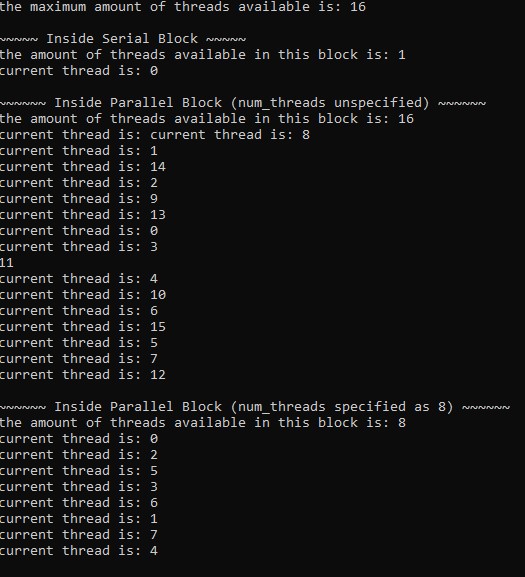
When this code is compiled with /openmp, and run. It should output something like this:
serial region
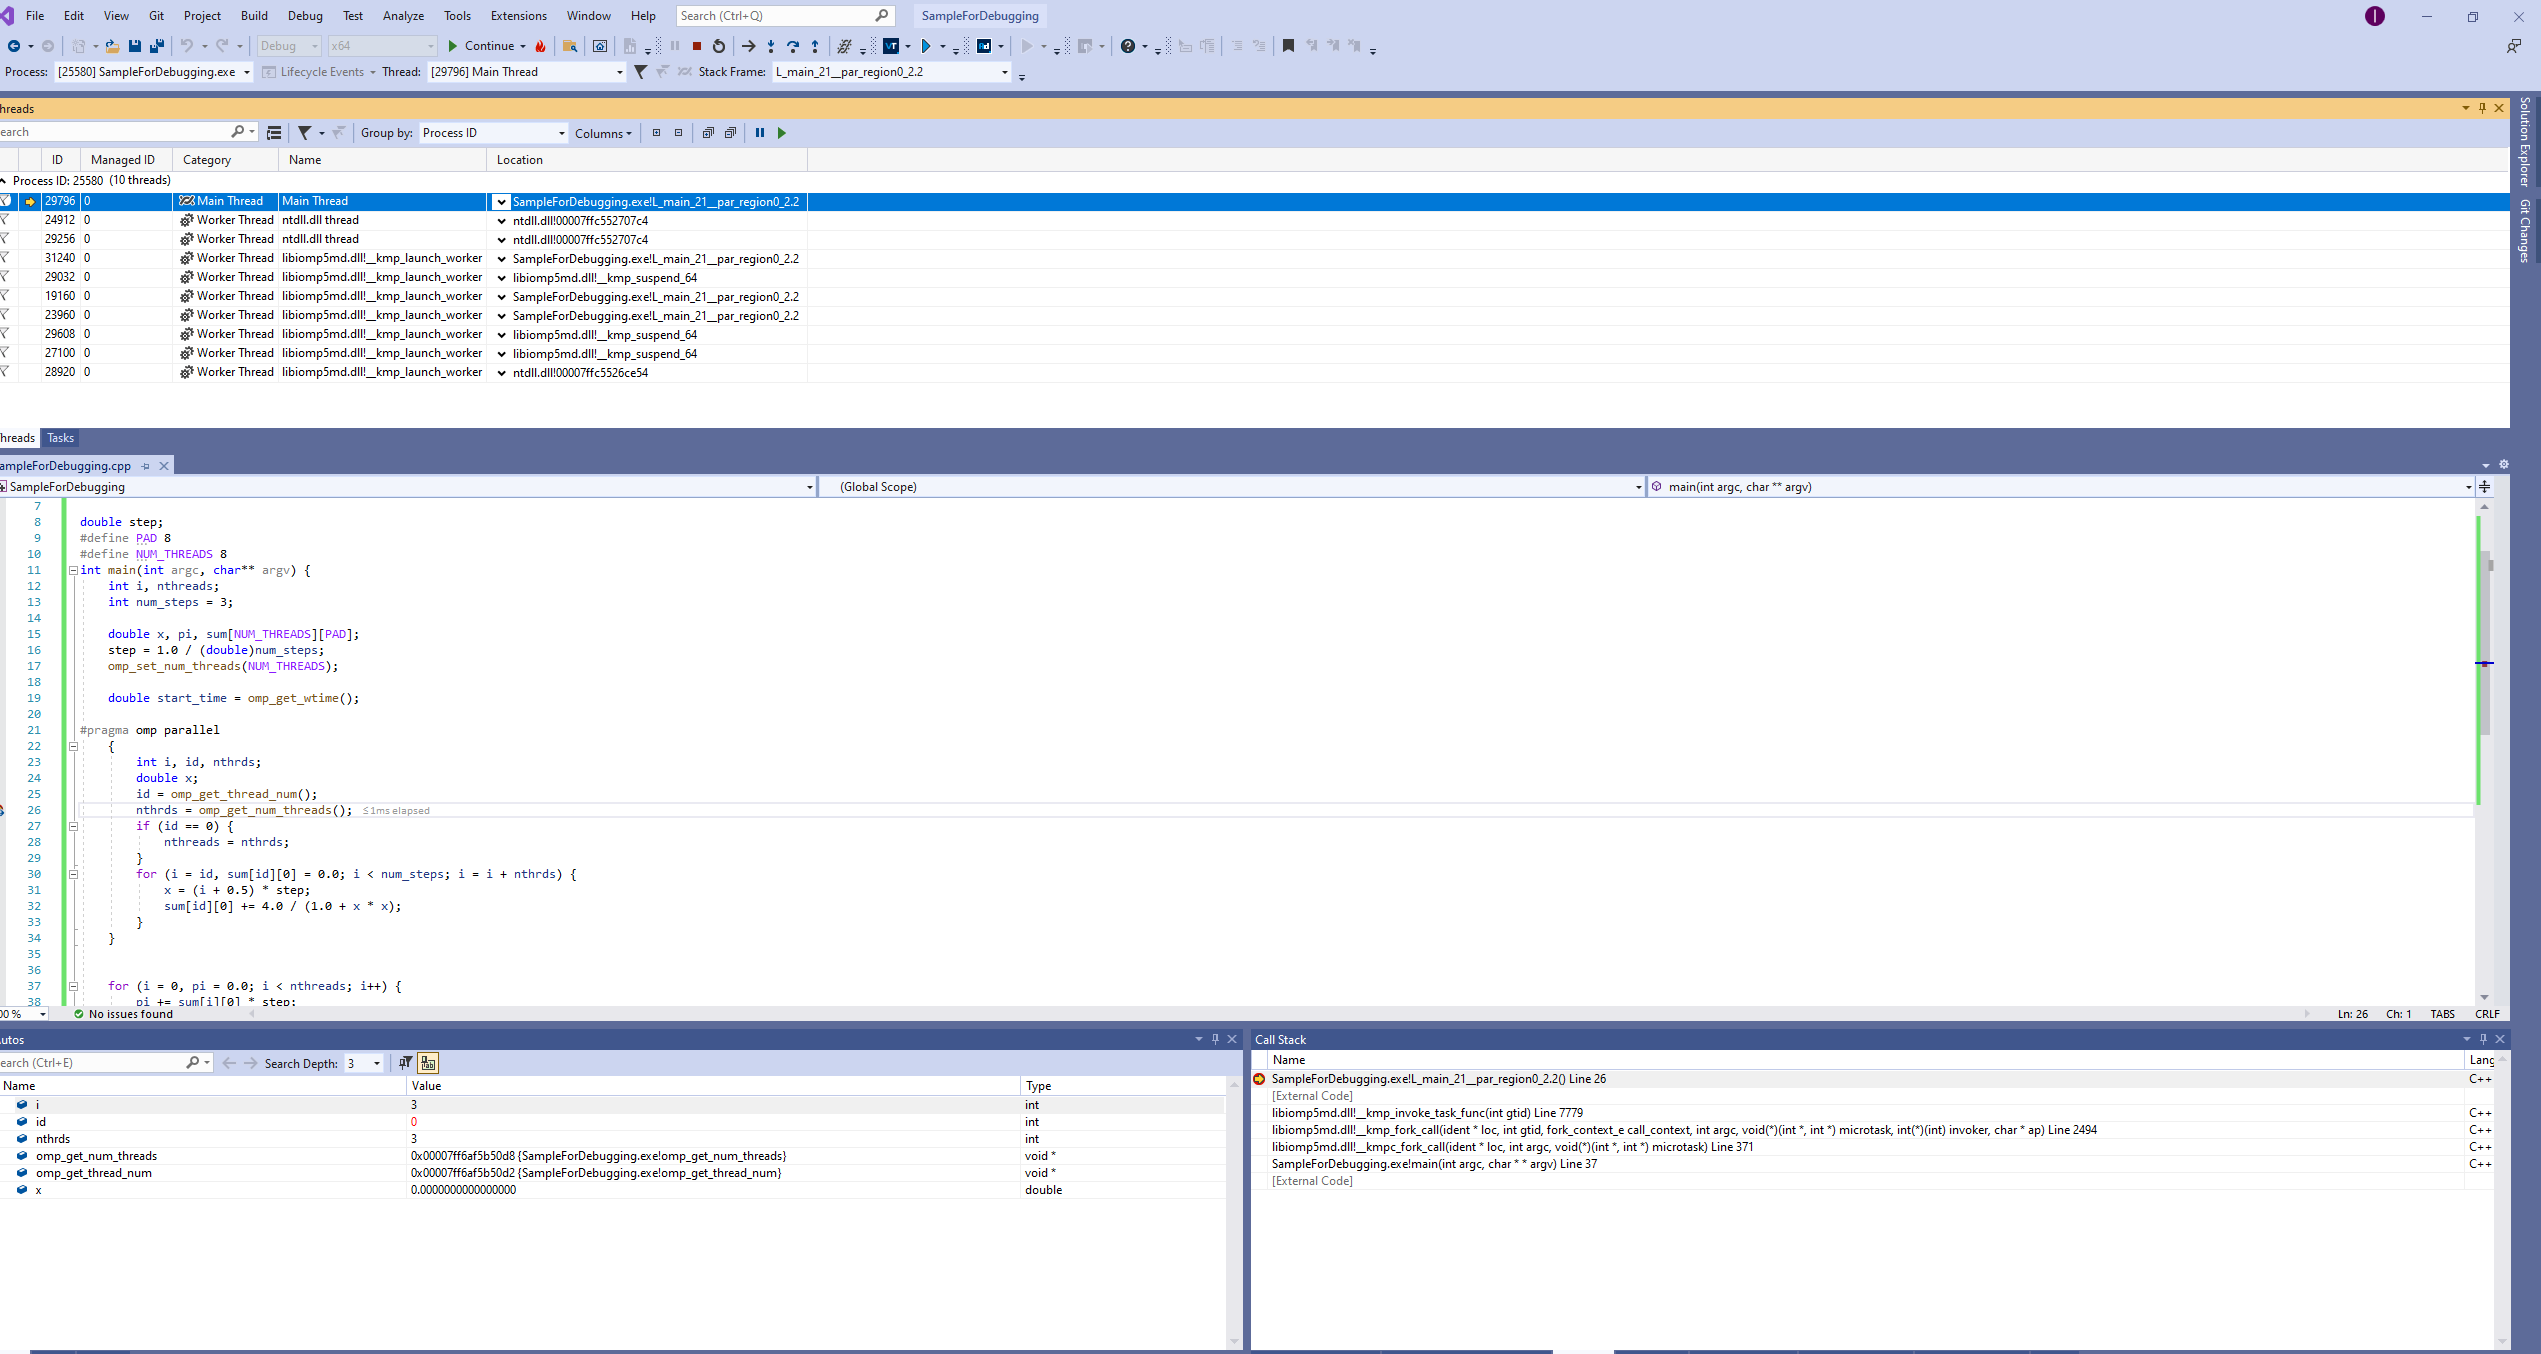
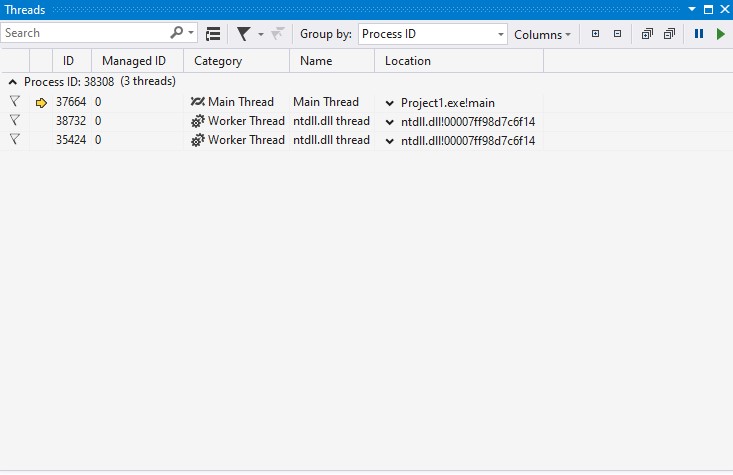
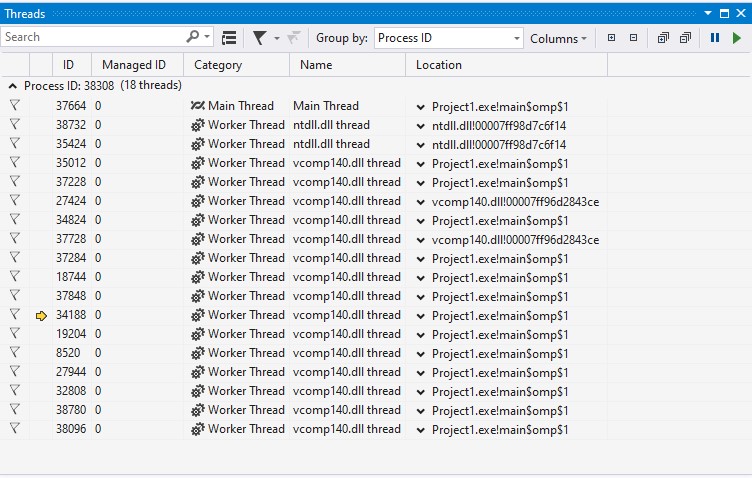
When inspecting threads in the Serial Region, only the main process thread is active. This is denoted by the yellow arrow which highlights the active thread at the breakpoint.
auto OpenMP parallel region
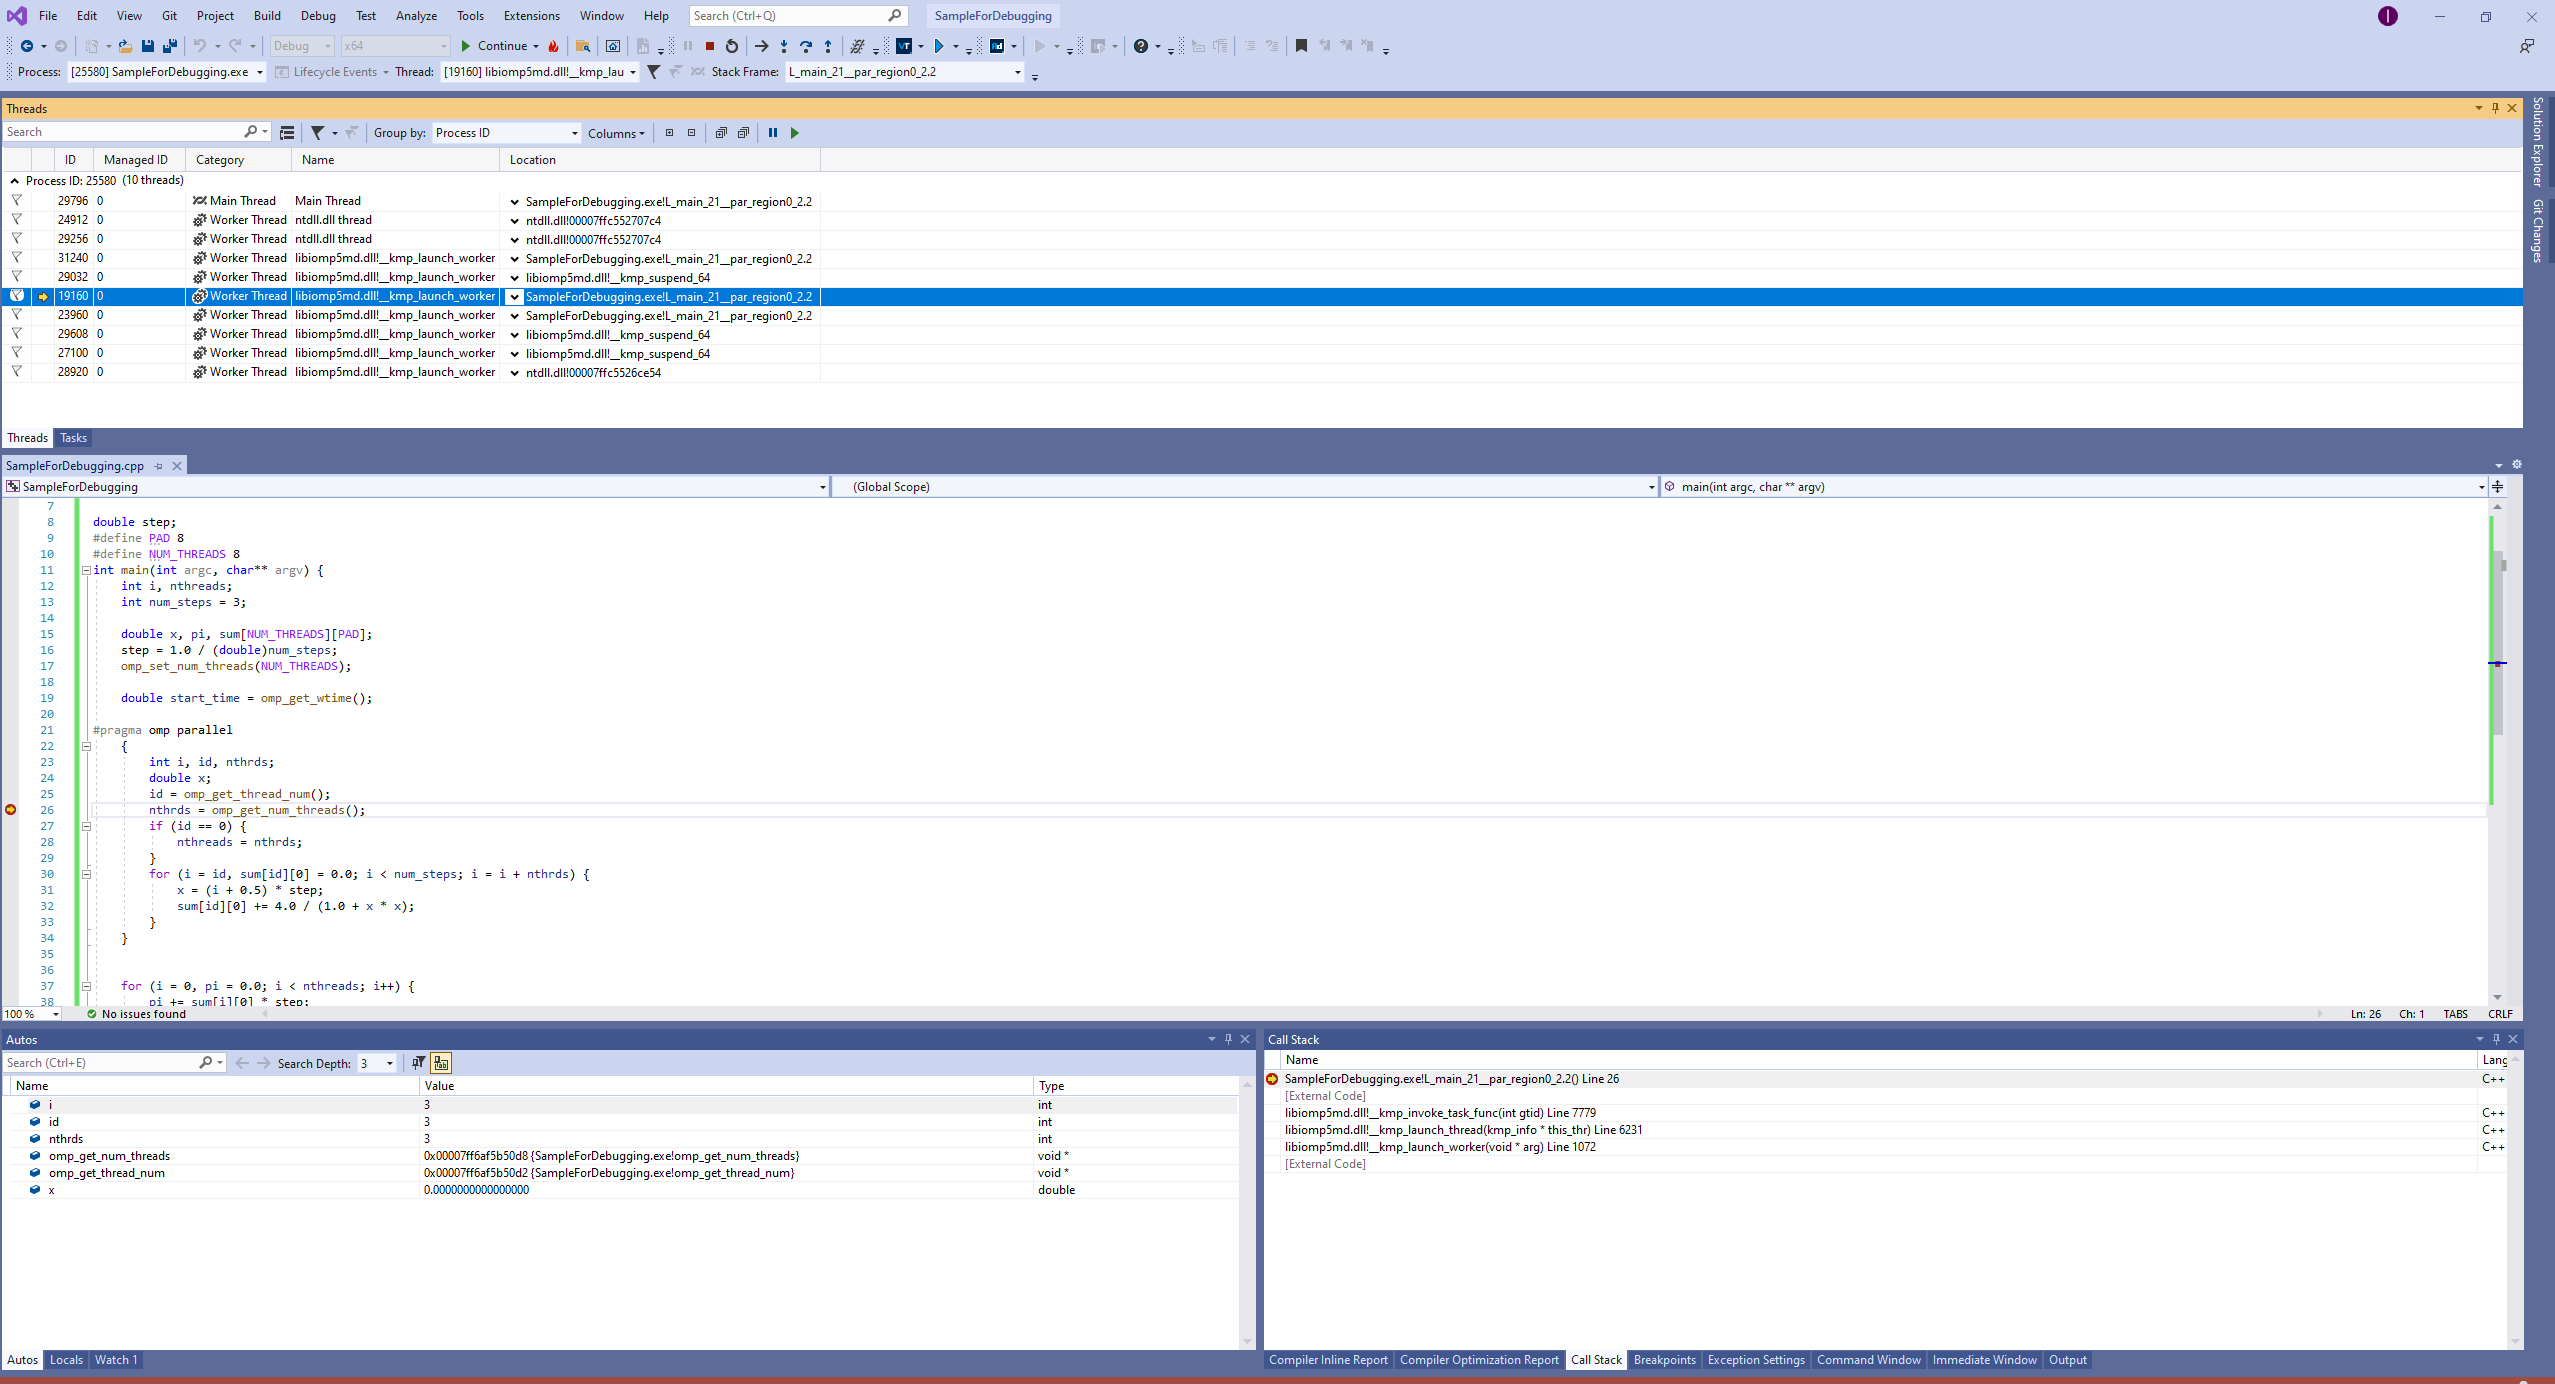
As expected in the parallel region (with number of threads unspecified), all threads are available to the program. At the moment when the first thread reaches the breakpoint, most other threads are idle.
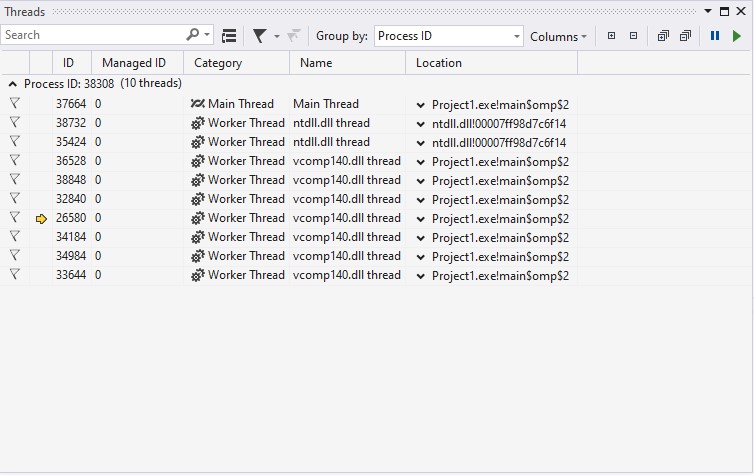
OpenMP parallel region thread number decided (8) With the number of threads specified, only that many threads are available in the region. This is clearly seen in ThreadWindow.
Case B - Using the Parallel Stacks and the Parallel Watch Window
{code}
- include <iostream>
- include <thread>
- include <vector>
- include<omp.h>
- include <chrono>
- include <string>
using namespace std; void print(int n, const std::string& str) {
   std::string msg = std::to_string(n) + " : " + str;
   std::cout << msg << std::endl;
}
int main() {
   std::vector<std::string> s = {
       "Hello World",
       "Hello",
       "This",
       "is",
       "a testing",
       "code",
       "for",
       "multithread",
       "debugging"
   };
   std::vector<std::thread> threads;
   for (int i = 0; i < s.size(); i++) {
       threads.push_back(std::thread(print, i, s[i]));
   }
   for (auto& th : threads) {
       th.join();
   }
   return 0;
} {code}
The main program calls the print function for the size of the string vector. Threads are open when it is called and join back on line 33.
Setup:
Set breakpoints at the definition of the function, and when join() is called.
Debug using F5 or by clicking debug from the top menu bar.
Here is the output of the program: ``` 0 : Hello World 3 : is 6 : for 2 : This 5 : code 7 : multithread 8 : debugging 1 : Hello 4 : a testing ```
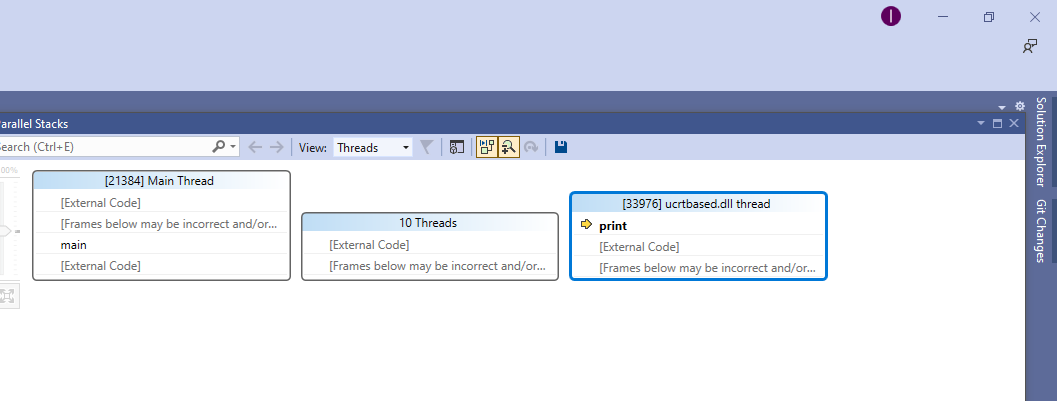
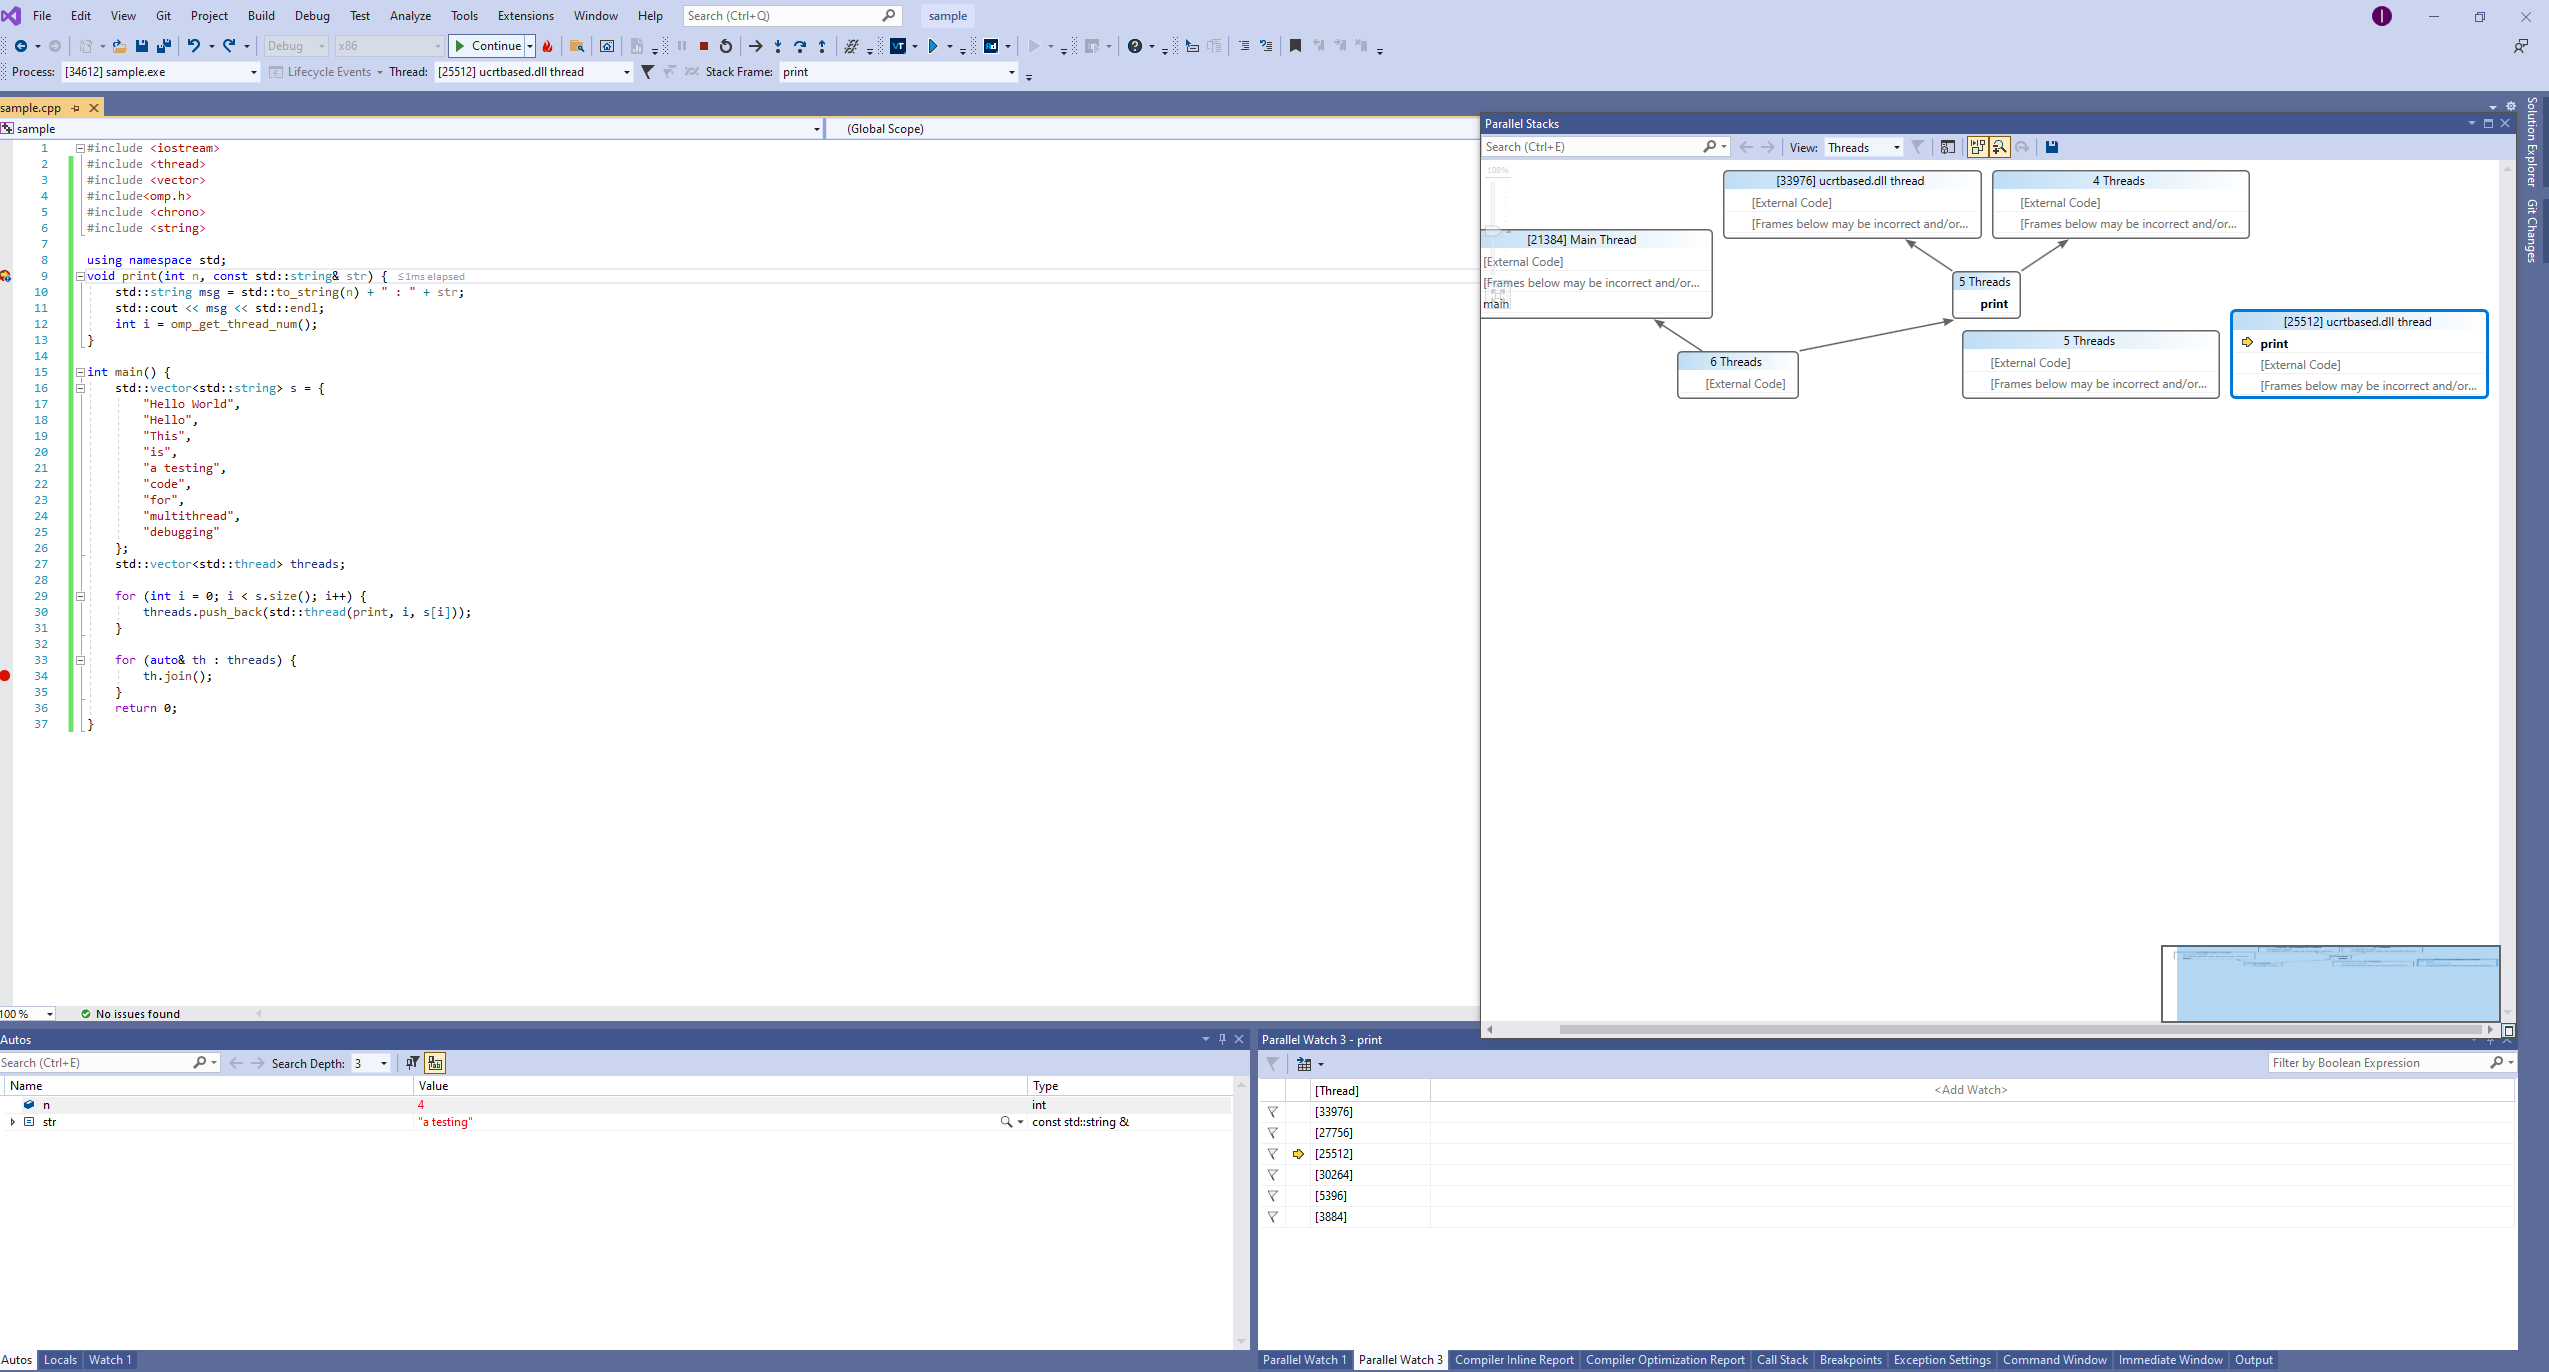
There are 9 different threads that were being created and used every time print() is called. Using Parallel Stacks Windows, we are able to see the call stack information through a UI.
Walkthrough:
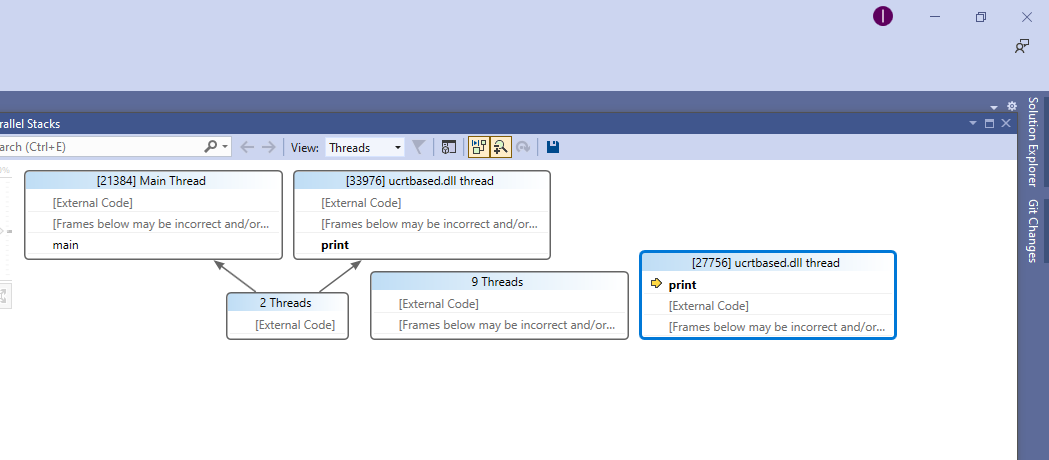
First call
It is being called at the definition of the function "print()"
The yellow arrow means the currently executing thread.
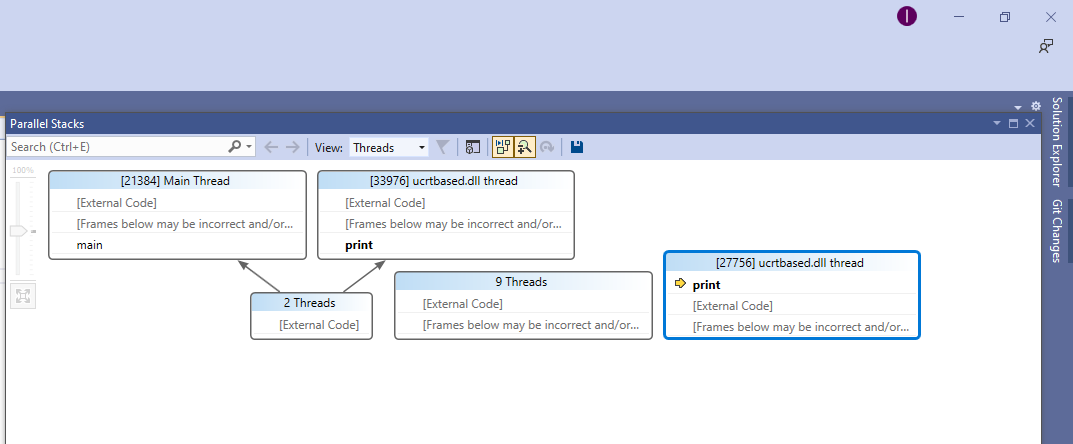
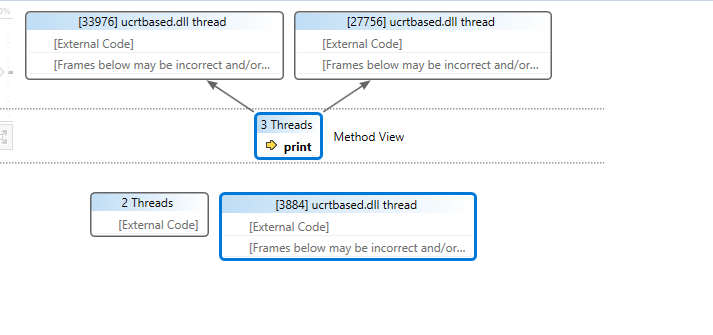
By advancing more threads,
more threads are created by the system.
When triggering the method view, it shows the related threads
Indicates the current thread that is being processed, and also lists the other threads. In the left bottom, shows the value of the current thread's n(number), and its string(which is "a testing" in the picture)
Forked threads are being joined after their usage.
