DPS921/Franky
Contents
Intel vTune Amplifier
Team Members
Introduction
Intel vTune Amplifier is a performance profiler. It is specifically designed to analyze various aspect of the run-time environment and provide a snapshot of how the program performed with respect to the hardware. Some of the information include the time consumed, percentage of time used per function call, and cpu core usage. It also performs few automated analysis to suggests different ways to improve the performance, especially when using TBB.
Our project aims to leverage the power of vTune Amplifier to improve a solution to a trivial challenge.
Details
Intel vTune Amplifier is a part of the Intel Parallel Studio package as well as a standalone package. It provides a comprehensive report of resource usage by the target executable. The information of the report includes Thread usage, Memory usage, Storage usage, and other system-level resource usage. It provides useful suggestions on how how to further maximize the performance, such as increasing the grainsize or increasing the scope of data. It also provides information on how different function calls performed during run-time. This is a powerful tool to perform a data-driven system improvement. Using this tool, the developer can quickly and accurately point out the source of bottleneck and resolve it to provide an increase in scalability.
To demonstrate its usability, our team will take on a trivial challenge of finding the line-of-best-fit using linear regression method on a biased data points. We will compare a single-threaded approach, optimized using Intel DAAL, and TBB on the first code, each being analyzed by vTune to compare the performance and resource utilization.
Case-study
Single-thread
Code
#include <cmath>
#include <iostream>
#include <random>
#include <chrono>
#include <fstream>

int main(int argc, char* argv[]) {
    size_t N;
    double learn_rate;
    size_t epoches;
    double correct_b = 1.0;
    double correct_m = 0.5;
    std::ofstream ofs("points.csv");
    ofs << "x,y" << std::endl;
    if (argc != 4) {
        N = 1000;
        learn_rate = 1.0e-3;
        epoches = 5;
    } else {
        N = std::strtoul(argv[1], NULL, 10);
        learn_rate = std::strtod(argv[2], NULL);
        epoches = std::strtoul(argv[3], NULL,10);
        std::cout << "N = " << N << ", learn_rate = " << learn_rate << ", epoches = " << epoches << std::endl;
    }
    std::chrono::steady_clock::time_point tStart, tStop;
    tStart = std::chrono::steady_clock::now();
    double* m_real = new double[N];
    double* b_real = new double[N];
    double* x = new double[N];
    double* y = new double[N];
    // setting up random generators
    std::default_random_engine generator;
    std::normal_distribution<double> m_dist(correct_m,0.2);
    std::normal_distribution<double> b_dist(correct_b,0.2);
    std::normal_distribution<double> x_dist(0.0,1);

    // creating random dataset
    for(size_t i = 0; i < N; i++) {
        m_real[i] = m_dist(generator);
        b_real[i] = b_dist(generator);
        x[i] = x_dist(generator);
        y[i] = m_real[i] * x[i] + b_real[i];
        ofs<< x[i] << "," << y[i] << '\n';
    }
    ofs.close();
    ofs.open("prediction.csv");
    ofs << "m,b" << std::endl;
    // estimated b, m
    double b = 0;
    double m = 0;
    // gradient descent
    for(size_t i = 0; i < epoches * N; i++) {
        int idx = i % N;
        double p = b+m * x[idx];
        double err = p - y[idx];
        b = b - learn_rate * err;
        m = m - learn_rate * err * x[idx];
        ofs << m << "," << b << '\n';
    }
    tStop = std::chrono::steady_clock::now();
    auto ms = std::chrono::duration_cast<std::chrono::milliseconds>(tStop - tStart);
    std::cout << "Execution Time: " << ms.count() << " milliseconds" << std::endl;
    std::cout << "Predicted:\nb = " << b  << ", m = " << m << std::endl;
    std::cout << "Correct:\nb = " << correct_b  << ", m = " << correct_m << std::endl;
    std::cout << std::endl;
    delete[] m_real;
    delete[] b_real;
    delete[] x;
    delete[] y;
    return 0;
}
}
Performance
Optimized with DAAL
Code
Performance
Multi-thread
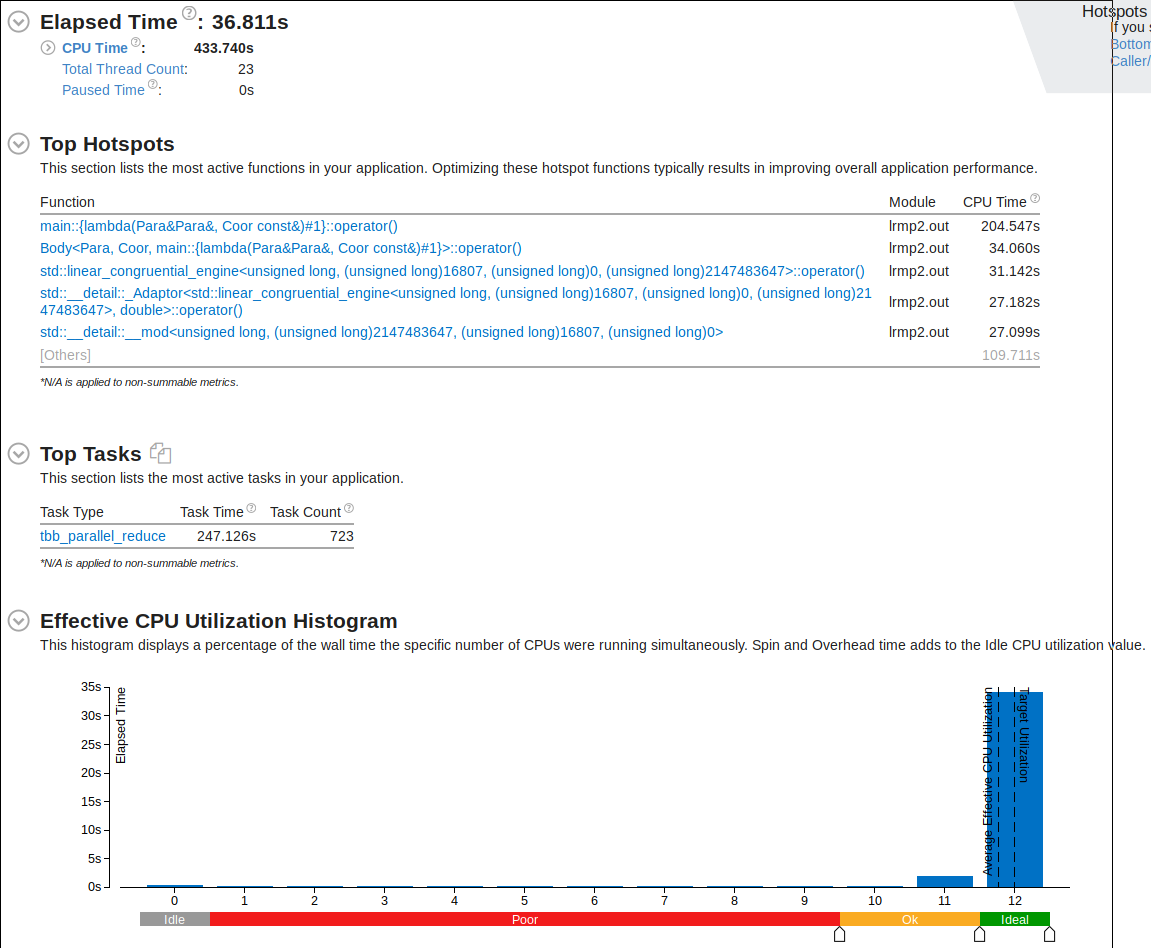
This code takes the single-threaded version above and applies TBB to leverage the power of threading to increase performance.
