GPU621/Group 6
Contents
Group Members
Intel Parallel Studio Inspector
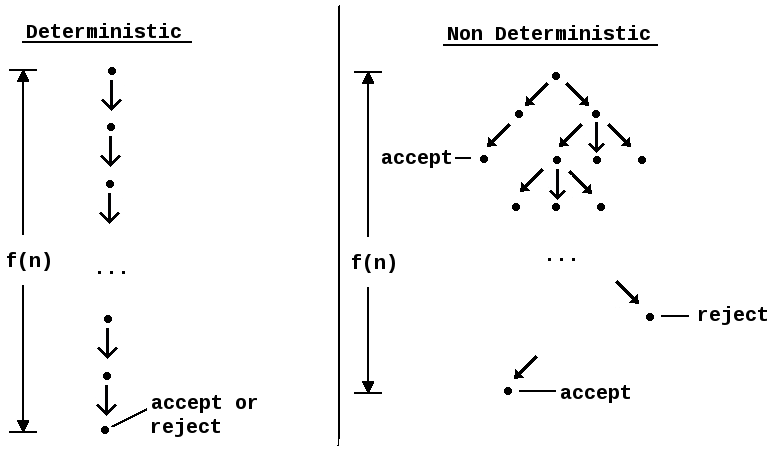
Intel Inspector (successor of Intel Thread Checker) is a memory and thread checking and debugging tool to increase the reliability, security, and accuracy of C/C++ and Fortran applications. It assists programmers by helping find both memory and threading errors that occur within programs. This can be very important, as memory errors can be incredibly difficult to locate without a tool, and threading errors are often non-deterministic, which means that even for the same input, they can show different behavior on different runs, making it much harder to determine what the issue is. Below is a list of errors that Intel Inspector can find. These are the more common errors, and for a longer list of problem types, you can find them on the Intel website here.
Intel Inspector can be used with the following
- OpenMP
- TBB (Thread Build Blocks)
- MPI (Message Passing Interface)
Testing Intel Inspector
You can find some online tutorials for Intel Inspector here.
Levels of Analysis
- The first level of analysis has little overhead. Use it during development because it is fast.
- The second level (shown below) takes more time and detects more issues. It is often used before checking in a new feature.
- The third level is great for regression testing and finding bugs.
Memory Errors
Memory errors refer to any error that involves the loss, misuse, or incorrect recall of data stored in memory.
Memory leaks
These are a resource leak that occurs when a computer program incorrectly manages to release memory when it is no longer needed. This may lead to extensive response times due to excessive paging, leading to slower applications.
nested memory leak
Memory corruption
Memory corruption is when a computer program violates memory safety, things like buffer overflow and dangling pointers.
Allocation and deallocation API mismatches
This problem occurs when the program attempts to deallocate data using a function that is not mean for the allocator used for the data. For example, a common mistake is when data is allocated using new[], a problem will occur if you just use the delete function, instead of delete[].
Inconsistent memory API usage
This problem occurs when memory is allocated to API that is not used within the program. An API is a set of subroutine definitions, communication protocols, and tools for building software, and when those tools are introduced into a program but not used, unneeded memory is used.
Illegal memory access
This is when a program attempts to access data that it does not have the right permissions to use.
Uninitialized memory read
This problem occurs when the program attempts to read from a variable that has not been initialized.
Mismatched allocation/deallocation
this is when attempting to delete memory already deleted or allocate already allocated memory
example code https://github.com/vlogozzo/cpp/blob/master/gpu621/memory%20leak%20walkthrough/memory%20leak%20walkthrough/Source.cpp
Threading Errors
Threading errors refer to problems that occur due to the specific use of threads within a program.
Race Conditions
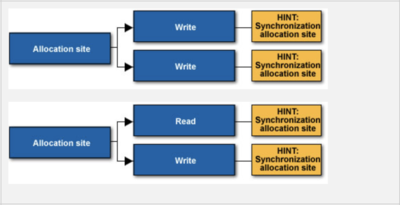
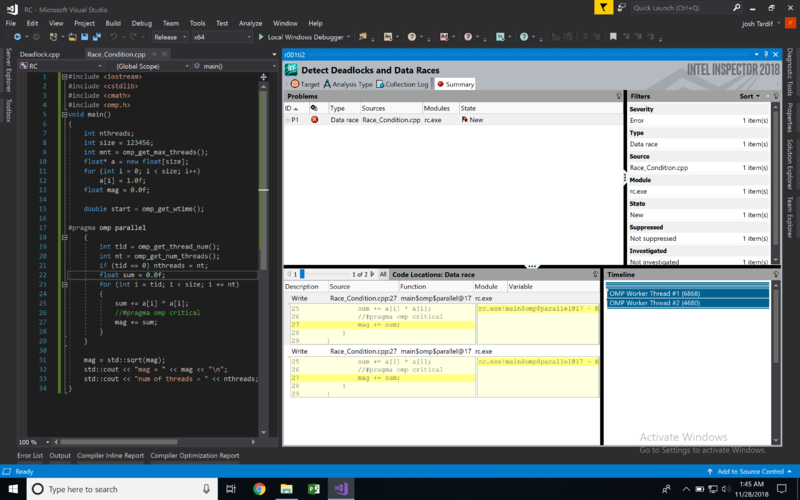
A race condition occurs when multiple threads access the same memory location without proper synchronization and at least one access is a write.
There are multiple types of race conditions such as
- Data Race: Occurs when multiple threads attempt to perform an operation on shared data
- Heap Race: Performs operations on a shared heap,
- Stack Race: Performs operations on a shared stack.
Solutions
Privatize memory shared by multiple threads so each thread has its own copy.
- For Microsoft Windows* threading, consider using TlsAlloc() and TlsFree() to allocate thread local storage.
- For OpenMP* threading, consider declaring the variable in a private, firstprivate, or lastprivate clause, or making it threadprivate.
Consider using thread stack memory. Synchronize access to the shared memory using synchronization objects.
- For Microsoft Windows* threading, consider using mutexes or critical sections.
- For OpenMP* threading, consider using atomic or critical sections or OpenMP* locks.
https://github.com/JTardif1/gpu_project/blob/master/Race_Condition.cpp
Deadlocks
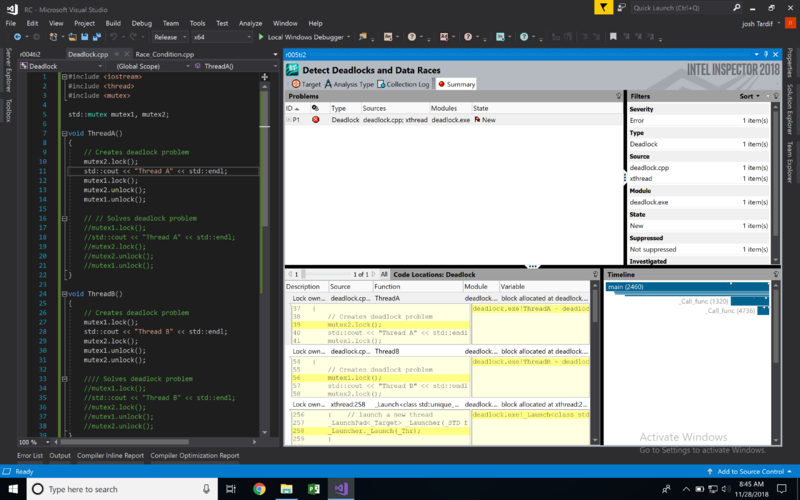
A deadlock is when a multiple processes attempt to access the same resource at the same time, and the waiting process is holding a resource that the first process needs to finish.

Solutions
- Create a global lock hierarchy
- Use recursive synchronization objects such as recursive mutexes if a thread must acquire the same object more than once.
- Avoid the case where two threads wait for each other to terminate. Instead, use a third thread to wait for both threads to terminate.
Intel Inspector cannot detect a Deadlock problem involving more than four threads.
https://github.com/JTardif1/gpu_project/blob/master/Deadlock.cpp


