DPS921 Team 1
Contents
What is VTune Amplifier?
Application that apply different analysis to your program
Helps programmer debugs and improve program
Provide GUI version
It has both a standalone and a IDE add-on
Where To Get Vtune ?
Price: $899
Window / Linux
Free Software Tools
- Students
- Educators
- Academic researchers
- Open source contributors
Download Vtune Here
Getting Started
When using VTune Amplifier the following page will shows
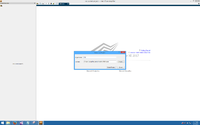
First you need create a project.A project will have can save more than one Analysis. Therefore, you can compare the different analysis and this helps you to compare the code you change.
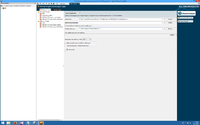
After the project is created. You need to it will automatically start a Analysis. You need to locate your program and setup the parameters as well. You need need to change the working directory if the default one is not correct.
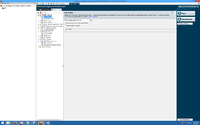
In this tab you can choose any Analysis type and run the analysis. In the following turtoral we did not use the VTune Amplifier program. We use the Visual Studio with the VTune Amplifier. This way it will set up the program location, parameters and working directory for you automatically.
VTune Tutorial 1: Finding HotSpot
This example program will be downloaded when you install VTune Amplifier. Following is the directory that contain the sample code from Intel.
[Program Files]\IntelSWTools\VTune Amplifier XE <version>\samples\en\C++\tachyon_vtune_amp_xe.zip
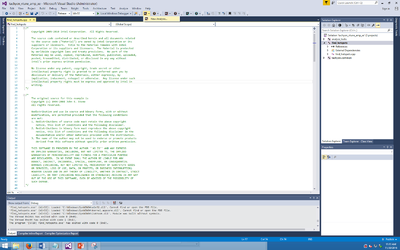
Open the project using Visual Studio. Then you can run the the VTune Amplifier and click new Analysis. (You need to download Vtune Amplifier to have that tab on Visual Studio)
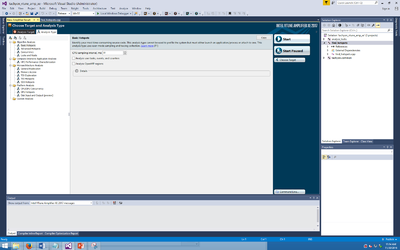
This should be the next page you will get. You begin to choose different type of Analysis here. We are going do a Basic Hotpots Analysis.Then click start to start the Analysis.
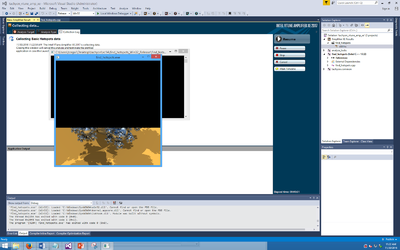
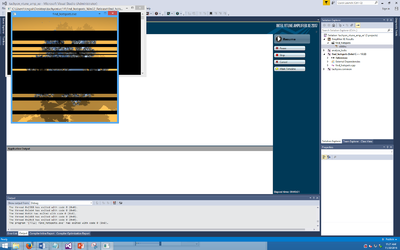
The program should run itself after you begin.You will notice that the image is loading from the bottom to the top. After the program finish running, it will take a while for Amplifer to generate report.
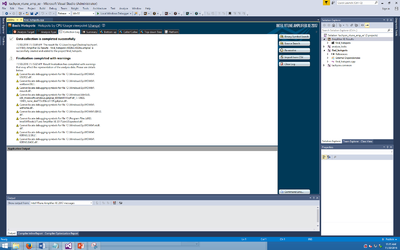
After the program finish running, it will take a while for Amplifer to generate report.
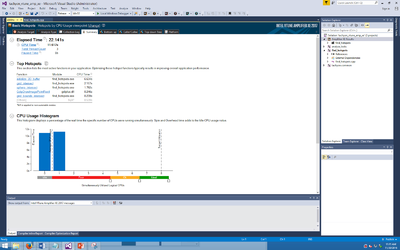
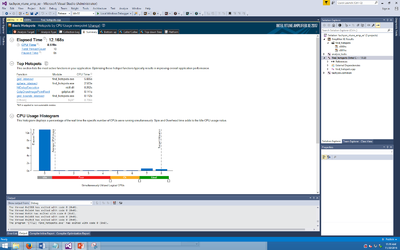
The first page will shows a summary of the program.The time it took, the top hotspots, CPU usage etc. We will focus looking at the Hotspots table. we notice that the "initialize_2D_buffer" use the most the CPU time. If you look at the code on find_hotspots.cpp you will notice it is actually one function in side that cpp file
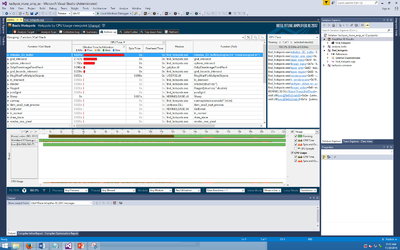
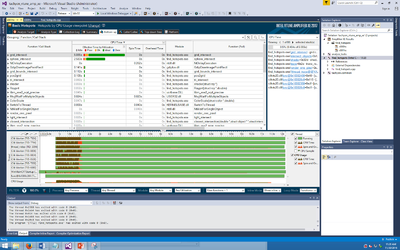
We go to the bootom up tab. it will give you a graph that shows the Hotspots table you got. You can clearly see that "initialize_2D_buffer" use the most time compare to the other function.
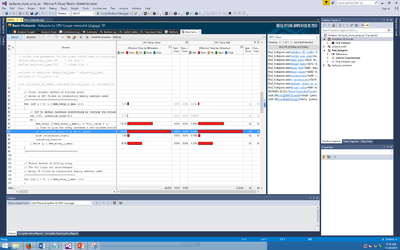
If we double click on this function we it will shows the sources code and shows you which line of the code actually use the most time in the specific function. Now we can tell that most of the time are spend on the while loop.
To compare a paralleled version of this code I already have a program that use CILK PLUS to parallelize that program. Below is the link to download that code. Simply replace the find_hotspots.cpp with this code, build it and run the Analysis again.
Link:File:Find hotspots.zip
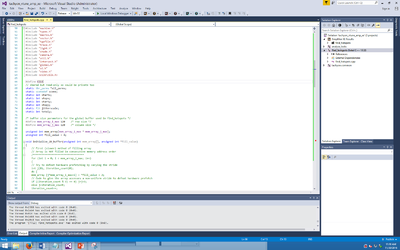
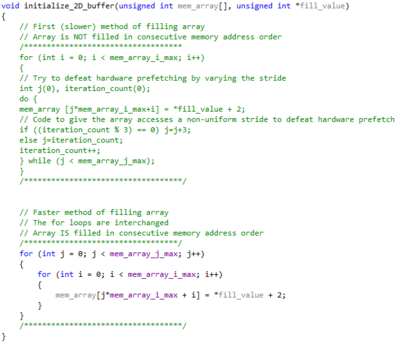
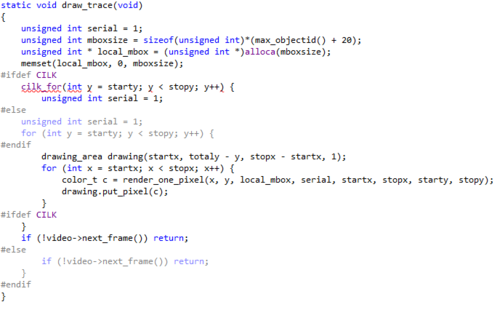
This is the code we change.
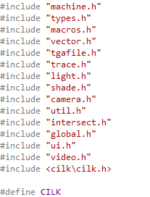
- First we change to header to allow Cilk Plus.
- Second we comment the bad slow method from "initialize_2D_buffer" and use the faster method.
- Third we add some Cilk Plus code to make it the program run in parallel.
When you run the Analysis this time you will see the program image load at the same time in different level instead of loading from the bottom to the top.
This time we should able to see that the Elased Time is shorter than the old time about 10second and the Top Hotspot is no longer "initialize_2D_buffer".
If we go to bottom up tab you can see that the "initialize_2D_buffer" is no longer exist and it shows the Cilk worker graph that shows the program is not run a parallel.
VTune Tutorial 2: Locks and Wait Tutorial
Reference: https://software.intel.com/en-us/node/471876
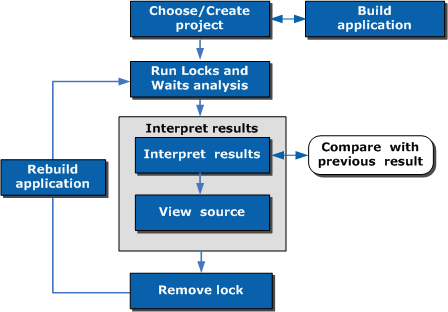
Work Flow of Analyzing locks and waits:
The sample application we are using for this tutorial is called "tachyon".
For application configuration options, setup instruction, and to get the file refer to this: https://software.intel.com/en-us/node/471878
Run the program for the first time to get the baseline run time to compare with consequent results.
The baseline run time for this sample is: 16.484s.
Run locks and waits analysis on the sample application.
Refer to this to learn how to run the analysis: https://software.intel.com/en-us/node/471882.
Interpret the data result from the analysis.
To interpret the data on the sample code performance, do the following:
Analyze the basic performance metrics provided by the Locks and Waits analysis.
Identify locks.
Analyze the basic performance metrics provided by the Locks and Waits analysis:
To identify the cause, you need to understand how this Wait time was distributed per synchronization objects.
The Top Waiting Objects section provides a list of sync objects and the wait time, and other metrics for each object.
The first few sync objects (that have the highest wait time) should be analyzed.
Thread Concurrency Histogram:
Most of the elapsed application time occurs for 1 thread running. This is poor concurrency of threads.
Most of the elapsed application time occurs for 1-2 CPU running simultaneously. This is poor concurrency.
Clicking on the "Bottom-Up" panel, will display more details about the sync objects.
Having found, the sync objects that is causing extreme wait time. We need to look at the code and see if we can change it.
In the "Bottom-Up" panel, click on sync objects and then click on the function that uses the sync object. This will open a window that shows the code.
Lastly, modify the code to fix the locks.
Re-build and re-run the application and compare results.
VTune Tutorial 3: Disk input Output Analysis
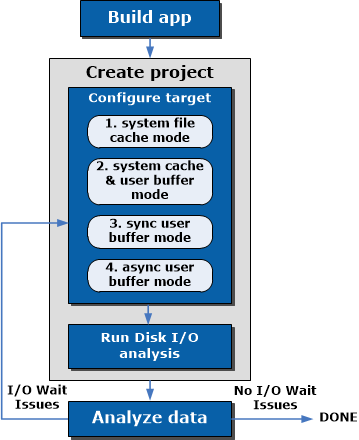
This is the workflow of I/O Analysis
Image Reference: https://software.intel.com/en-us/node/680296
What is Disk I/O analysis
Disk input / output analysis is a platform-wide analysis that monitors the utilization of the disk subsystem, CPU and processor buses.
It requires the program to be run as administrator.
What it is used for is to identify the imbalances between I/O operations and computational operations, as well as times the latency of the I/O requests.
As shown in the model there is multiple types of analysis.
Analyze I/O data in System Cache mode
Command Line Arguments: -f out.txt -m c
In this mode, the application asynchronously writes records (16 Byte) to the output file, relying on system file cache.
Analyze I/O data in System Cache and buffer mode
Command Line Arguments: -f out.txt -m b
Used to minimized the CPU usage and effectively use the I/O device. It combines the usage of system file cache and user buffer
Analyze I/O data in Synchronous user and buffer mode
Command Line Argument: -f out.txt -m s
Used in the user buffer to further optimize the operation, program is I/O bound
Analyze I/O data in Asynchronous user and buffer mode
Command Line Argument: -f out.txt -m a
Uses two user buffers and asynchronously submits data to the disk
Running the I/O Analysis
Resources
Getting Started with Intel® VTune™ Amplifier XE 2017 for Windows* OS
https://software.intel.com/en-us/node/564483
Examples with code vtune components and tutorials
https://software.intel.com/en-us/articles/intel-vtune-amplifier-tutorials
Vtune hotspot video by intel
https://www.youtube.com/watch?v=i3d7XYjxuaQ
Vtune with MPI program
https://software.intel.com/en-us/videos/getting-started-using-mpi-with-intel-vtune-amplifier-xe
