Difference between revisions of "Team1/Debugging your programs"
Ladanzahir (talk | contribs) (→12. Debugging Your Program) |
Ladanzahir (talk | contribs) |
||
| Line 11: | Line 11: | ||
[[Image:Debug4.jpg|600px ]]<br/><br/> | [[Image:Debug4.jpg|600px ]]<br/><br/> | ||
You can stop or resume debugging using stop or resume buttons in debug view. | You can stop or resume debugging using stop or resume buttons in debug view. | ||
| + | <br /> | ||
[[Image:Debug5.jpg|600px ]]<br/><br/> | [[Image:Debug5.jpg|600px ]]<br/><br/> | ||
<br/> | <br/> | ||
Revision as of 23:30, 30 January 2011
12. Debugging Your Program
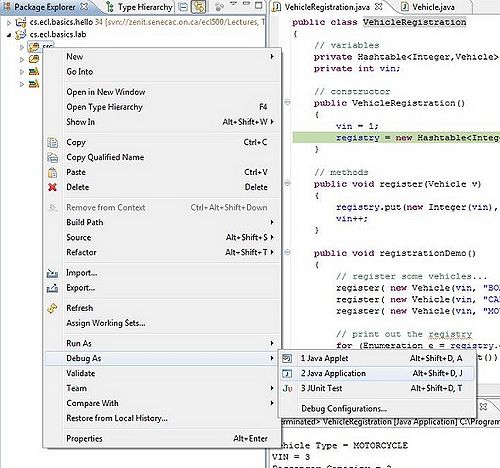
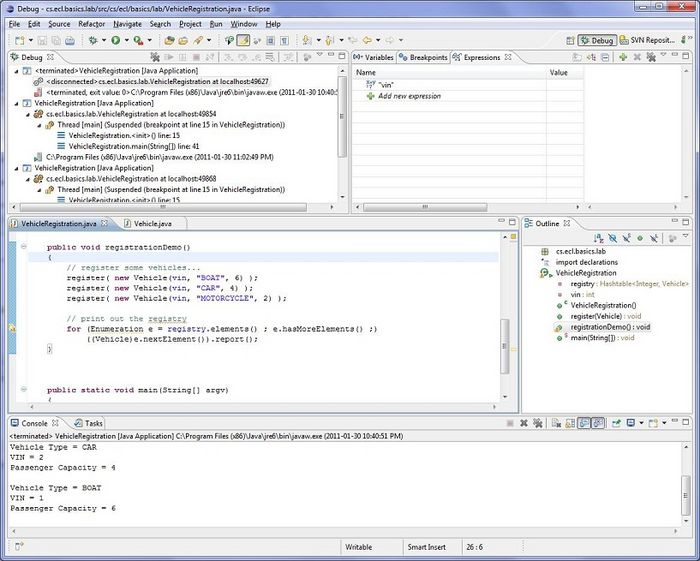
12.1. Debugging and Debugger Perspective: In order to debug your application, select the Source folder (src), right click and select "Debug As" and choose Java Application from the menu. You will receive a pop-up message indication shifting the perspective to Debug perspective which has all the view used in debugging for convenience.Answer "Yes" to the pop-up.


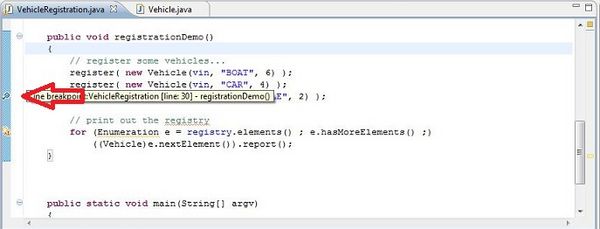
12.2. Setting Break Points: Double Click on the gray bay at the left side of the code to set a break point at any line.

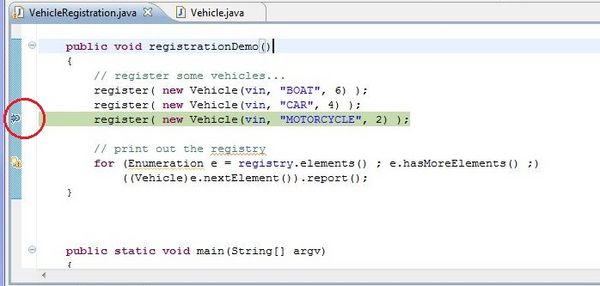
12.3. Stop and Start Debugging: Click on the debug button on the top bar to start debugging.De program will run in debug mode and stops at your break point.

You can stop or resume debugging using stop or resume buttons in debug view.

12.4. Step Over:
12.5. Step Into:
12.6. Other Useful Function keys:
12.7. Add Watch:
