Difference between revisions of "GPU621/Group 2"
(→Freezing/Thawing Threads) |
m |
||
| Line 163: | Line 163: | ||
Any rows that match the search query will be displayed, with the specific information matching the search criteria highlighted. | Any rows that match the search query will be displayed, with the specific information matching the search criteria highlighted. | ||
| + | = Live Demo Code = | ||
| + | |||
| + | This is the code that will be used for our live demo: | ||
| + | <syntaxhighlight> | ||
| + | // debugTest.c | ||
| + | #include <stdio.h> | ||
| + | #include <omp.h> | ||
| + | #define I 100000 | ||
| + | |||
| + | int main() { | ||
| + | unsigned int i, pSum = 0, sum = 0; | ||
| + | |||
| + | #pragma omp parallel private(pSum) shared(sum) | ||
| + | { | ||
| + | #pragma omp for | ||
| + | for (i = 0; i < I; i++) | ||
| + | pSum += 1; | ||
| + | |||
| + | #pragma omp critical | ||
| + | { | ||
| + | sum += pSum; | ||
| + | } | ||
| + | } | ||
| + | |||
| + | printf("%d", sum); | ||
| + | } | ||
| + | </syntaxhighlight> | ||
= Sources = | = Sources = | ||
https://learn.microsoft.com/en-ca/previous-versions/visualstudio/visual-studio-2015/debugger/debug-multithreaded-applications-in-visual-studio?view=vs-2015 | https://learn.microsoft.com/en-ca/previous-versions/visualstudio/visual-studio-2015/debugger/debug-multithreaded-applications-in-visual-studio?view=vs-2015 | ||
Latest revision as of 15:09, 31 March 2023
GPU621/DPS921 | Participants | Groups and Projects | Resources | Glossary
Contents
[hide]Group Members
Definitions
Processes
Every process is a separate instance of a particular program that is being run on a computer.
Threads
Threads are sets of instructions that get executed by the processes that contain them. The existence of multiple threads enables a process to separate work to be performed in parallel.
Debugging Single-threaded V.S. Multi-threaded Programs
Debugging usually occurs on a single threaded program by pausing the execution at a specific line of code. While the execution is paused, the values of all the variables can be inspected. This can be helpful to closely view what is occurring between each line of code.
Debugging a multithreaded program is different from debugging a single threaded program because each thread has its own sequence of execution, meaning that the point that the execution is paused at can vary for each thread.
OpenMP Debugging in Visual Studio
Debugging in Visual Studio will be demonstrated using this code:
#include <stdio.h>
#include <omp.h>

int main() {
	int numThreads = omp_get_max_threads();
	printf("Number of threads: %d\n", numThreads);
	#pragma omp parallel
	{
		int threadNum = omp_get_thread_num() + 1;
		printf("Hello thread #%d\n", threadNum);
	}
	printf("End of program");
}
Threads Window
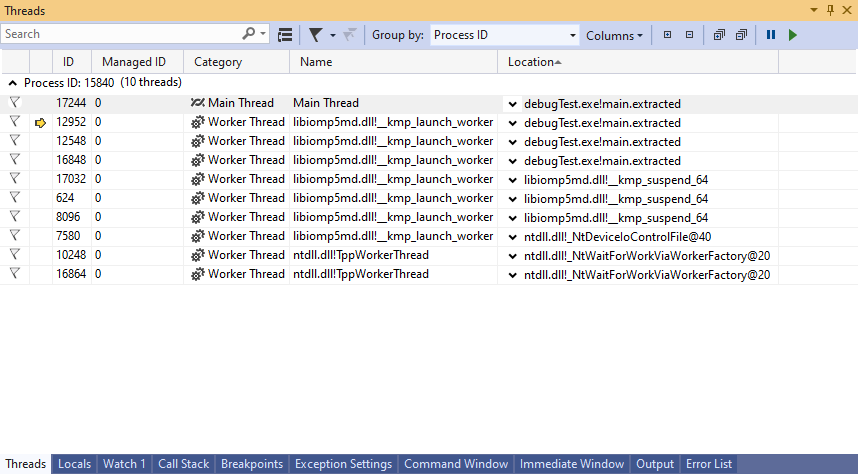
The threads window provides a detailed display of every thread running in your application. Here, you can observe the steps each thread takes and how each thread affects the data of your application, along with a number of other features like searching for specific threads, applying filters on what threads to display, freezing threads in place, etc.
The ID column indicates the thread’s unique identifier number. The category column indicates if the thread is the main thread or a worker thread, meaning a thread that is executing in parallel. Threads can be sorted by each of the columns in order to organize the threads in the desired order.
The yellow arrow on the row of a thread’s information indicates the current thread that execution is paused on.
Threads in the thread window searched for by each of their information fields, can be flagged in order to mark certain threads apart from others, and grouped by different fields of information.
While execution is paused, threads can be switched between or frozen to pause their individual execution until they are thawed.
Switching Threads
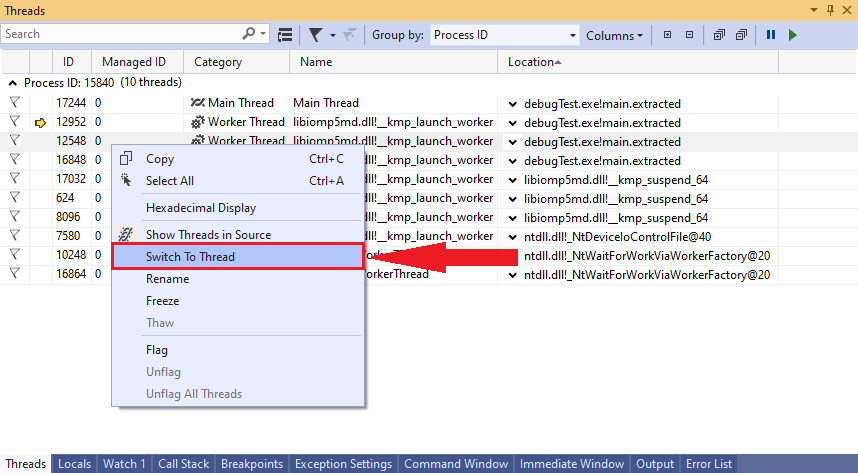
One of the features of the thread window is the ability to switch between which thread you want to be actively debugging. This can be useful in various cases, such as when you have a block of code meant for only 1 thread to run through, or if you want to make sure that different parallel threads are each performing as intended.
The steps to switch your currently active thread are as follows:
From your list of threads, right-click on the thread that you wish to switch to. On the menu that will appear, click on the option labeled "Switch to Thread".
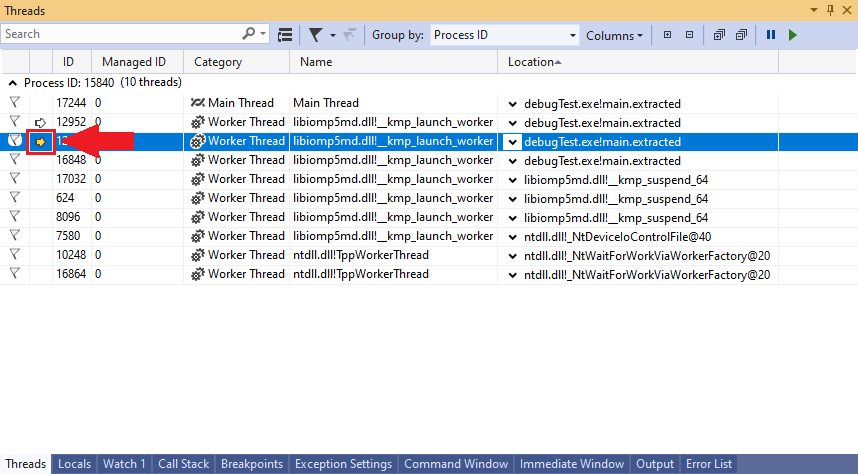
You will now see that the arrow that was previously pointing to the last active thread will now appear hollow, and a new arrow will be pointing to the currently active thread that you switched to.
Freezing/Thawing Threads
Freezing a thread pauses the execution of the code for that thread until the thread is thawed. Thawing allows the thread to resume normal execution after it has been frozen.
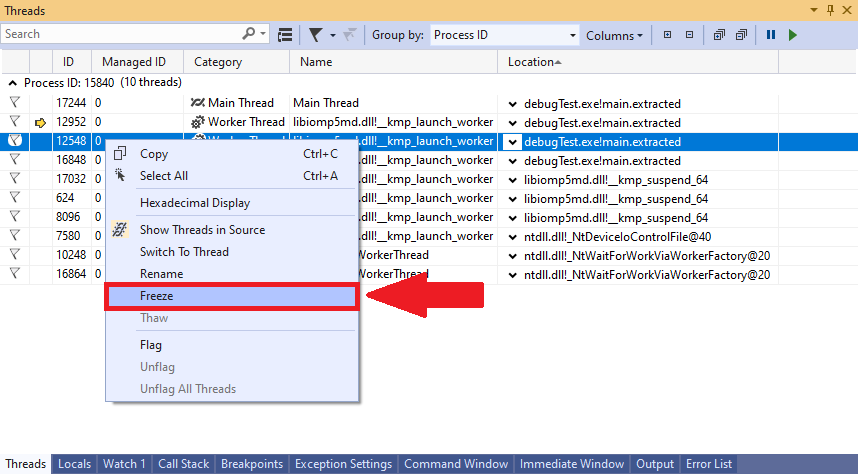
To freeze a thread, select and right-click the thread that you want frozen. In the menu that pops up, select the “Freeze” option.
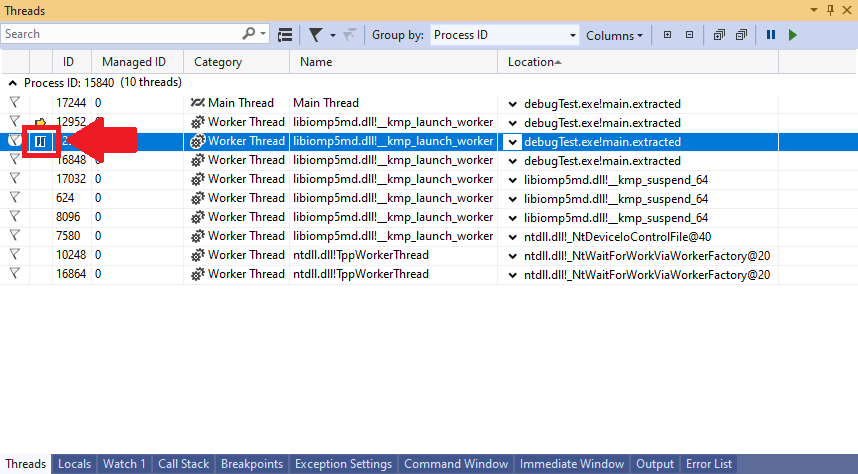
Once you’ve selected “Freeze”, a blue pause icon will be displayed in the second column of the row of the frozen thread in the thread window. This icon indicates that the thread is currently frozen.
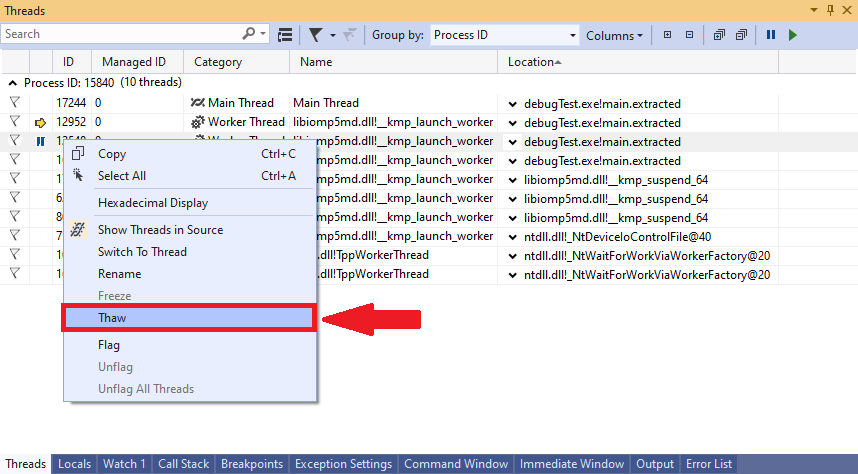
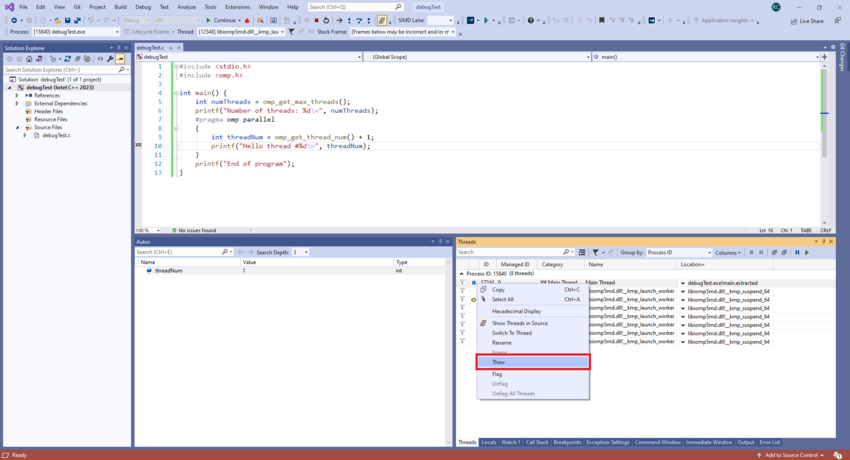
The process of thawing a thread is virtually identical. Select and right-click the frozen thread you wish to thaw, and in the menu that appears, select “Thaw” (note that the “Freeze” option is now grayed out, as the thread is already frozen).
Walkthrough
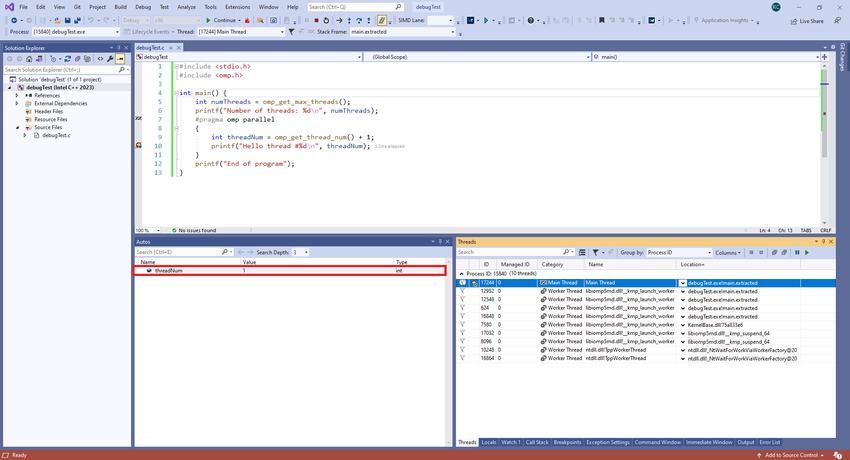
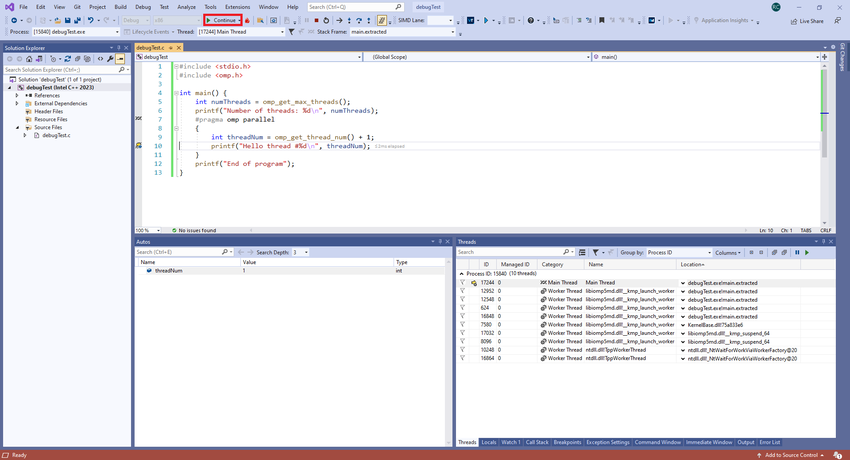
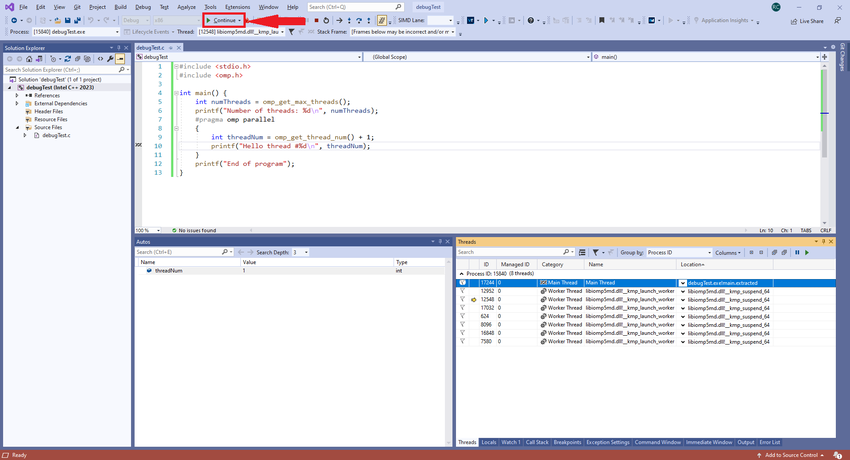
This is a short walkthrough that will display the effects of freezing/thawing threads during execution time of a program. The walkthrough will begin with the program already running, and paused at a breakpoint right before the program’s threads would act upon the code. The first thread of the program is currently frozen.
In the second column of the thread window, you can see a slight variation of the active thread arrow appears when the program runs over thread 1. The arrow now has a small pause icon over it, to indicate that the current thread is frozen and will not act. While execution is paused, you can also see the values of the local variables, which may be helpful for debugging your program.
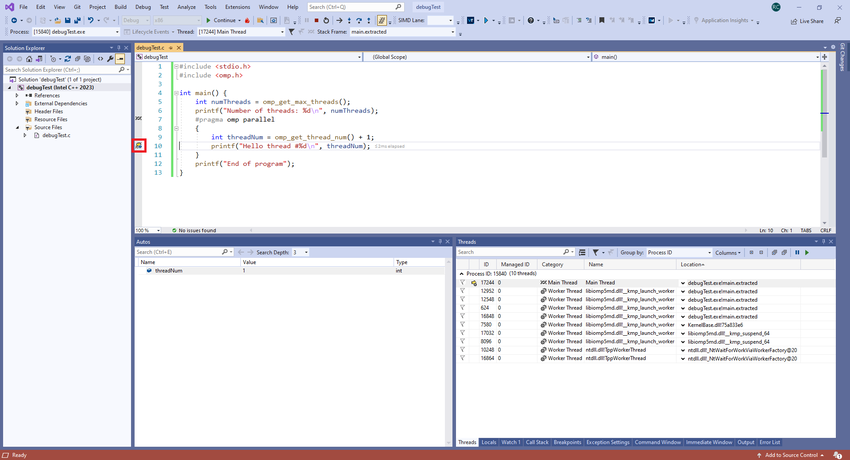
In the coding window, you can also see a unique variation of the code execution arrow that runs down the lines of code. This is also to indicate that the line of code currently being pointed to will not be acted on by the current thread.
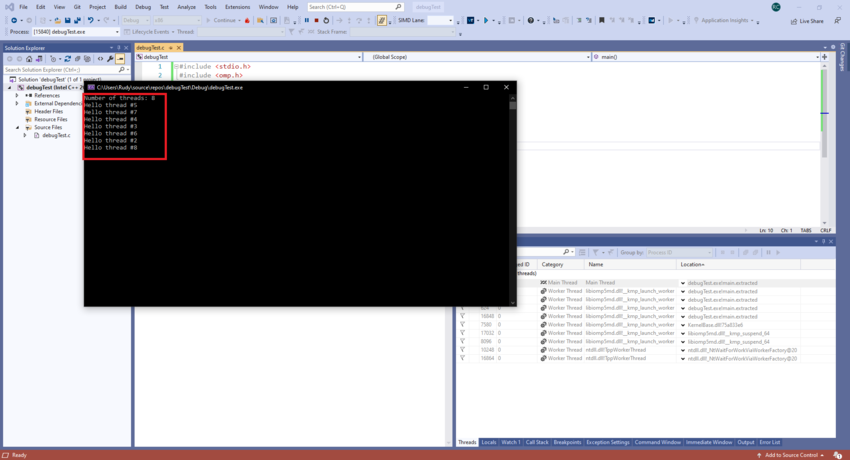
Now that we know that the thread is frozen and how Visual Studio informs you about it, we can click “Continue” at the top of the window to have the program run through all of the unfrozen threads. As OpenMP does not allow for a parallel code block to finish until each thread has reached the end, we will not need to worry about the program closing prematurely.
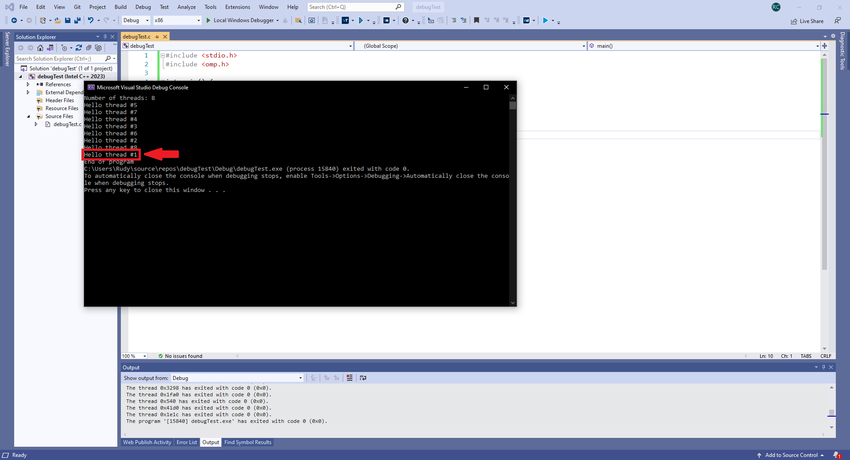
It can now be seen that all the other threads have completed execution, since their task of outputting their thread number has finished (as can be seen in the output window). However, the execution of the program has not yet been completed because it is still waiting for the frozen thread to complete the execution of its instructions, which it has as of yet not been able to do.
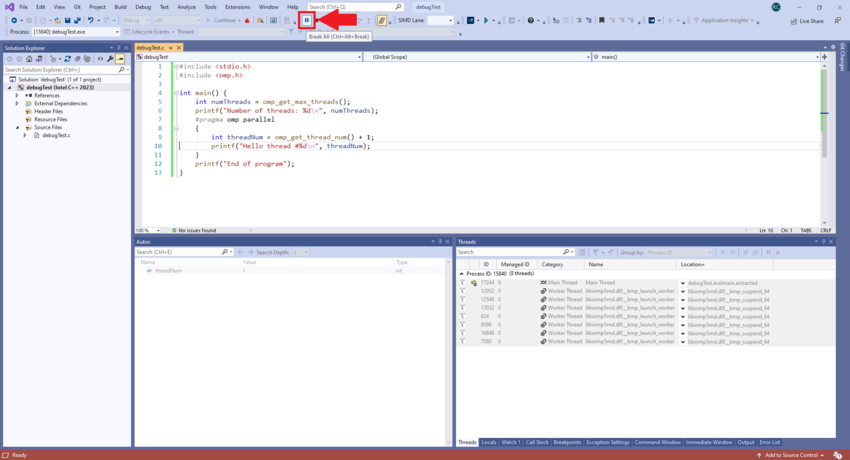
In order to allow the frozen thread’s execution to complete, the program’s execution must first be paused. Click on the pause icon at the top of the VS window (near the "Continue" option, which is currently grayed out as there are no lines of code it can move to).
Then, right click the frozen thread, and click the “Thaw” option to thaw the frozen thread.
After the thread has been thawed, click the "Continue" button to resume normal execution of the program.
From the output window, you can now see that the frozen thread, with the thread number of 1, is the one that has executed last, since it's execution was frozen until all the other threads' executions were completed.
Flagging Threads
Threads can be set as “flagged” in order to help distinguish them from other threads. This can help in situations where you want to keep track of specific threads that are not necessarily the active thread.
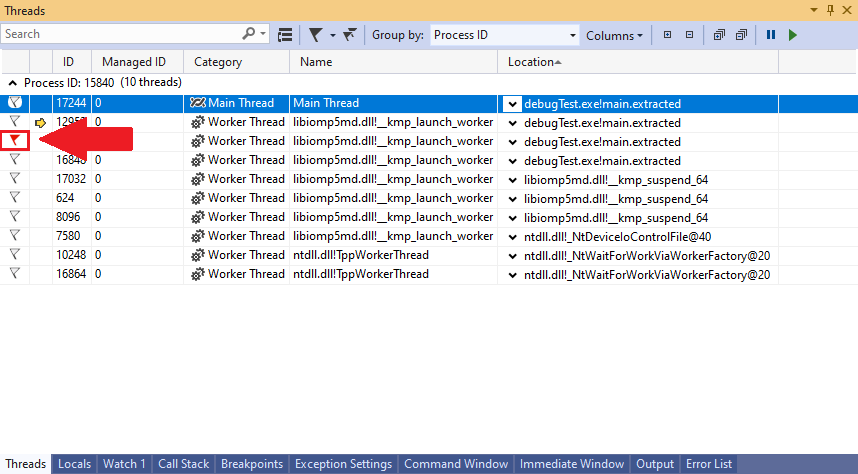
To flag a thread, click on the flag icon in the first column for the thread you wish to have flagged. The uncoloured flag should change to a red flag, indicating that the thread is now flagged.
To unflag a thread, click the flag icon again for the specified thread. The flag should change from a red flag back to an uncoloured flag.
Grouping Threads
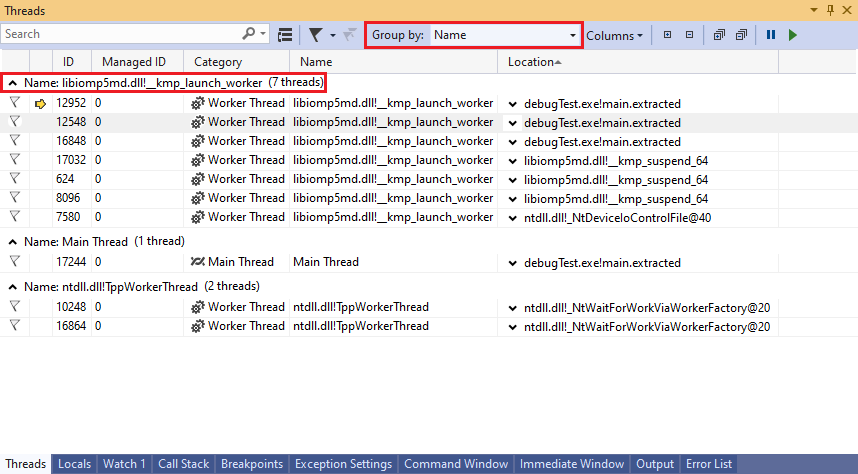
Threads can be grouped by different fields of information. Threads with the same field will be grouped together.
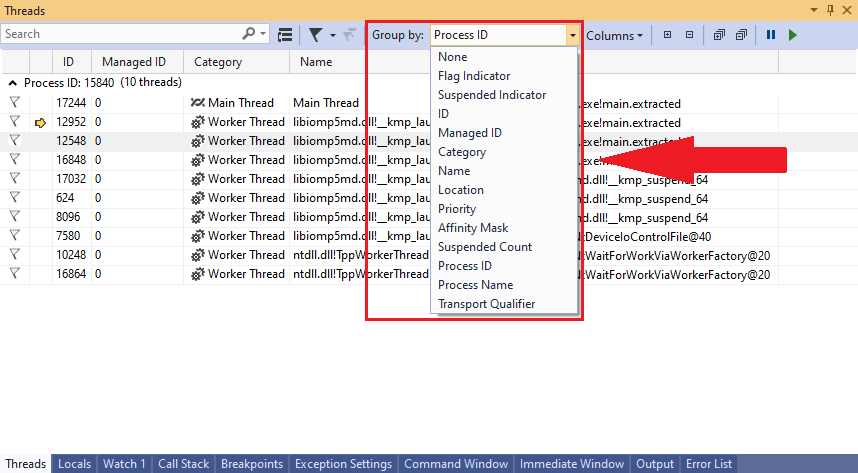
To begin grouping threads, click on the “Group by:” drop-down menu to expand it. It will display a list of all criteria that threads may be grouped by.
Once you have chosen a grouping method, your threads will be separated into different groups based on the criteria selected. In this example, they are grouped by name, so threads with the same name will be grouped together.
Searching Threads
In applications where you have too many threads to easily comb through, you can search for threads by the different fields of information that each thread’s row of information contains.
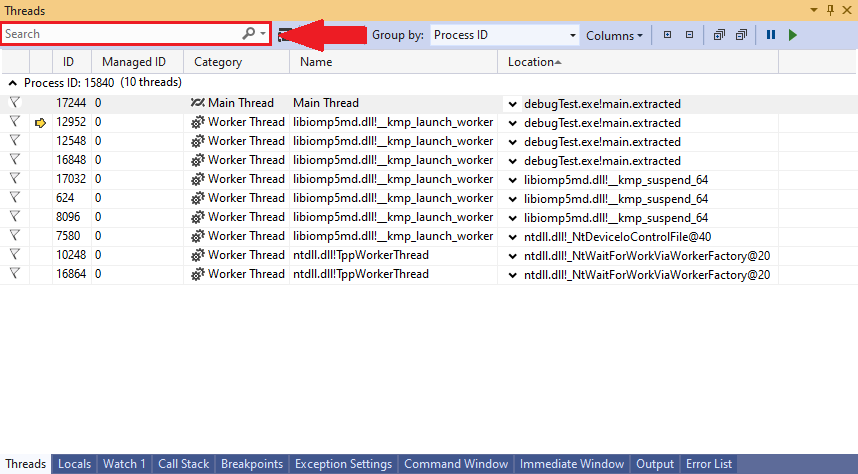
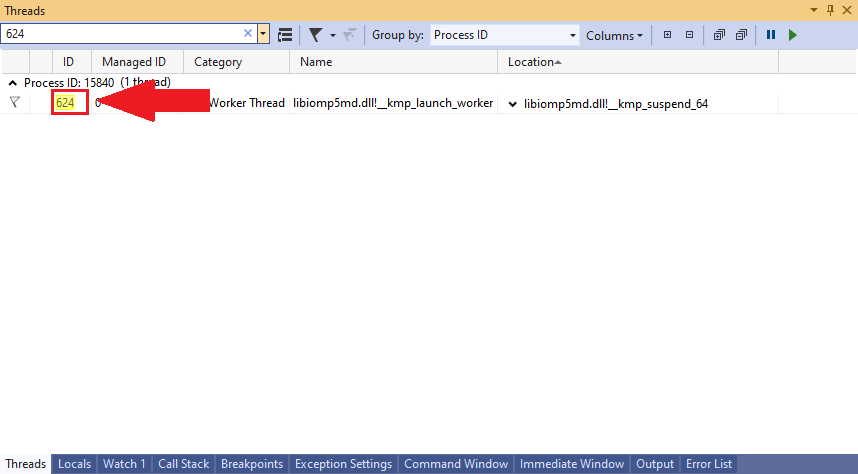
To search for specific threads, click on the search box and enter whatever information that may be contained by one of the rows of information about a thread.
Any rows that match the search query will be displayed, with the specific information matching the search criteria highlighted.
Live Demo Code
This is the code that will be used for our live demo:
// debugTest.c
#include <stdio.h>
#include <omp.h>
#define I 100000

int main() {
	unsigned int i, pSum = 0, sum = 0;

	#pragma omp parallel private(pSum) shared(sum)
	{
		#pragma omp for
		for (i = 0; i < I; i++)
			pSum += 1;

		#pragma omp critical
		{
			sum += pSum;
		}
	}

	printf("%d", sum);
}