Difference between revisions of "GPU621/Intel Parallel Studio Inspector."
| Line 15: | Line 15: | ||
Visit this site for more information on how to install Intel Inspector: https://www.intel.com/content/www/us/en/developer/tools/oneapi/inspector.html#gs.i68l9p | Visit this site for more information on how to install Intel Inspector: https://www.intel.com/content/www/us/en/developer/tools/oneapi/inspector.html#gs.i68l9p | ||
| + | |||
| + | = How to use Intel Inspector = | ||
| + | |||
| + | == Finding Memory Issues == | ||
| + | |||
| + | Proper memory management is a common issue within programs, and they can be especially difficult to track. Intel Inspector can locate different memory issues such as memory leaks, memory corruption, allocation / de-allocation API mismatches, inconsistent memory API usage, illegal memory access, and uninitialized memory reads. | ||
| + | |||
| + | Once Intel Inspector is installed and you have a program you wish to analyze, navigate to: | ||
| + | |||
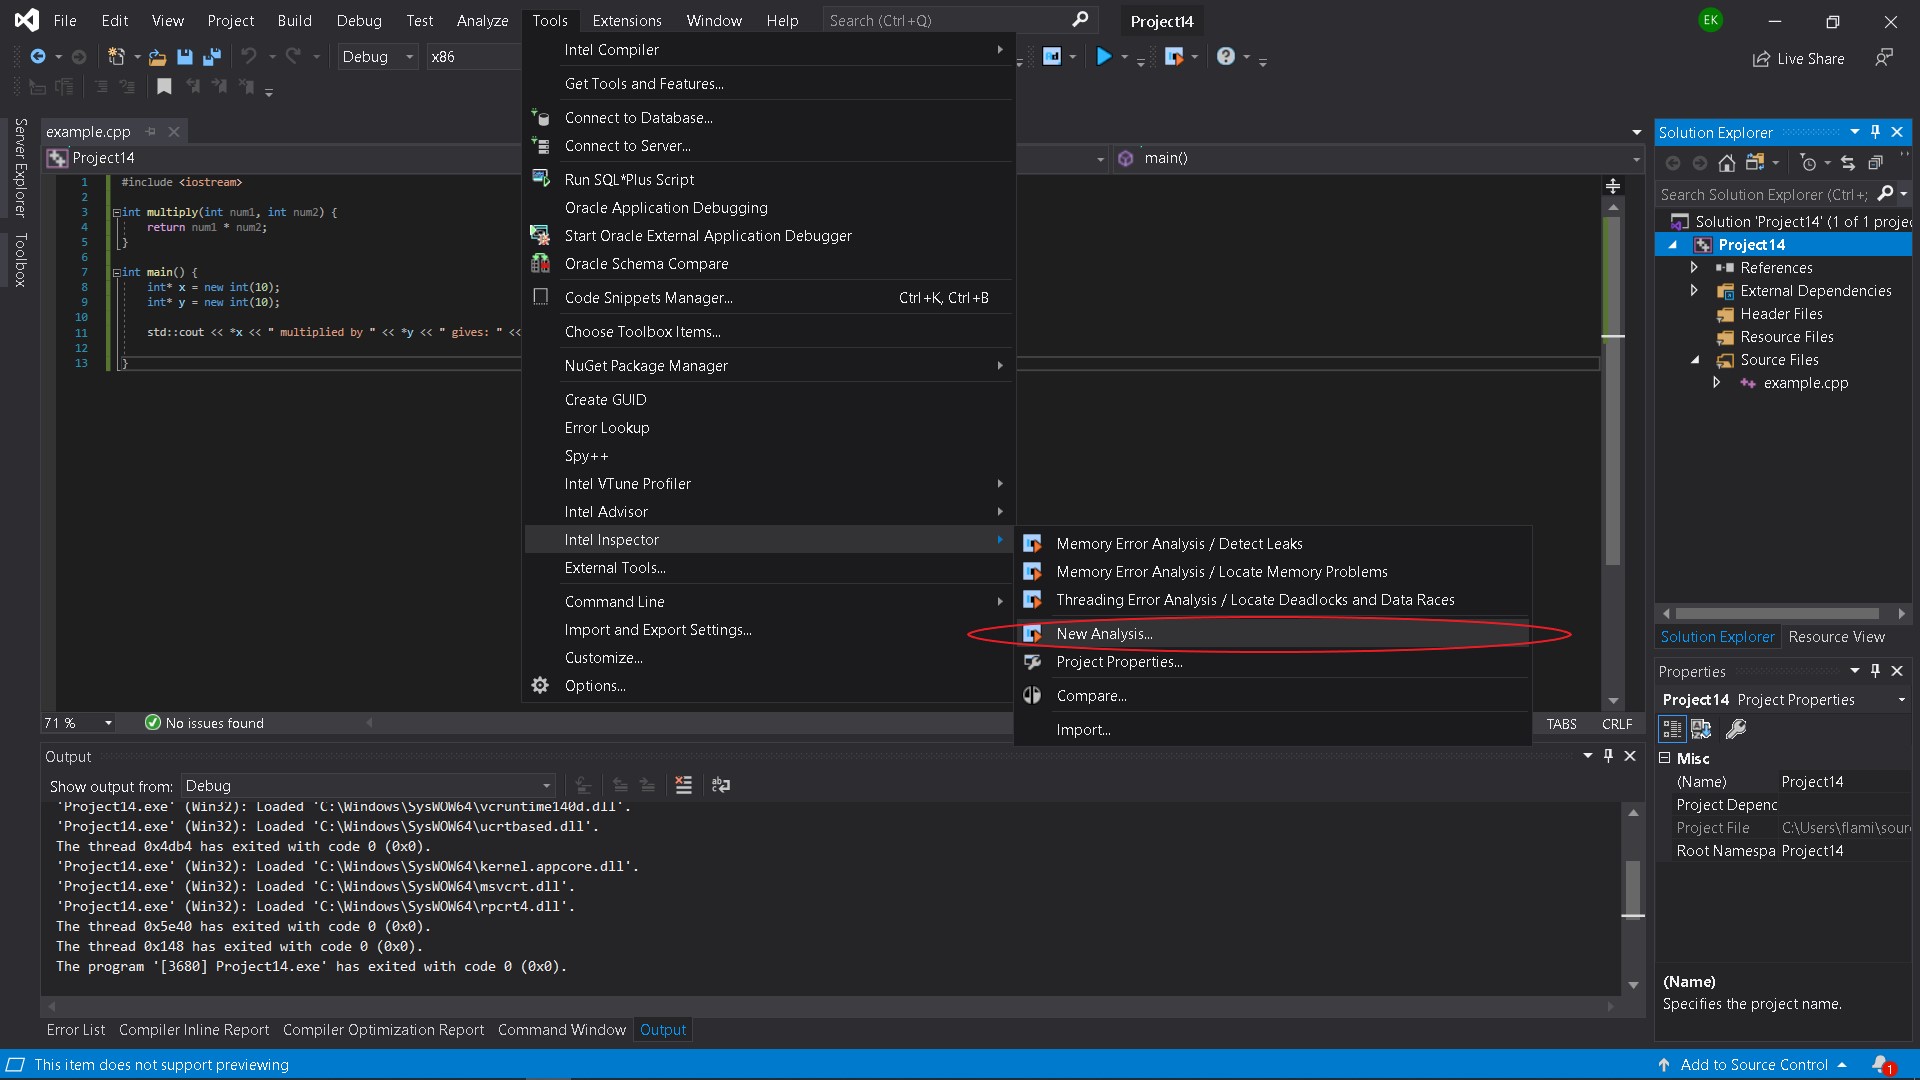
| + | Tools > Intel Inspector > New Analysis | ||
| + | |||
| + | [[File:New_Analysis.jpg]] | ||
Revision as of 21:52, 8 December 2021
Contents
Group Members
Project Overview
This project was created to provide detailed documentation on Intel Parallel Studio Inspector, how it works, and demonstrate key features that will help reduce write parallel
Intel Parallel Studio Inspector
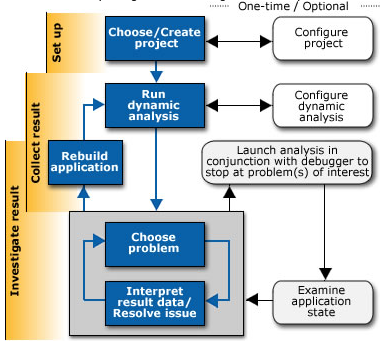
Intel Parallel Studio Inspector is a dynamic tool that helps users detect memory and threading errors in their serial and multithreaded applications. Intel Inspector is available on Windows and Linux operating systems and works with C, C++, C#, and Fortran programming languages. For this project, we will be using Visual Studio 2019 with Inspector.
Visit this site for more information on how to install Intel Inspector: https://www.intel.com/content/www/us/en/developer/tools/oneapi/inspector.html#gs.i68l9p
How to use Intel Inspector
Finding Memory Issues
Proper memory management is a common issue within programs, and they can be especially difficult to track. Intel Inspector can locate different memory issues such as memory leaks, memory corruption, allocation / de-allocation API mismatches, inconsistent memory API usage, illegal memory access, and uninitialized memory reads.
Once Intel Inspector is installed and you have a program you wish to analyze, navigate to:
Tools > Intel Inspector > New Analysis

