Difference between revisions of "DPS921/Intel Advisor"
(→How to set up a Survey Analysis) |
(→How to set up a Survey Analysis) |
||
| Line 127: | Line 127: | ||
== How to set up a Survey Analysis == | == How to set up a Survey Analysis == | ||
| − | [[File:Intel_advisor.png | + | [[File:Intel_advisor.png|1000px]] |
= Intel Roof-line Analysis = | = Intel Roof-line Analysis = | ||
Revision as of 14:26, 2 December 2020
Contents
[hide]Intel Advisor
Intel Advisor is a set of tools used to measure the performance of an application. They are Vectorization advisor, Roofline, Threading, Off loading, and flow Graph
Group Members
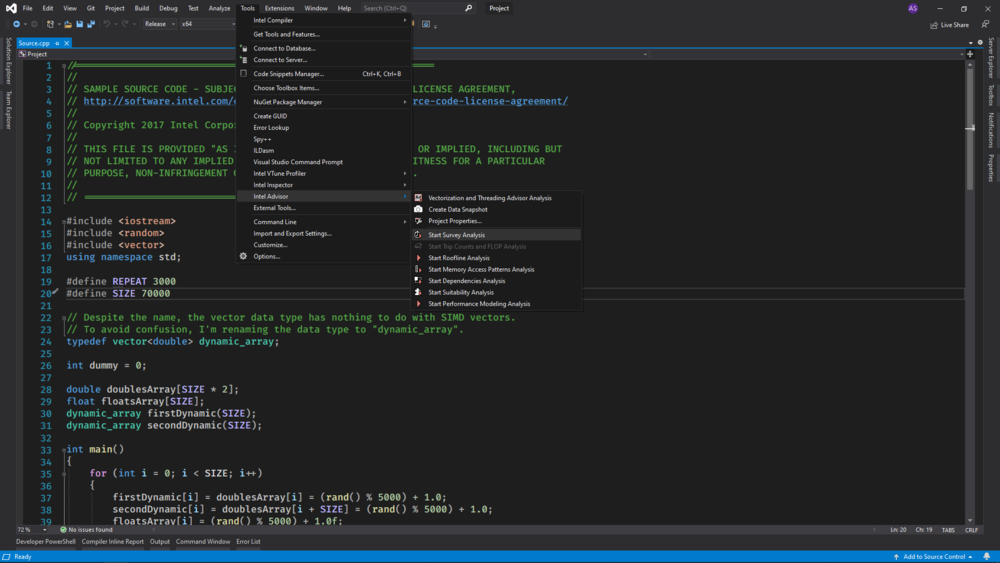
Intel Survey Analysis
A Survey analysis will create a Survey Report that outlines instances:
• Where vectorization or parallelization will be most effective
• Describe if vectorized loops are beneficial or not
• Un-vectorized loops and explain why they have been Un-vectorized
• Provide general performance issue
Code Example
//==============================================================
//
// SAMPLE SOURCE CODE - SUBJECT TO THE TERMS OF SAMPLE CODE LICENSE AGREEMENT,
// http://software.intel.com/en-us/articles/intel-sample-source-code-license-agreement/
//
// Copyright 2017 Intel Corporation
//
// THIS FILE IS PROVIDED "AS IS" WITH NO WARRANTIES, EXPRESS OR IMPLIED, INCLUDING BUT
// NOT LIMITED TO ANY IMPLIED WARRANTY OF MERCHANTABILITY, FITNESS FOR A PARTICULAR
// PURPOSE, NON-INFRINGEMENT OF INTELLECTUAL PROPERTY RIGHTS.
//
// =============================================================

#include <iostream>
#include <random>
#include <vector>
using namespace std;

#define REPEAT 3000
#define SIZE 70000

// Despite the name, the vector data type has nothing to do with SIMD vectors.
// To avoid confusion, I'm renaming the data type to "dynamic_array".
typedef vector<double> dynamic_array;

int dummy = 0;

double doublesArray[SIZE * 2];
float floatsArray[SIZE];
dynamic_array firstDynamic(SIZE);
dynamic_array secondDynamic(SIZE);

int main()
{
	for (int i = 0; i < SIZE; i++)
	{
		firstDynamic[i] = doublesArray[i] = (rand() % 5000) + 1.0;
		secondDynamic[i] = doublesArray[i + SIZE] = (rand() % 5000) + 1.0;
		floatsArray[i] = (rand() % 5000) + 1.0f;
	}
	/****************** Normal Unit Stride Loop ******************/
	cout << "Normal Unit Stride Loop: ";
	for (int r = 0; r < REPEAT; r++)
	{
		for (int i = 0; i < SIZE; i++)
		{
			doublesArray[i] = i * 42.0 + 7;
		}
	}
	cout << "DONE\n";
	/****************** Vector Length Demo Loop ******************/
	cout << "Vector Length Demo Loop: ";
	for (int r = 0; r < REPEAT; r++)
	{
		for (int i = 0; i < SIZE; i++)
		{
			floatsArray[i] = i * 42.0f + 7;
		}
	}
	cout << "DONE\n";
	/******************** Constant Stride Loop *******************/
	cout << "Constant Stride Loop:    ";
	for (int r = 0; r < REPEAT; r++)
	{
		dummy++; // Prevents interchange. Too fast to contribute to loop time.
		for (int i = 0; i < SIZE; i++)
		{
			doublesArray[i * 2] = i * 42.0 + 7;
		}
	}
	cout << "DONE\n";
	/******************** Variable Stride Loop *******************/
	cout << "Variable Stride Loop:    ";
	for (int r = 0; r < REPEAT; r++)
	{
		for (int i = 0; i < SIZE; i++)
		{
			doublesArray[i + (i / 2)] = i * 42.0 + 7;
		}
	}
	cout << "DONE\n";
	/******************** True Dependency Loop *******************/
	cout << "True Dependency Loop:    ";
	for (int r = 0; r < REPEAT; r++)
	{
		for (int i = 1; i < SIZE; i++)
		{
			doublesArray[i] = i * 42.0 + doublesArray[i - 1];
		}
	}
	cout << "DONE\n";
	/****************** Assumed Dependency Loop ******************/
	cout << "Assumed Dependency Loop: ";
	for (int r = 0; r < REPEAT; r++)
	{
		for (int i = 0; i < SIZE; i++)
		{
			firstDynamic[i] = i * 42.0 + secondDynamic[i];
		}
	}
	cout << "DONE\n";
	return EXIT_SUCCESS;
}
How to set up a Survey Analysis
Intel Roof-line Analysis
The roofline tool creates a tool line model, to represent an application's performance in relation to hardware limitations, including memory bandwidth and computational peaks. To measure performance we use 2 axes with GFLOPs (Giga Flops/sec) on the y-axis, and AI(Arithmetic Intensity(FLOPs/Byte)) on the x-axis both in log scale, with this we can begin to build our roof-line. Now for any given machine, its CPU can only perform so many FLOPs so we can plot the CPU cap on our chart to represent this. Like the CPU a memory system can only supply so many gigabytes, we can represent this by a diagonal line(N GB/s * X FLOPs/Byte = Y GFLOPs/s). (pic) This chart represents the machine's hardware limitation, and it's best performance at a given AI
Every function, or loop, will have specific AI, when ran we can record its GFLOPs Because we know Its AI won't change and any optimization we do will only change the performance, this is useful when we want to measure the performance of a given change or optimization.
Intel Memory Access Pattern Analysis
We can use the MAP analysis tool to check for various memory issues, such as non-contiguous memory accesses and unit strides.
Intel Dependencies Analysis
The compiler will be unable to vectorize loops if there are potential data dependencies. The dependencies analysis will create a dependencies report that shows where possible data dependencies exist. The report will also have details about the type of dependency and how to solve the dependency.
Sources
https://www.youtube.com/watch?v=h2QEM1HpFgg - Roofline Analysis in Intel Advisor tutorial
https://software.intel.com/content/www/us/en/develop/articles/intel-advisor-roofline.html - Intel Advisor tutorial:roofline
