Difference between revisions of "DPS921/Intel Parallel Studio Inspector"
(→Progress) |
|||
| Line 561: | Line 561: | ||
Update 3: Sunday November 29th 2020 - Adding all the information for the report | Update 3: Sunday November 29th 2020 - Adding all the information for the report | ||
| + | |||
| + | Update 4: Monday November 30th 2020 - Made final edits to the Wiki | ||
Latest revision as of 18:44, 30 November 2020
Contents
Group Members
Project Description
The scope of the project is to do determine how useful Intel Inspector is and how to use the debugging feature. The topics we are going to cover today is; what is Intel Parallel Studio Inspector, what are the pros and cons, and how to use Intel Parallel Studio Inspector. The goal of this is to educate ourselves and our classmate the importance of Intel Parallel Studio Inspector and how to use it.
What is Intel Parallel Studio Inspector
Intel Inspector is an easy-to-use memory and threading error debugger for C, C++, and Fortran applications that run on windows and Linux. It helps find and fix problems- such as memory leaks and deadlocks-before they hinder productivity and time-to-market. Inspector is a correctness checking program that helps you find and fix problem like memory leaks and deadlocks. There are two distinct side of the inspector coin design to target specific type of problem: threading error and memory error. Inspector is a correctness checking program that helps you find and fix problem like memory leaks and deadlocks. There are two distinct side of the inspector coin design to target specific type of problem: threading error and memory error.
Reliability: find deadlocks and memory errors that cause lockups & crashes
Security: Find memory and threading vulnerabilities used by hackers
Accuracy: Identify memory corruption and race conditions to eliminate erroneous results
Different Deadlock Analysis Level
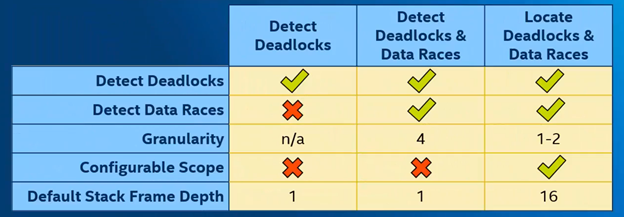
The threading and memory focus each level of analysis. Which progressive gets more details in cost of higher overhead. Each level are level 1: detects deadlock, level 2: detect deadlocks & data races, and level 3: locate deadlocks & data races.
Detect Deadlocks: when two or more threads are permanently stuck because no thread will give up its current lock until it can take the next one. But that lock is being held by another thread in the same position.
Detect deadlocks & data races: will do exactly what I explained earlier plus detect data races. Data races is when the outcome of an operation can change depending on what order the thread reached in.
Locate deadlocks & data races: is more detail with a smaller granularity deeper default stack frame depth and configurable scope.
Different Memory Leak Analysis Level
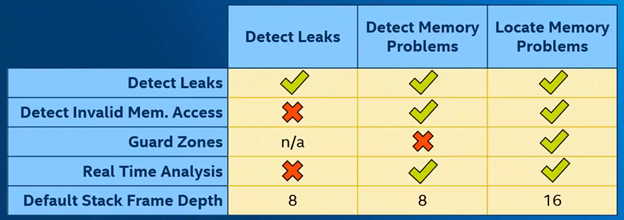
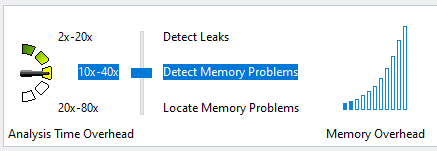
The three levels for memory error analysis are detect leaks, detect memory problems and locate memory problems.
Detect Leaks: just tracks whether the memory allocating gets deallocated.
Detect Memory Problems: Expands on detect leaks by also detecting bad interaction of memory such as invalid memory access, as well as enabling real time analysis.
Locate Memory Problems: Is similar to detect memory problems but more detailed. With a deeper default stack frame depth and guard zones which shows offsets of memory accesses of allocated blocks.
In the inspector the button “Reset Leak Tracking”, stops tracking all currently allocated memory for leaks, discarding associated tracking data without reporting it. The button “Find Leaks” creates a report on the leak status of all currently allocated memory, then stops tracking those blocks. The button “Reset Growth Tracking” discards all currently-tracked memory growth data. Memory currently allocated won’t count towards growth. The button “Measure Growth” creates a report on how much memory usage has grown since the last reset. Does not reset tracking information.
Pros vs Cons
Pros
- The pro of using intel inspector is to fix problems such as memory leaks and deadlocks
- Intel inspector is a dynamic memory and threading error checking instrument to inspect serial and multi-threaded programs
- It is specialized in memory and threading error
- It is much more targeted than other debugging tools
- It integrates with Visual Studio and has his own application
- It has a view windows of the error code on the display
- It can analyze an executable file
Cons
- Hard to navigate
- Outdated UI
- Hard and confusing to configurating projects
- It doesn’t support Microsoft OpenMP
- It can provide false positive and false negative
- Inaccurate Results
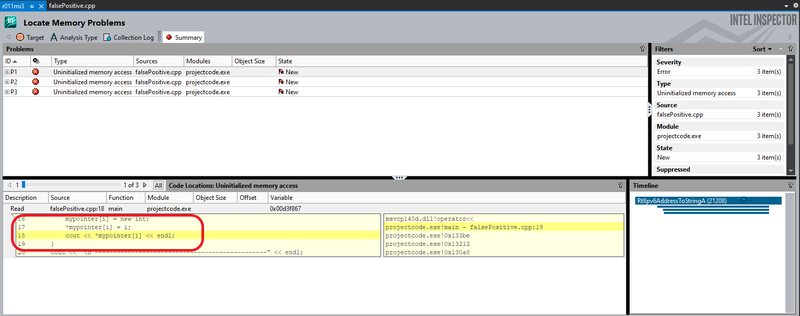
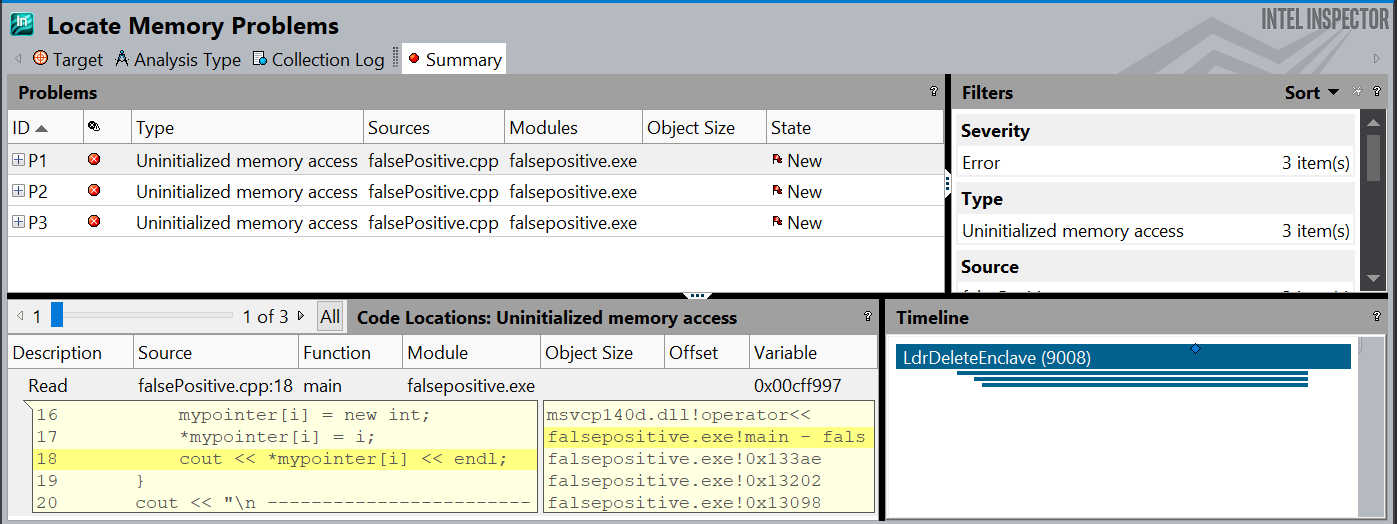
Intel Parallel Inspector detects uninitialized memory access on a 2D array that has been allocated properly and initialized.
In the below Image, Intel Parallel Inspector can be seen detecting the same uninitialized memory access error on line 18 when the memory location is properly initialized on line 17.
How to use Intel Parallel Studio Inspector
There are two ways to use the Intel Parallel Studio Inspector
Run Inspector directly from Visual Studio
This is the easiest and fastest way that requires no additional configuration.
Once you downloaded intel Inspector application, you need to restart your Visual Studio for the feature to work.
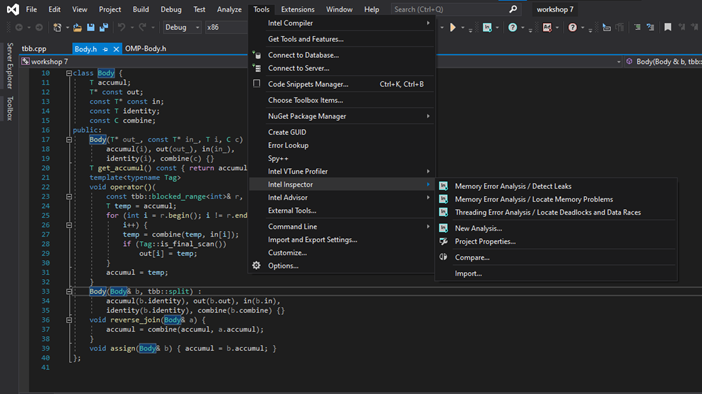
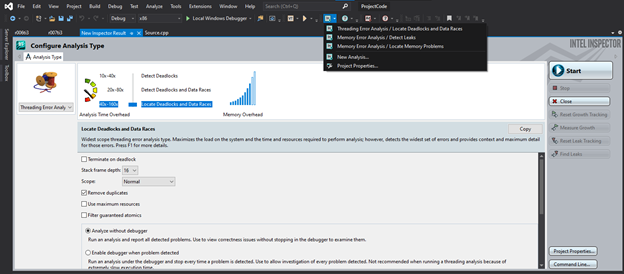
Inside Visual Studio, there are two ways of accessing the inspector debugger.
The first way is to go to the tools drop down menu and locate “Intel Inspector”, then you should be able to click on what you want to debug.
Second way is to locate the inspector icon, few directions right on tools. There will be a drop down menu that should lets you choice what choice of debugging you want to do or start a new analysis.
Run the application via Inspector
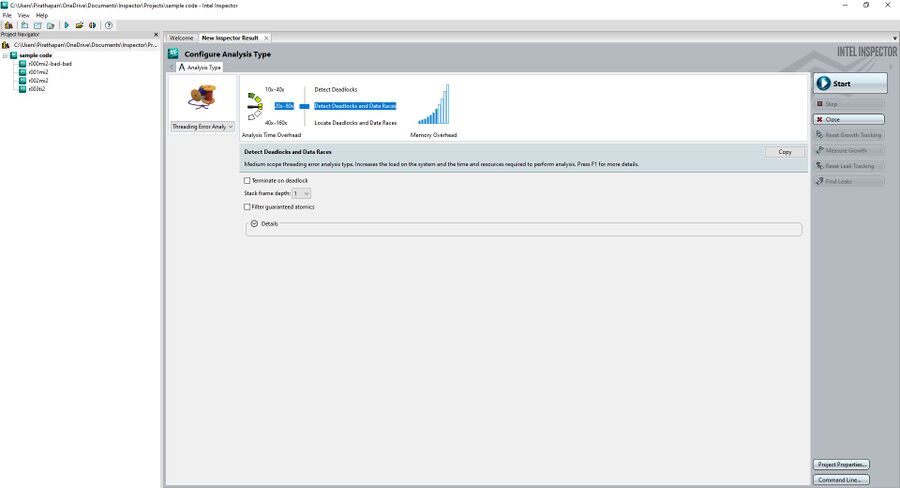
Before we start, I want to be able to show you how the Inspector UI looks like as a whole.
Working with intel inspector application requires passing it a compiled version of your program. Additionally, you may need to link some libraries (lib, dll, and etc.)
Configure a Project
Intel suggests using small data set sizes and load threads with small chunks of work.
This will reduce the run time and the speed of the analysis.
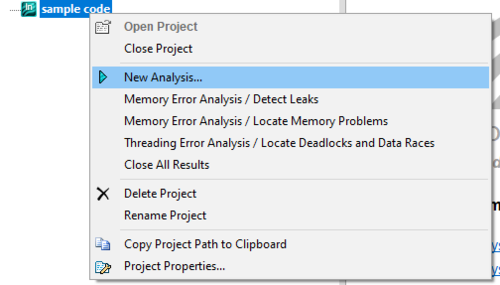
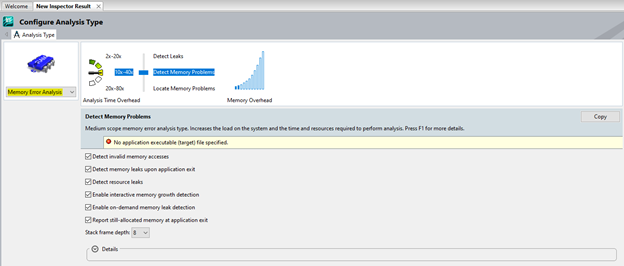
On the left side, right click on the project so that you get a drop-down menu and click “new analysis” to configure a project the way you want it.
Choose Analysis Type
Inspector allows you to choose between predefined types of analysis.
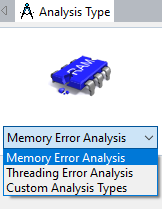
Choose the type of analysis using a drop down menu
Memory Error Analysis:
• Detect Leaks
• Detect Memory Problems
• Locate Memory Problems
Threading Error Analysis:
• Detect Deadlocks
• Detect Deadlocks and Data Races
• Locate Deadlocks and Data Races
Custom Analysis types: users can create their own types based on selected preset type.
In this screenshot, it show cases the different levels for memory error analysis.
Types at the top have smaller scope but faster in execution.
Types at the bottom have larger scope but they are considerably slower.
How it works
Inspector performs the analysis in multiple steps:
1. The program is executed
2. It identifies problems that may need to be resolved
3. Gathers problems
4. Converts symbol information into filenames and line numbers
5. Applies suppresion rules
6. Remove duplicates
7. Create problem sets
8. Opens a debugging session
Making it work
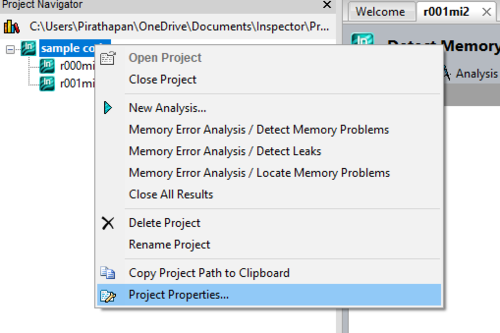
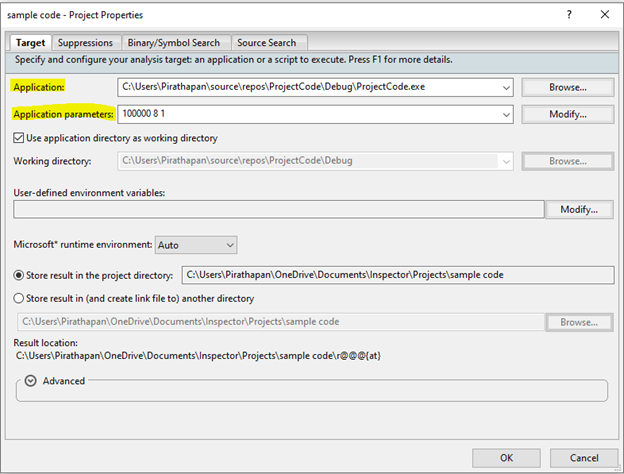
First you need an executable file. You get that building your solution on Visual Studio. Once you have your executable file, you import that to Intel Inspector by using “Project Properties” when you right click on the project located on the left side.
Once you are in the Project Properties section, you need to locate the executable file.
Application section is the executable file. Application section is the command argument, if the application has a command argument.
Interpreting Results
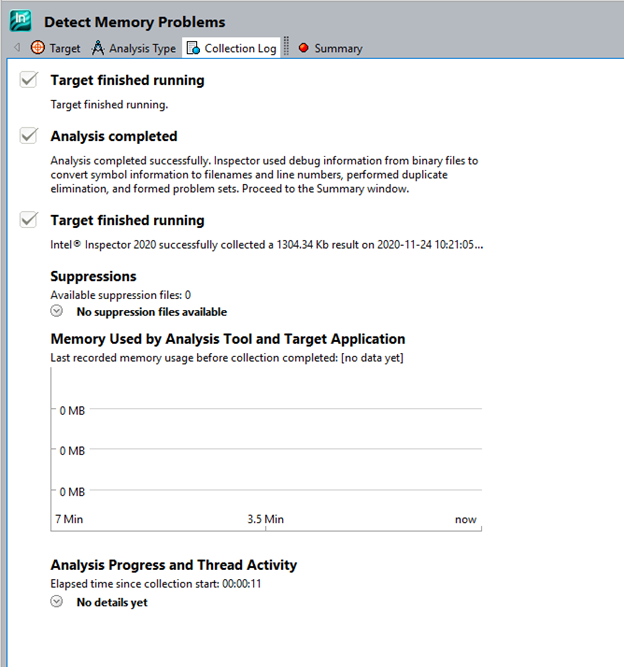
After the analysis completes, IPS XE Inspector will show you information on 2 pages:
Collection Log
Gives a general information about the execution of the program. From there you can see execution time, number of threads, the caller of threads, if they were active or not.
Summary
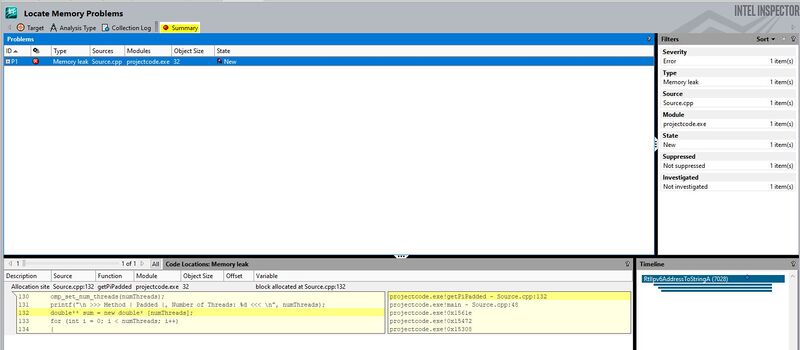
The summary window is divided into 4 parts:
1. Problems section
It shows problems (if any found) that we asked the inspector to look for. It provides you with a name of the problem, the file where the problem is located, the executable module which contains it, and the state of problem (which changes when do you a rescan).
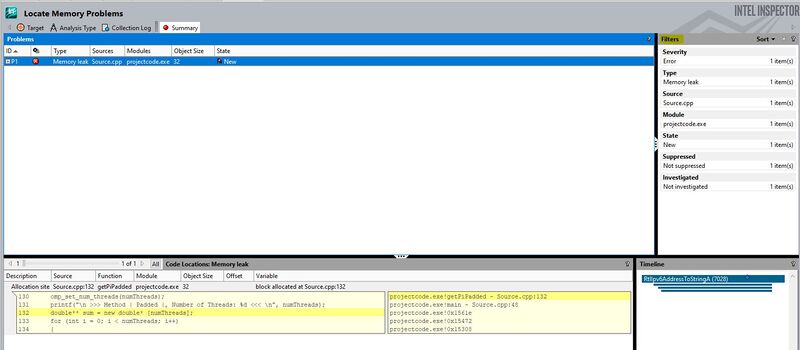
2. Filters (On the right side of the problems section)
Gives the summary of all problems (Sources file affect, total of problems by types, etc)
3. Code Locations
When we select a problem, code locations will show a preview of a source file and highlights and line on which the problems was detected.
Moreover, it shows the operation that is performed (Read, Write), including thread operations. Source files can be opened and edited directly from the Inspector by double clicking the problem
4. Timeline
Shows threads that involved at the certain step. There is a thread and timeline information for all code locations in one or all occurrences of the problem(s) highlighted in the Problems pane
Code for Intel Inspector
Pointer Miss Management {Memory Leak}
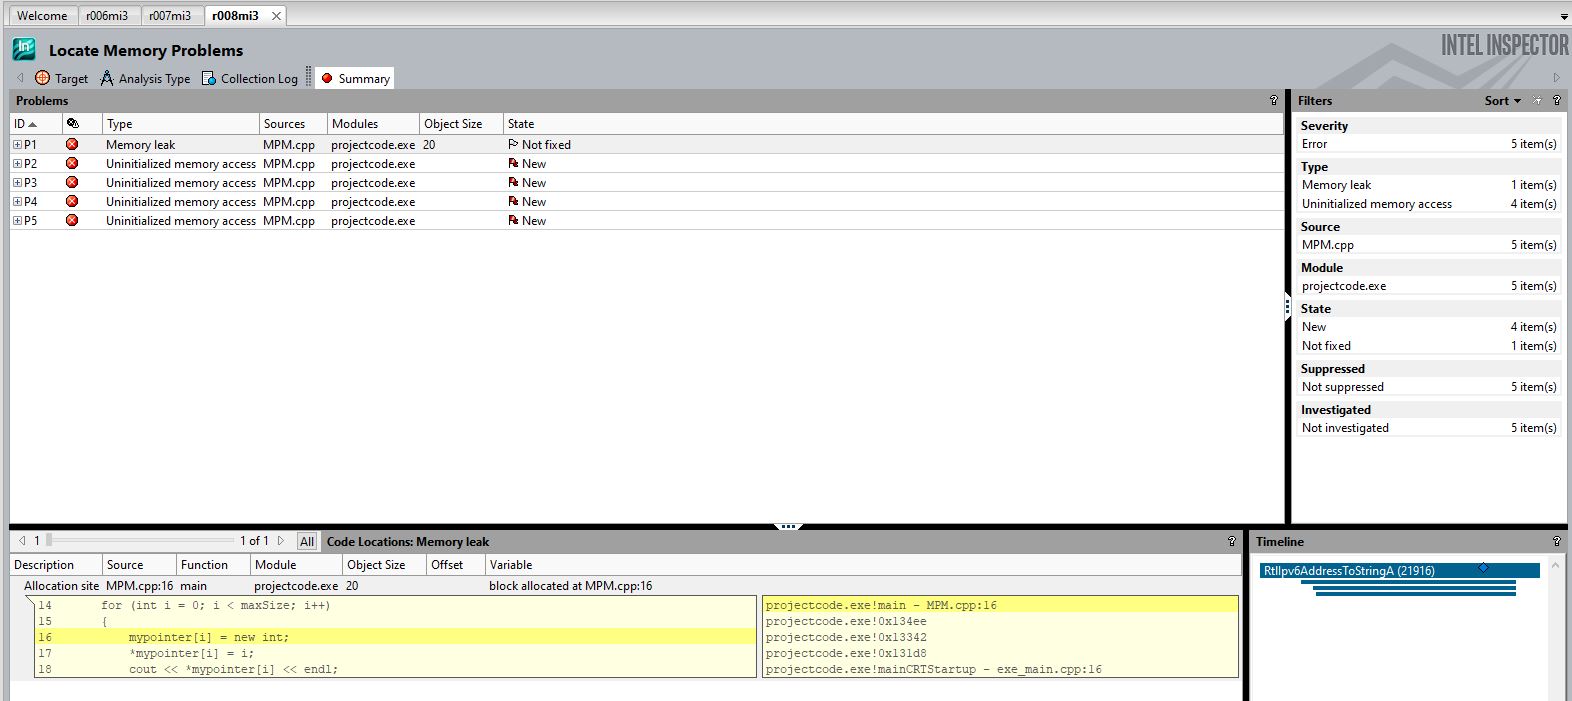
The Below code creates a dynamically allocated array of Integer pointers and allocates a new integer into each index. In the Second For loop, the code goes onto make every even-numbered pointer point towards the next highest odd-numbered pointers memory address. This Effectively causes a memory leak where half of the allocated memory locations no longer have any pointers pointing to them. After this, the code goes onto perform a delete operation on every pointer in an attempt to fool the Parallel Studio debugger.
int main()
#include <iostream>
using namespace std;

const int maxSize = 10;

int main()
{
	// declaring an array of pointers
	int** mypointer = new int* [10];

	// populating the array with pointers
	cout << "\n Populating Array With Pointers \n" << endl;
	for (int i = 0; i < maxSize; i++)
	{
		mypointer[i] = new int;
		*mypointer[i] = i;
		cout << *mypointer[i] << endl;
	}
	cout << "\n -----------------------------------------------" << endl;


	// Switching every even numbered pointer to be pointing towards the next odd numbered pointer
	cout << "\n Switching every even numbered pointer to be pointing towards the next odd numbered pointer \n" << endl;
	for (int i = 0; i < maxSize; i++)
	{
		if (i % 2 == 0)
		{
			mypointer[i] = mypointer[i + 1];
		}
	}
	cout << "\n -----------------------------------------------" << endl;

	//Printing the results;
	cout << "\n Results of the switch \n" << endl;
	for (int i = 0; i < maxSize; i++)
		cout << *mypointer[i] << endl;

	cout << "\n -----------------------------------------------" << endl;

	// deallocating memory
	cout << "\n Deallocating Memory \n" << endl;
	for (int i = 0; i < maxSize; i++)
	{
		int check = i % 2;
		if (check == 0) {
			delete mypointer[i];
			mypointer[i] = nullptr;
		}
		else {
			mypointer[i] = nullptr;
			delete mypointer[i];
			mypointer[i] = nullptr;
		}
	}
	cout << "\n -----------------------------------------------" << endl;

	cout << "\n Checking nullptr's" << endl;
	for (int i = 0; i < maxSize; i++)
	{
		if (mypointer[i] == nullptr)
			cout << "pointer [" << i << "] is a nullptr" << endl;
	}

	cout << "\n **There is now a memory leak with [" << (maxSize / 2) * 4 << "] bytes of data being unreachable **" << endl;


	delete[] mypointer;
	return 0;
}
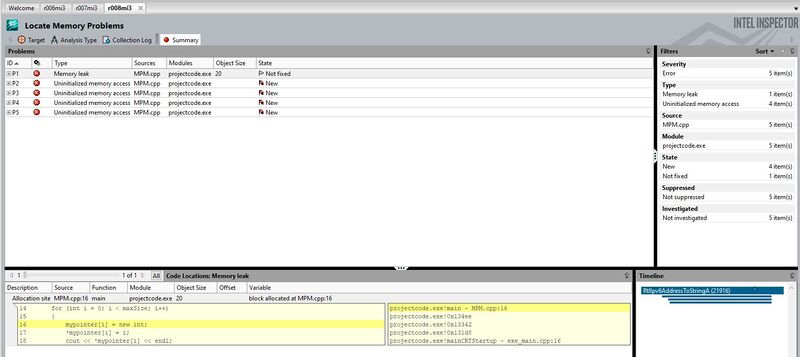
As can be seen Below the Intel Parallel Inspector debugging tool was not fooled by the attempt to misguide it and effectively detected the leak. However it should also be pointed out that it did not detect where the leak occurs, but instead, where the pointer which is leaking is instantiated, furthermore, the debugging tool seems to be misdiagnosing memory errors having to do with improper instantiation, where none exist. This can be caused by the nature of the array having the same signature as a 2D array but being treated as a one dimensional array.
False Positive
The code below attempts to fool the Intel Parallel Inspector into assuming that the pointer allocated pointers have not been deleted when they have. The pointers address' are copied into a temporary pointer called deletor, which then is used to delete the allocated memory without directly calling the delete operation on the raw pointers themselves. The intel parallel studio does not fall for this attempt either. It accurately does not find a memory leak. However, it still shows a false positive for an uninitialized access error due to the nature of the array.
#include <iostream>
using namespace std;

const int maxSize = 10;

int main()
{
	// declaring an array of pointers
	int** mypointer = new int* [10];

	// populating the array with pointers
	cout << "\n Populating Array With Pointers \n" << endl;
	for (int i = 0; i < maxSize; i++)
	{
		mypointer[i] = new int;
		*mypointer[i] = i;
		cout << *mypointer[i] << endl;
	}
	cout << "\n -----------------------------------------------" << endl;


	// Switching every even numbered pointer to be pointing towards the next odd numbered pointer
	cout << "\n deleting pointers \n" << endl;

	int* deletor;
	for (int i = 0; i < maxSize; i++)
	{
		deletor = mypointer[i];
		cout << "Deleting [" << *deletor << "]" << endl;
		delete deletor;

	}
	cout << "\n -----------------------------------------------" << endl;

	//Printing the results;
	cout << "\n Making everything a nullptr \n" << endl;
	for (int i = 0; i < maxSize; i++)
		mypointer[i] = nullptr;


	cout << "\n Checking nullptr's" << endl;
	for (int i = 0; i < maxSize; i++)
	{
		if (mypointer[i] == nullptr)
			cout << "pointer [" << i << "] is a nullptr" << endl;
	}


	delete[] mypointer;
	cout << "\n **There should be no memory leak**" << endl;


	return 0;
}
The image below showcases how The intel Parallel Inspector can show false positives. If you into the yellow highlighted section you will see that the error occurs on line 18 when we try to access *mypointer, which the inspector falsely claims not to have been initialized, however if we look at line 17 we can see that the pointer was properly initialized.
Thread Race Conditions
The below code does three things. The fisrt is to define a class counter. This class has three functions and one member variable. the Variable is the counter which is meant to be iterated. The three functions are the constructor, which sets the counter to 0. The getter which returns the value of the counter and lastly the increment function add(), which when called increments the counter by the specified amount. Secondly the code defines the function runCounter() which is responsible for creating a counter type object, creating ten threads and assigning them all to increment the counter by 1,000 simultaneously. This creates the optimal conditions for a race condition to occur within the add() member function of the counter object. And lastly the main() function is responsible for running the runcounterFunction 10,000 times.
#include <iostream>
#include <thread>
#include <vector>

// Counter Object
class Counter;
int runCounter();

int main()
{

	int val = 0;

	// Runs the counter 1000 times and has 10 threads iterate it by 1000 each, needs to reach 10000 in total
	for (int k = 0; k < 1000; k++)
	{
		if ((val = runCounter()) != 10000)
		{
			std::cout << "Error at count number = " << k << " Counter Value = " << val << std::endl;
		}
	}
	return 0;
}


class Counter
{
	//counter
	int count;
public:
	Counter() {
		count = 0;
	}
	int getCounter() {
		return count;
	}
	void add(int num) {
		for (int i = 0; i < num; ++i)
		{
			// lock should be applied here
			count++;
		}
	}
};

int runCounter()
{
	Counter counter;
	//creates a vector of threads
	//Creates 10 threads gives it a reference to the counter object, resulting in 1000 count++ calss from each thread
	std::vector<std::thread> threads;
	for (int i = 0; i < 10; ++i) {
		threads.push_back(std::thread(&Counter::add, &counter, 1000));
	}

	//joins threads
	for (int i = 0; i < threads.size(); i++)
	{
		threads.at(i).join();
	}
	return counter.getCounter();
}
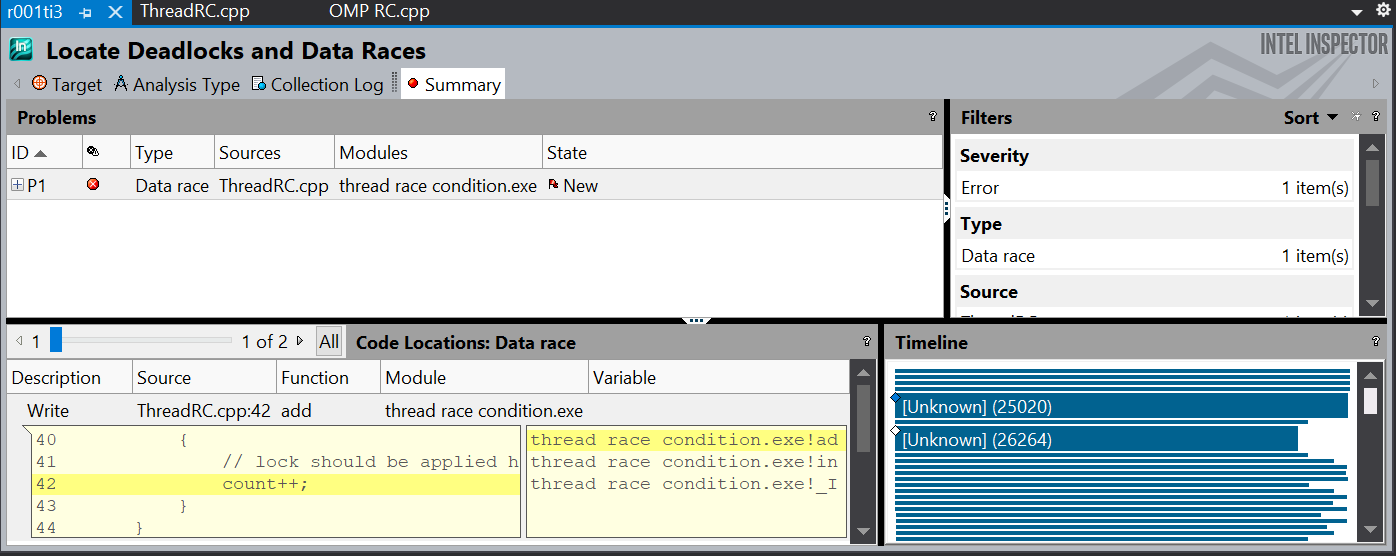
As the image below shows, the Intel Parallel Inspector manages to accurately detect the race condition, and properly highlight it in the showcase window. It should be noted that this view creates the perfect perspective to guide a programmer to implement either a lock or a mutex on this particular segment of code.
OMP Race Conditions
The code below attempts to create a race condition using the OMP parallel construct. The race codnition is created by the variable temp, which is supposed to be a local variable for the specific thread which is used to collect the total sum for the calculations done by the thread. however if the variable is put outside the OMP parallel construct it becomes accessible by all the threads and is no longer a local variable. This causes a race condition.
#include <iostream>
#include <iomanip>
#include <omp.h>


// Race Condition
int main() {
	int numThreads = 6;
	int numSteps = 1000000;
	omp_set_num_threads(numThreads);
	double* sum = new double[numThreads];
	double pi, totalSum = 0.0;
	const double stepSize = 1.0 / numSteps;

	// Creates The Race Condition, Place within the OMP Parallel to undo race condition
	double temp = 0.0;
#pragma omp parallel
	{
		int ID = omp_get_thread_num();
		int incriment = ID;
		double x;
		for (int i = ID; i < numSteps; i = i + numThreads) {
			x = ((double)i + 0.5) * stepSize;
			temp += 1.0 / (1.0 + x * x);
		}

		sum[ID] = temp;
	}

	for (int i = 0; i < numThreads; i++)
	{
		totalSum = totalSum + sum[i];
	}

	pi = (4.0) * totalSum * stepSize;
	delete[] sum;

	std::cout << "Expexted Number : 3.14___" << std::endl;
	std::cout << "REceived Number : " << pi << std::endl;

}
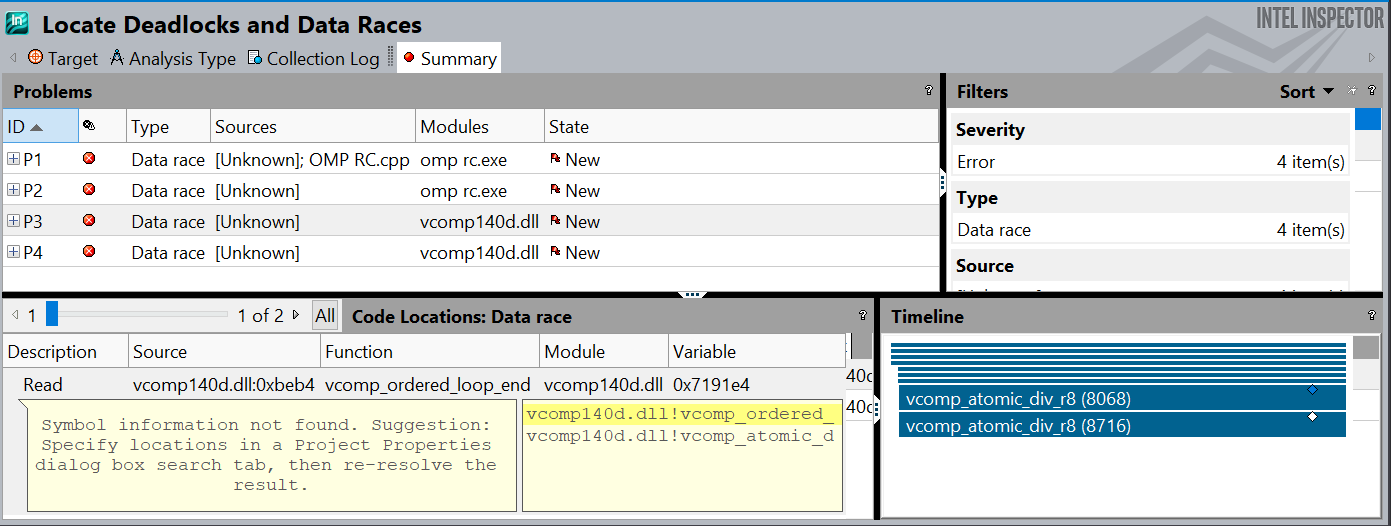
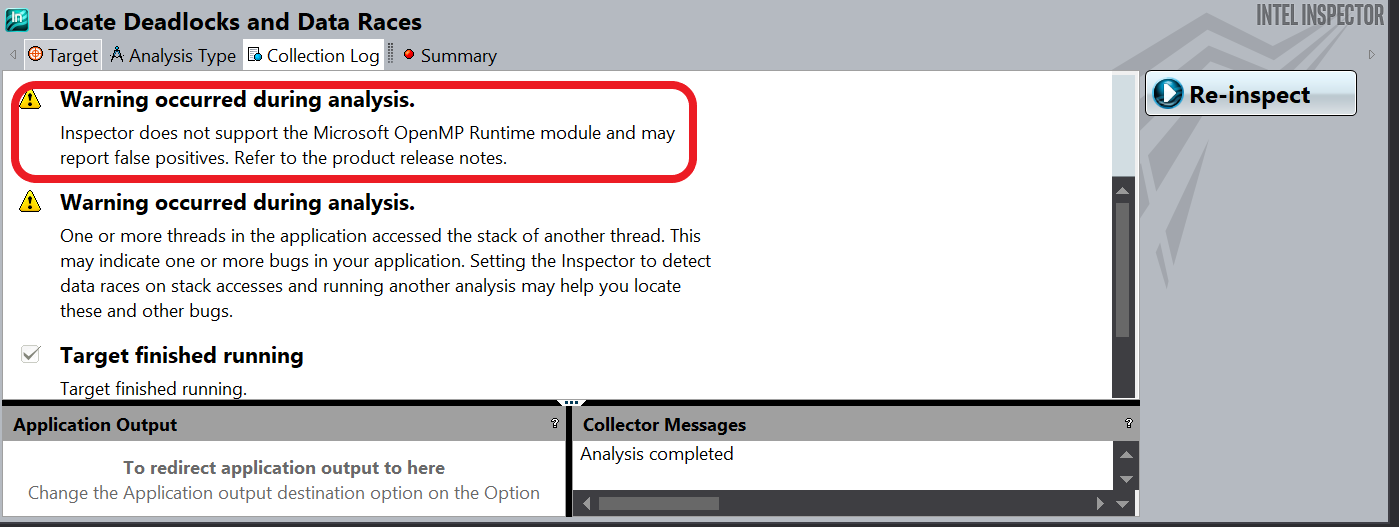
There are two images below, One is an image of the results of an analysis of the above code by the Intel Parallel Inspector which as can be seen has flagged race conditions in the file, however, upon closer examination it becomes apparent that the details about the race conditions are nonsensical and cannot be interpreted (this can be seen by looking at the highlighted portion of the code view). This can be explained by the second image below. Highlighted in that image in the red box a warning message can be seen warning the user that Microsoft OMP is not supported by the Intel Parallel Inspector which might cause false positives or inaccurate diagnostics
OMP Error Message Below
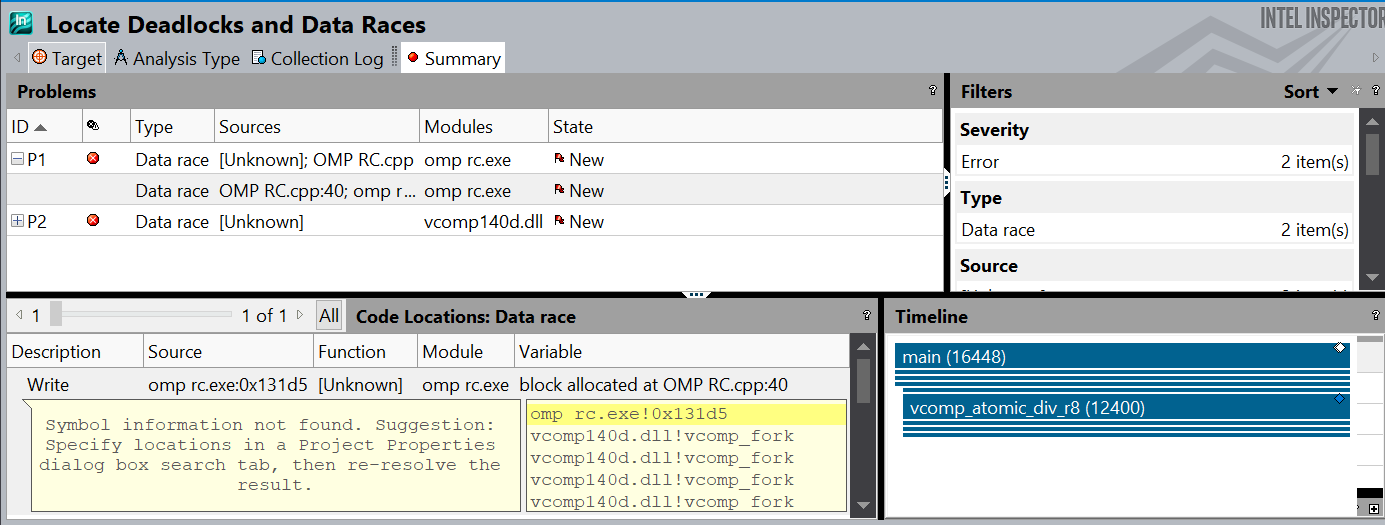
However, it should also be mentioned that should the code be fixed and analysis is re-run the number of positives goes down from 4 to 2. This means that there is internal code generated by the OMP addon that results in the Inspector flagging false positives, but also that the Inspector is capable of detecting race-conditions in OMP code (MS Version), it's just not able to effectively pinpoint their location and communicate it to the programmer. (Image of analysis on fixed code below)
Reference
Analyze with Intel® Parallel Studio XE. (n.d.). Intel. Retrieved November 29, 2020, from https://software.intel.com/content/www/xl/es/develop/tools/parallel-studio-xe/analyze.html?countrylabel=Peru
corob-msft. (n.d.). Build and run a C++ console app project. Docs.Microsoft.com. Retrieved November 29, 2020, from https://docs.microsoft.com/en-us/cpp/build/vscpp-step-2-build?view=msvc-160
Get Started with Intel® Inspector -Linux* OS. (n.d.). Intel. Retrieved November 29, 2020, from https://software.intel.com/content/www/us/en/develop/documentation/get-started-with-inspector/top/linux.html
Introduction to Intel® Inspector. (n.d.). Tech.Decoded Powered by Intel® Software. Retrieved November 29, 2020, from https://techdecoded.intel.io/quickhits/introduction-to-intel-inspector/
Visual Studio* Integration. (n.d.). Intel. Retrieved November 29, 2020, from https://software.intel.com/content/www/us/en/develop/documentation/inspector-user-guide-windows/top/before-you-begin/visual-studio-integration.html
Progress
Update 1: Sunday November 8th 2020 - Created basic topic to research for Intel Parallel Studio Inspector
Update 2: Thursday November 26th 2020 - Added all the headings for the report
Update 3: Sunday November 29th 2020 - Adding all the information for the report
Update 4: Monday November 30th 2020 - Made final edits to the Wiki
