Difference between revisions of "Intel Parallel Studio VTune Amplifier"
| Line 51: | Line 51: | ||
== How to Use it? == | == How to Use it? == | ||
| − | [[ | + | Before you jump into running Intel's VTune Profiler you need to make sure you run visual studio as Administrator to give it access to your hardware information, otherwise it will not be able to optimize for your specific hardware and the data collected with be very limited. |
| + | |||
| + | Then to open Vtune press the menu as indicated below | ||
| + | |||
| + | [[File:Header.png]] | ||
| + | |||
| + | this will open this menu, allowing you to make changes to the application parameters | ||
| + | |||
| + | [[File:Benchmarking menu.png]] | ||
== Performance Analysis == | == Performance Analysis == | ||
Revision as of 23:03, 29 November 2020
Contents
Group Members
Intel Parallel Studio VTune Profiler
The purpose of this project is to show how to use the Intel VTune Profiler with it's features that helps to analyze applications. The Intel VTune Amplifier has now been renamed to Intel Parallel Studio VTune Profiler. It is an intel bottleneck detector which analyzes and optimizes the software performance of a 32 and 64-bit x86 machine. It is a tool used to profile key data from serial and multithreaded applications that are executed on different platforms such as the CPU. The applications can be run on the VTune Profiler standalone version or the version installed with Intel Parallel Studio which then presents the analysis in the Intel VTune Profiler.
Features & Functionalities
Intel Parallel Studio Profiler can be installed as the standalone version, through the web server interface and as the integrated version in Microsoft Visual Studio or with the Eclipse IDE. The intel profiler helps analyze and diagnose:
- Single threaded performance
- Multithreaded applications
- Media & OpenCL Applications
- Memory & Storage Management
- Analyzes & Filter Data
- HPC & Cloud
- System Performance
- Environment
Standalone VTune Profiler Graphical Interface
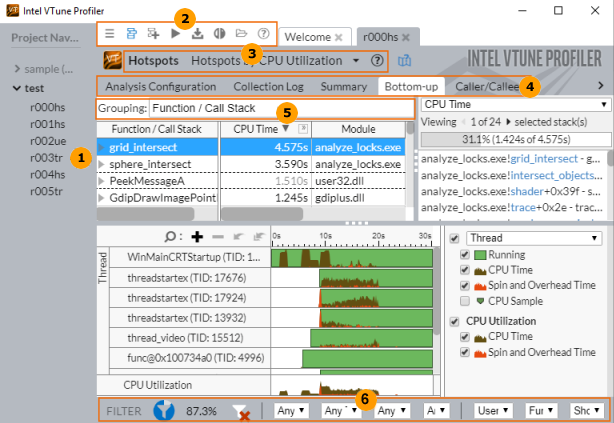
In this version click to create a new project and go to configure analysis. Then the features you will see will help to configure the analysis.
- Use the Project Navigator to manage your project and collect analysis results.
- Menu and Toolbar - configure and control performance analysis, define and view project properties.
- Analysis type and viewpoint - allows to view the correlation of the analysis result and a viewpoint used to display the collected data. Viewpoint is a pre-set configuration of windows/panes for an analysis result. There is also a drop down option to switch between viewpoints.
- Analysis Windows - these are different window tabs that show the analysis type configuration options and collected data provided by the selected viewpoint.
- Grouping - this is a drop-down menu to choose a granularity level for grouping data in the grid and the groupings are based on the hierarchy of the program.
- Filtering - two basic options for filtering the collected data that are per object and per time regions.
Web Server Interface
In this version the Intel VTune Profiler is used in a web server mode. The interface provides a collaborative multi-user environment and access to a common repository of collected performance results. The web server interface helps with running the tool by configuring and controlling the analysis on arbitrary target systems and viewing collected results. A desktop application is not required to run this version.
Microsoft Visual Studio Integration
By default VTune Profiler integrates into Visual Studio. For the installation wizard, you need to have the version of Visual Studio specified used for integration in the IDE. If there are several versions of Visual Studio then click the Customize link to use the version needed for integration in the installation wizard on the Choose Target page.
Eclipse and Intel System Studio IDE Integration
When Intel System Studio is installed the Intel VTune Profiler is integrated in the Eclipse IDE and with this there is access to the standalone interface of the profiler. When launching VTune Profiler from Intel System Studio, the environment variables are not required to be set as they are already set when launching.
How to Use it?
Before you jump into running Intel's VTune Profiler you need to make sure you run visual studio as Administrator to give it access to your hardware information, otherwise it will not be able to optimize for your specific hardware and the data collected with be very limited.
Then to open Vtune press the menu as indicated below
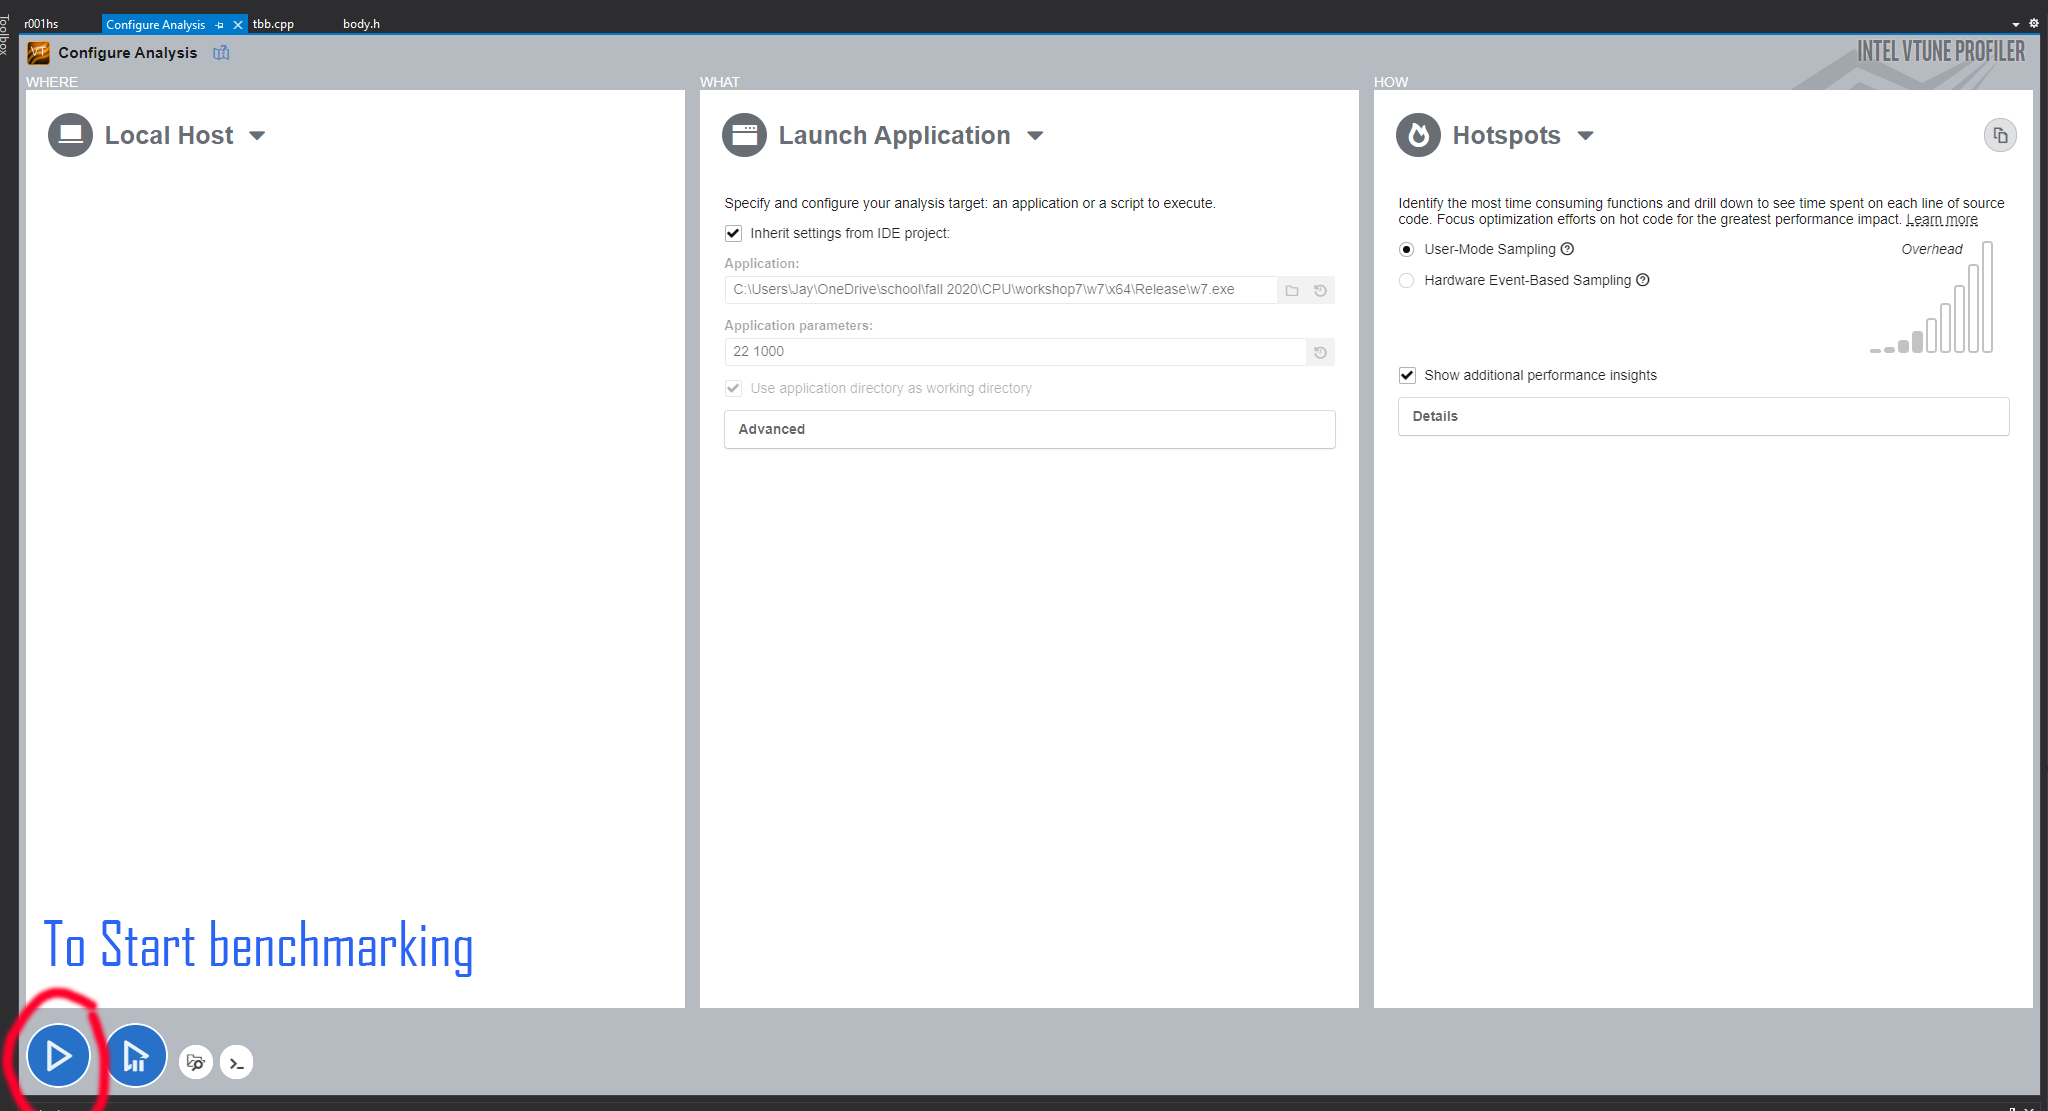
this will open this menu, allowing you to make changes to the application parameters


