Difference between revisions of "GPU621/Striking"
(→Progress) |
(→Progress) |
||
| Line 32: | Line 32: | ||
#[https://msdn.microsoft.com/en-us/library/hh418499.aspx How to: Use the Parallel Watch Window] | #[https://msdn.microsoft.com/en-us/library/hh418499.aspx How to: Use the Parallel Watch Window] | ||
#[https://msdn.microsoft.com/en-us/library/dd998398.aspx Using the Parallel Stacks Window] | #[https://msdn.microsoft.com/en-us/library/dd998398.aspx Using the Parallel Stacks Window] | ||
| − | **[[File:Parallel_stack_view.png| | + | **[[File:Parallel_stack_view.png|300px|thumb|left|alt text]] |
| Line 44: | Line 44: | ||
<tr><td>D</td><td>Tooltip on Node Header</td><td>Shows the ID and user-defined name of each thread whose call path shares this node.</td></tr> | <tr><td>D</td><td>Tooltip on Node Header</td><td>Shows the ID and user-defined name of each thread whose call path shares this node.</td></tr> | ||
<tr><td>E</td><td>Method Context</td><td>Represents one or more stack frames in the same method.</td></tr> | <tr><td>E</td><td>Method Context</td><td>Represents one or more stack frames in the same method.</td></tr> | ||
| + | <tr><td></td></tr> | ||
| + | <tr><td></td></tr> | ||
| + | <tr><td></td></tr> | ||
| + | <tr><td></td></tr> | ||
</table> | </table> | ||
| Line 65: | Line 69: | ||
#[http://www.adeptscience.co.uk/products/cpp/intel-parallel-studio-xe link2 Intel® Parallel Studio XE 2017] | #[http://www.adeptscience.co.uk/products/cpp/intel-parallel-studio-xe link2 Intel® Parallel Studio XE 2017] | ||
#[https://software.intel.com/en-us/articles/intel-parallel-studio-xe-release-notes link Intel® Parallel Studio XE Release Notes] | #[https://software.intel.com/en-us/articles/intel-parallel-studio-xe-release-notes link Intel® Parallel Studio XE Release Notes] | ||
| − | |||
| − | |||
| − | |||
Revision as of 00:10, 24 November 2016
Striking
Our project: Debugging Threads in Intel Parallel Studio
Group Members
Progress
Oct 17th:
- Picked topic
- Picked presentation date.
Oct 20th:
- Created Wiki page
Nov 6th - 13th:
- There are great resources about Intel Parallel Debugger Extension for Microsoft Visual Studio like below.
- Debugging Threads in Intel Parallel Studio - [Dr Dobbs Article]
- Intel® Parallel Debugger Extension, Added Aug 2, 2012 - [[3]]
- Intel Parallel Composer Parallel Debugger Extension Tutorial - [Mittie Sylvian's Video]
However, Intel Parallel Debugger Extension has been deprecated from the version Intel Composer XE 2013. I have noticed this from the Intel User Forum.
- Intel Parallel Debugger Extension has been deprecated beginning with Intel(R) Composer XE 2013 at the end of 2012
Nov 18th - 23th:
- Links about Debug Multithreaded Applications in Visual Studio
- How to: Use the Threads Window
- How to: Use the Parallel Watch Window
- Using the Parallel Stacks Window
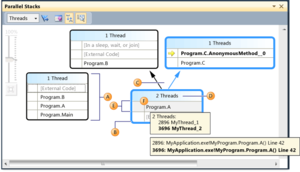
| Callout Letter | Element Name | Description |
| A | Call Stack Segment or Node | Contains a series of method contexts for one or more threads. |
| B | Blue Highlight | Presente the call path of the current thread. |
| C | Arrow lines | Connect nodes to make up the entire call path for the thread(s). |
| D | Tooltip on Node Header | Shows the ID and user-defined name of each thread whose call path shares this node. |
| E | Method Context | Represents one or more stack frames in the same method. |
- Sample code can be downloaded from here
In Progress:
Links about Intel® Parallel Studio XE 2017
