Difference between revisions of "GPU621/Intel Parallel Studio VTune Amplifier"
Ikondrakov (talk | contribs) (→Demonstration) |
Ikondrakov (talk | contribs) (→Code) |
||
| Line 401: | Line 401: | ||
te = std::chrono::steady_clock::now(); | te = std::chrono::steady_clock::now(); | ||
| − | std::cout << | + | std::cout << MAX_TILES << " thread" << (nt > 1 ? "s" : "") << std::endl; |
for (int i = 0; i < N; i++) | for (int i = 0; i < N; i++) | ||
std::cout << out[i] << ' '; | std::cout << out[i] << ' '; | ||
Revision as of 20:28, 8 December 2021
Contents
Group Members
Introduction
This page will demonstrate the purpose, features, and usage of the Intel Parallel Studio VTune Profiler. In short, it is a performance analyzing tool for 32-bit, 64-bit, and x86 architectures running Linux-based or Microsoft Windows operating systems. It supports both Intel and AMD hardware, but advanced hardware-based features and acceleration require an Intel-manufactured CPU. Furthermore, the application is specifically designed to help with optimization of application and system performance, High-performance computing configurations, and more by detecting performance bottlenecks through run-time environment profiling on serial and multi-threaded software.
Details
Intel Parallel Studio VTune Amplifier is available as a standalone application or as part of the Intel Parallel Studio bundle. The tool analyzes the run-time environment metrics of the target executable such as CPU utilization, Throttling, Thread usage, Memory usage, I/O, and other system-level resources to provide a developer with an extensive and precise report and suggestions for possible improvements. Additionally, the application measures the performance of a program, and each function separately and displays the report in an integrated Visual Studio user-friendly interface with comprehensive graphs and tables. Furthermore, the tool can perform an overview to help a developer identify any bottlenecks to resolve and suggest little tweaks such as increasing the grain size or the scope of the data when using the TBB library that Intel provides. Overall, this is a powerful and reliable tool for scalable parallelization.
Our team will point the usage and importance of the tool by demonstrating a little case study with the code implemented during the semester. Precisely, the Workshop 7 - Threading Building Blocks(parallel_scan) which is about a trivial Prefix Scan Problem. We will compare the performance and resource utilization of Serial, OpenMP and TBB versions each being analyzed by Intel Parallel Studio VTune Amplifier in Visual Studio.
Features & Functionalities
Performance Snapshot
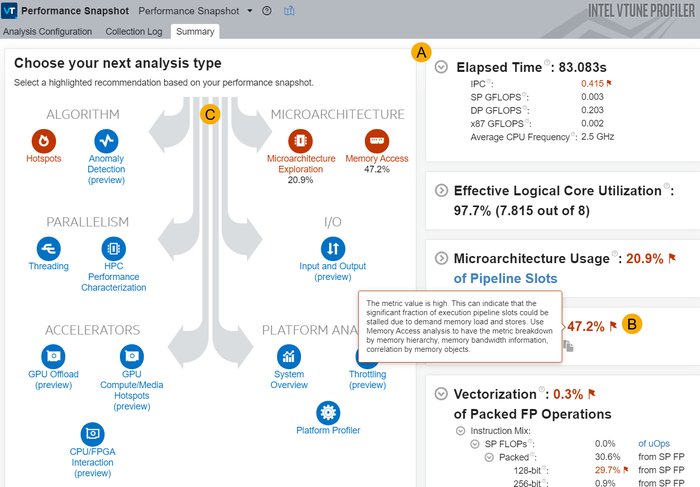
This feature will take all the different types of analysis and provide you a summary of each analysis and show how the performance is for each one, while highlighting the ones with the worst performances. This allows users to easily pinpoint which sections need to be prioritized and which sections may require more time to resolve.
Algorithm
Hotspots
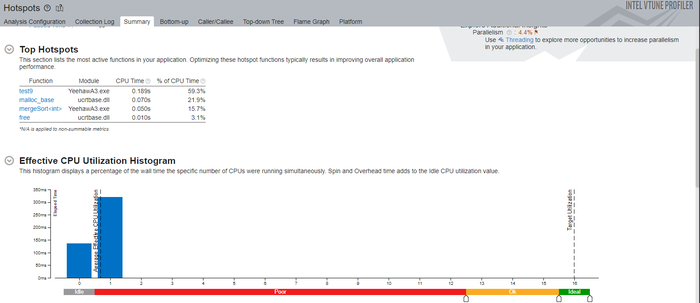
This feature will User-Mode Sampling or Hardware Event Based Sampling to collect data while your application is running. After the data collection is completed, it will display where in the process does the code stall or take the most time running and how well you’re utilizing your CPU threads.
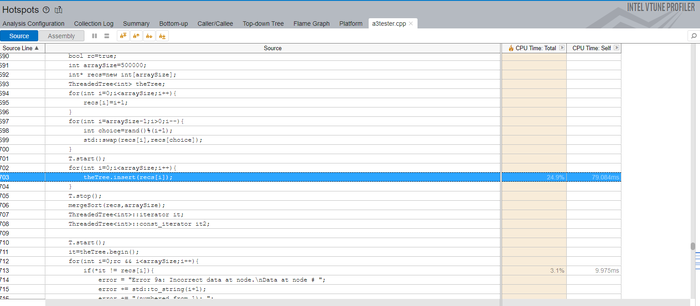
You can also open the source code and display which functions are taking up the most CPU time. Which allows you to pinpoint where you should start on optimizing your code and allows you to focus on the functions that are causing the most run-time delay.
User-Mode Sampling
VTune uses a low overhead (~5%) sampling and tracing collection that works to get the information needed without slowing down the application significantly. The data collector uses the OS timer to profile the application, collects samples of all active instruction addresses in intervals of 10ms, and captures a call sequence. Once everything has been collected, it will display the results of the data collection in the results tab.
Hardware Event-Based Sampling
VTune will analyze not just the application running, but all processes running on your system at the moment of run-time and will provide CPU run time performance on the system as a whole. It will still create a list of functions that run in the current application while timing them, but it won't capture the call sequences as hotspots.
For more information on Hotspots click here
Anomaly Detection Analysis
This feature will analyze your code and search for different anomalies caught during run-time. The different type of anomalies is:
Context Switch Anomaly
This helps to pinpoint issues with threads idling too long due to synchronization issues.
Kernal-Induced Anomaly
This provides insight on any issues with the connection between the internal kernel and the software.
Frequency Drops
These can be rather concerning since CPU frequency drops are likely due to an issue with your hardware like inefficient cooling or other CPU related issues.
Control Flow Deviation Anomaly
When the Instructions Retired metric is exceptionally large for some threads which could be the cause of a code deviation during execution.
For more information on Anomaly Detection click here
Microarchitecture
Microarchitecture Exploration
This feature does an analysis to give you information on how well your code is going through the core pipeline and it does some calculations to determine ratios used for identifying the issues that you may have at a hardware-level.
For more information on Microarchitecture Exploration click here
Memory Access
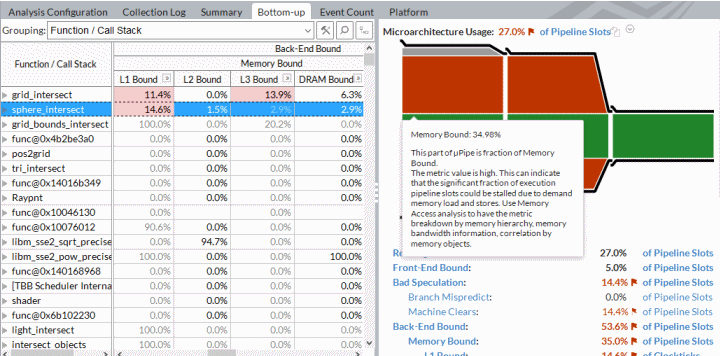
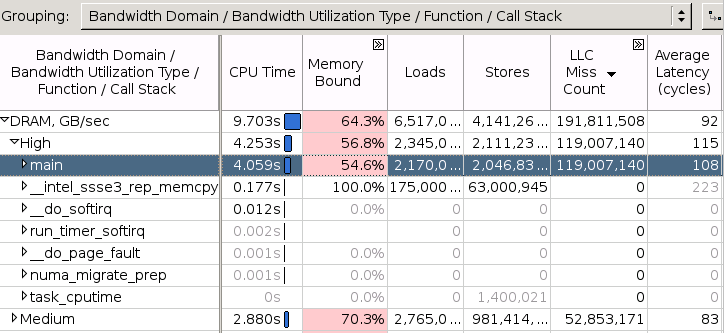
This feature is used to locate memory related issues, like proper memory allocations/de-allocations, high bandwidth issues, and NUMA(Non-Uniform Memory Access) problems
Memory Access analysis type uses hardware event-based sampling to collect data for the following metrics:
- Loads and Stores metrics that show the total number of loads and stores
- LLC Miss Count metric that shows the total number of last-level cache misses
- Local DRAM Access Count metric that shows the total number of LLC misses serviced by the local memory
- Remote DRAM Access Count metric that shows the number of accesses to the remote socket memory
- Remote Cache Access Count metric that shows the number of accesses to the remote socket cache
- Memory Bound metric that shows a fraction of cycles spent waiting due to demand load or store instructions
- NUMA: % of Remote Accesses metric shows percentage of memory requests to remote DRAM. The lower its value is, the better.
- DRAM Bound metric that shows how often the CPU was stalled on the main memory (DRAM). This metric enables you to identify
- DRAM Bandwidth Bound, UPI Utilization Bound issues, as well as Memory Latency issues with the following metrics:
- Remote / Local DRAM Ratio metric that is defined by the ratio of remote DRAM loads to local DRAM loads
- Local DRAM metric that shows how often the CPU was stalled on loads from the local memory
- Remote DRAM metric that shows how often the CPU was stalled on loads from the remote memory
- Remote Cache metric that shows how often the CPU was stalled on loads from the remote cache in other sockets
- Average Latency metric that shows an average load latency in cycles
For more information on Memory Access click here
Parallelism
Threading
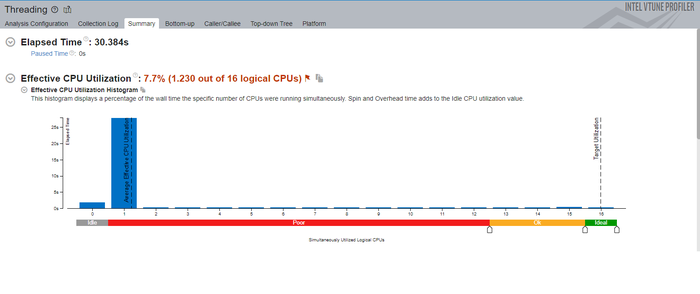
This feature will analyze your program and provide you with results explaining how well you’re utilizing your cores, how many threads you use throughout your program, shows how much load each thread takes on, and even more in-depth information like wait-time and spin and overhead time.
Like Hotspots there are two modes of data collection User-Mode Sampling and Tracing and Hardware Event-Based Sampling and Context Switches.
User-Mode Sampling and Tracing
This mode recognizes synchronization objects and collect thread wait time by objects. The data can help the user understand the thread interactions and pinpointing where optimization can be performed within the code.
Hardware Event-Based Sampling and Context Switches
This mode collects thread idle wait-time and even though there aren’t any object definition, the problematic synchronization functions and be identified based on the wait time attributed with call stacks.
For more information on Threading click here
HPC Performance
This feature helps to identify how well your compute-heavy application uses CPU, memory, and floating point operation hardware resources. This analysis can be considered a starting point when understanding the performance aspects of your applications.
For more information on HPC Performance click here
Accelerators
GPU Offload
This feature are for applications that use the GPU for video rendering, graphic rendering and video processing. It allows you to analyze some CPU-based workloads alongside GPU-based workloads within a unified time domain.
It enables you to:
- Understand how effective your application is with using DPC++ or OpenCL kernals
- Analyze the execution of Intel Media SDK tasks over time (linux only)
- Explore GPU usage and analyze a software queue for GPU engines
- Allows you to know if your application is GPU or CPU bound
For more information on GPU Offloading click here
CPU/FPGA Interaction
Assesses the balance between CPU and FPGA (Field-Programmable Gate Array)in systems with FPGA hardware.
For more information on CPU/FPGA Interaction click here
Platform Analyses
Platform Profiler
This analysis will provide a view of the most importance parts of system behaviour, as well as providing information on the effectiveness on utilizing the hardware's resources and imbalance issues related to those hardware components.
For more information on Platform Profiler click here
System Overview
It does a platform-wide analysis that monitors the behaviour of the target system and finds factors that limit performance. The two modes are Hardware Event-Based Sampling (which shows how well you're using hardware resources) and Hardware Tracing (only for Linux and Android Targets, and finds cause of latency issues.)
For more information on System Overview click here
Versions of the software:
- Standalone VTune Profiler Graphical Interface
- Web Server Interface
- Microsoft Visual Studio Integration
- Eclipse IDE Integration
- Intel System Studio IDE Integration
How to configure and Start Analysis
Intel Parallel Studio VTune Profiler has a couple of versions and a couple of IDE integrations, but for the sake of simplicity and relevance to the course material, we are going to use Visual Studio Integration of the Profiler. To begin, the IDE must be run with root privileges for the Profiler to have access to the hardware information and resources, otherwise, the analysis and collected data will be limited.
To open Vtune press the button in the upper toolkit as shown below:
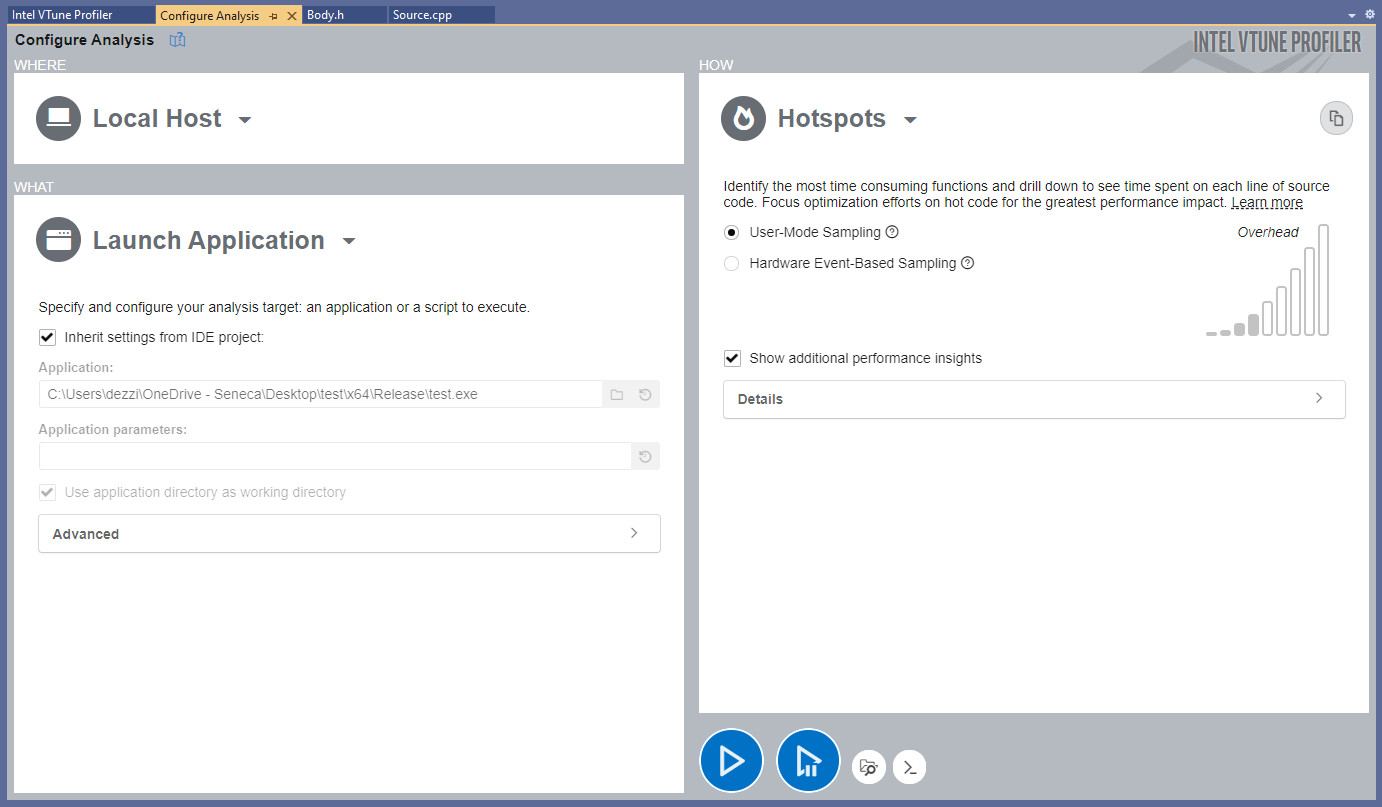
Next, Configure Analysis button needed to be pressed to get to the VTune Main Menu:
Where a target program and host where it will be executed can be chosen. Also, program parameters and working directories can be configured. Finally, the method of analysis and detection with different options can be enabled from the "How" menu:
Finally, the start button, as shown above, can be pressed to start the actual Vtune configured analysis.
Demonstration
Baseline
The Prefix Scan algorithm implemented in Serial, OpenMP and TBB version will be run with an array of size 2^30. The metrics will be collected through Vtune.
Single-thread Prefix Scan
Starting with the Serial approach to the Prefix Scan Problem.
Code
// Iurii Kondrakov
// Serial_Main.cpp
// 2021.12.06
#include <iostream>
#include <chrono>

//Exclusive Scan
template <typename T, typename C>
int excl_scan(
	const T* in,                // source data
	T* out,                     // output data
	int size,                   // size of data sets
	C combine,                  // combine operation
	T initial                   // initial value
) {

	if (size > 0) {
		for (int i = 0; i < size - 1; i++) {
			out[i] = initial;
			initial = combine(initial, in[i]);
		}
		out[size - 1] = initial;
	}
	return 1; // 1 thread
}

// report system time
void reportTime(const char* msg, std::chrono::steady_clock::duration span) {
	auto ms = std::chrono::duration_cast<std::chrono::microseconds>(span);
	std::cout << msg << " - took - " <<
		ms.count() << " microseconds" << std::endl;
}

int main(int argc, char** argv) {
	if (argc > 2) {
		std::cerr << argv[0] << ": invalid number of arguments\n";
		std::cerr << "Usage: " << argv[0] << "\n";
		std::cerr << "Usage: " << argv[0] << "  power_of_2\n";
		return 1;
	}
	std::cout << "Serial Prefix Scan" << std::endl;

	// initial values for testing
	const int N = 9;
	const int in_[N]{ 3, 1, 7, 0, 1, 4, 5, 9, 2 };

	// command line arguments - none for testing, 1 for large arrays
	int n, nt{ 1 };
	if (argc == 1) {
		n = N;
	}
	else {
		n = 1 << std::atoi(argv[1]);
		if (n < N) n = N;
	}
	int* in = new int[n];
	int* out = new int[n];

	// initialize
	for (int i = 0; i < N; i++)
		in[i] = in_[i];
	for (int i = N; i < n; i++)
		in[i] = 1;
	auto add = [](int a, int b) { return a + b; };

	std::chrono::steady_clock::time_point ts, te;

	// Exclusive Prefix Scan
	ts = std::chrono::steady_clock::now();
	nt = excl_scan<int, decltype(add)>(in, out, n, add, (int)(0));
	te = std::chrono::steady_clock::now();

	std::cout << nt << " thread" << (nt > 1 ? "s" : "") << std::endl;
	for (int i = 0; i < N; i++)
		std::cout << out[i] << ' ';
	std::cout << out[n - 1] << std::endl;
	reportTime("Exclusive Scan", te - ts);


	delete[] in;
	delete[] out;
}
Performance
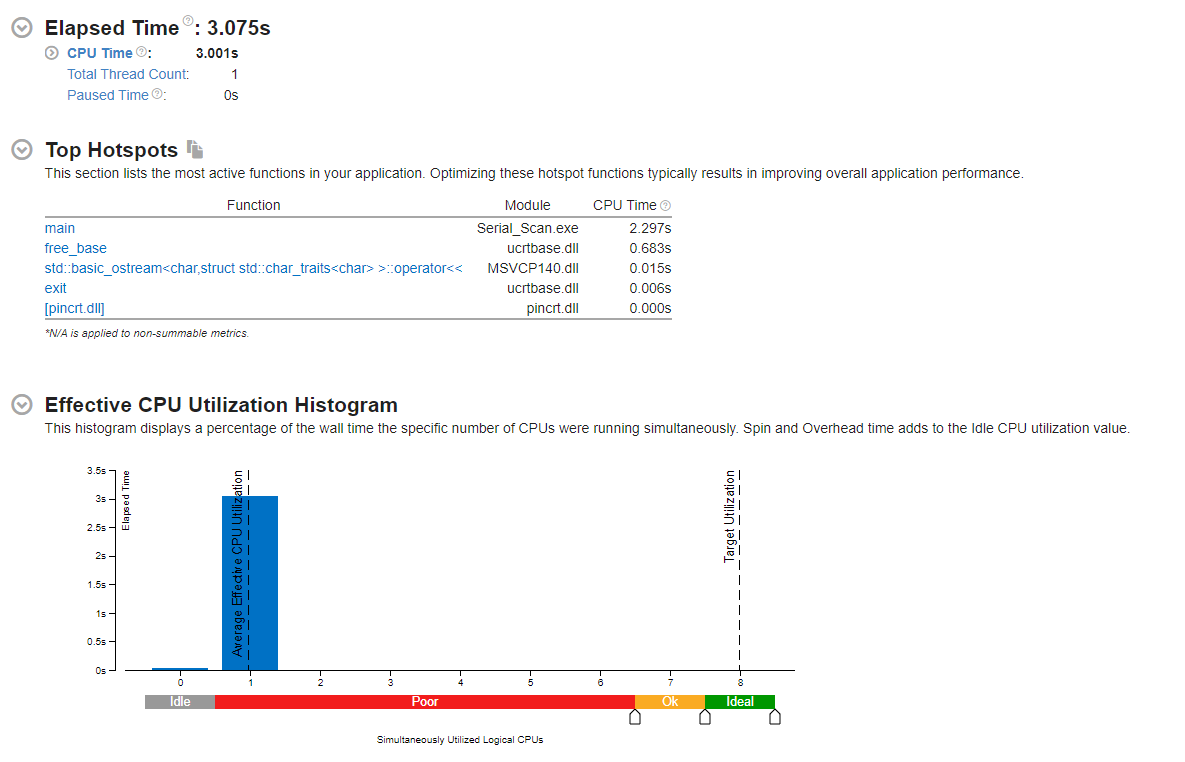
As expected, the serail version CPU utilization is considered poor due to the fact that only one thread is used for data utilization and Prefix Scan Algorithm. As can be seen from the Hotspot report the main function took 2.297 seconds under the Intel compiler with no optimization. Interestingly, the deallocation is also taken a lot of CPU time with 0.6833 seconds.
OpenMP Prefix Scan
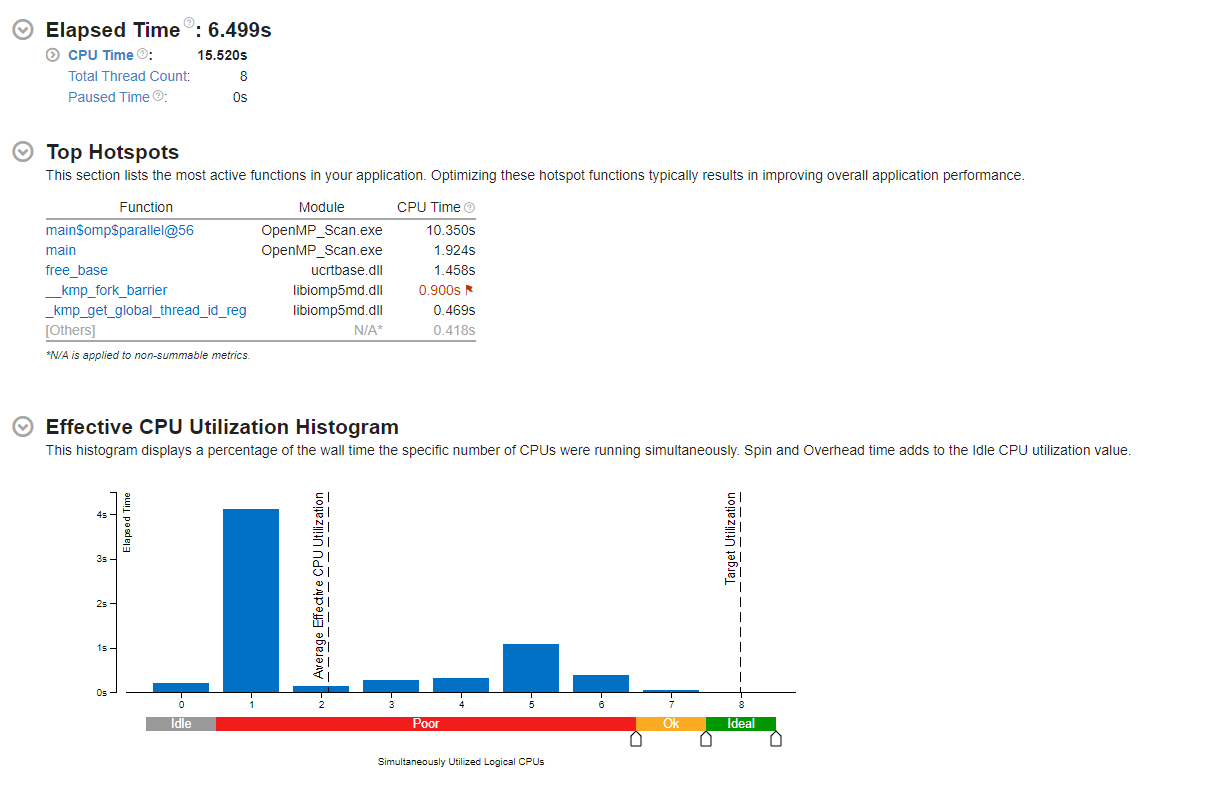
Next goes the OpenMP implementation using Worksharing and barrier, single directives and 8 threads
Code
// Iurii Kondrakov
// OMP_Main.cpp
// 2021.12.07

#include <iostream>
#include <chrono>
#include <omp.h>

const int MAX_TILES = 8;

template <typename T, typename C>
T reduce(
	const T* in, // points to the data set
	int n,       // number of elements in the data set
	C combine,   // combine operation
	T initial    // initial value
) {

	for (int i = 0; i < n; i++)
		initial = combine(initial, in[i]);
	return initial;
}

template <typename T, typename C>
void excl_scan(
	const T* in,                // source data
	T* out,                     // output data
	int size,                   // size of data sets
	C combine,                  // combine operation
	T initial                   // initial value
) {

	if (size > 0) {
		for (int i = 0; i < size - 1; i++) {
			out[i] = initial;
			initial = combine(initial, in[i]);
		}
		out[size - 1] = initial;
	}
}

template <typename T, typename C>
void scan(
	const T* in,   // source data
	T* out,        // output data
	int size,      // size of source, output data sets
	C combine,     // combine expression
	T initial      // initial value
)
{
	if (size > 0) {
		// allocate memory for maximum number of tiles
		T stage1Results[MAX_TILES];
		T stage2Results[MAX_TILES];
#pragma omp parallel num_threads(MAX_TILES)
		{
			int itile = omp_get_thread_num();
			int ntiles = omp_get_num_threads();
			int tile_size = (size - 1) / ntiles + 1;
			int last_tile = ntiles - 1;
			int last_tile_size = size - last_tile * tile_size;

			// step 1 - reduce each tile separately
			stage1Results[itile] = reduce(in + itile * tile_size,
				itile == last_tile ? last_tile_size : tile_size,
				combine, T(0));
#pragma omp barrier

			// step 2 - perform exclusive scan on stage1Results
			// store exclusive scan results in stage2Results[]
#pragma omp single
			excl_scan(stage1Results, stage2Results, ntiles,
				combine, T(0));

			// step 3 - scan each tile separately using stage2Results[]
			excl_scan(in + itile * tile_size, out + itile * tile_size,
				itile == last_tile ? last_tile_size : tile_size,
				combine, stage2Results[itile]);
		}
	}
}

// report system time
void reportTime(const char* msg, std::chrono::steady_clock::duration span) {
	auto ms = std::chrono::duration_cast<std::chrono::microseconds>(span);
	std::cout << msg << " - took - " <<
		ms.count() << " microseconds" << std::endl;
}

int main(int argc, char** argv) {
	if (argc > 2) {
		std::cerr << argv[0] << ": invalid number of arguments\n";
		std::cerr << "Usage: " << argv[0] << "\n";
		std::cerr << "Usage: " << argv[0] << "  power_of_2\n";
		return 1;
	}
	std::cout << "Serial Prefix Scan" << std::endl;

	// initial values for testing
	const long long N = 9;
	const long long in_[N]{ 3, 1, 7, 0, 1, 4, 5, 9, 2 };

	// command line arguments - none for testing, 1 for large arrays
	long long n, nt{ 1 };
	if (argc == 1) {
		n = N;
	}
	else {
		n = 1 << std::atoi(argv[1]);
		if (n < N) n = N;
	}
	long long* in = new long long[n];
	long long* out = new long long[n];

	// initialize
	for (int i = 0; i < N; i++)
		in[i] = in_[i];
	for (int i = N; i < n; i++)
		in[i] = 1;
	auto add = [](int a, int b) { return a + b; };

	std::chrono::steady_clock::time_point ts, te;

	// Exclusive Prefix Scan
	ts = std::chrono::steady_clock::now();
	scan<long long, decltype(add)>(in, out, n, add, (int)0);
	te = std::chrono::steady_clock::now();

	std::cout << MAX_TILES << " thread" << (nt > 1 ? "s" : "") << std::endl;
	for (int i = 0; i < N; i++)
		std::cout << out[i] << ' ';
	std::cout << out[n - 1] << std::endl;
	reportTime("Exclusive Scan", te - ts);

    delete[] in;
    delete[] out;
}