Difference between revisions of "GPU610/gpuchill"
(→Shrink Image) |
(→Beginning Information) |
||
| Line 271: | Line 271: | ||
=== Assignment 2 === | === Assignment 2 === | ||
==== Beginning Information ==== | ==== Beginning Information ==== | ||
| + | |||
| + | Image used for all of the testing | ||
| + | |||
[[File:Duck.JPG||400px]] | [[File:Duck.JPG||400px]] | ||
Latest revision as of 21:29, 4 April 2019
GPU610/DPS915 | Student List | Group and Project Index | Student Resources | Glossary
Contents
GPU n' Chill
Team Members
- Daniel Serpa, Calculation of Pi, Shrink & Rotate
- Abdul Kabia, Some responsibility
- Josh Tardif, Some responsibility
- Andrew Faux, Some responsibility
- ...
Progress
Assignment 1
Sudoku Brute Force Solver
I decided to profile a simple brute force Sudoku solver, found here (https://github.com/regehr/sudoku). The solver uses a simple back tracking algorithm, inserting possible values into cells, iterating through the puzzles thousands of times, until it eventually produces an answer which does not violate any of the rules of Sudoku. As such the solver runs at the same speed regardless of the human difficulty rating, able to solve easy and 'insane' level puzzles at the same speed. The solver also works independent of the ratio between clues and white space, producing quick results with even the most sparsely populated puzzles.As such the following run of the program uses a puzzle which is specifically made to play against the back tracking algorithm and provides maximum time for the solver.
Test run with puzzle:
Original configuration:
-------------
|   |   |   |
|   |  3| 85|
|  1| 2 |   |
-------------
|   |5 7|   |
|  4|   |1  |
| 9 |   |   |
-------------
|5  |   | 73|
|  2| 1 |   |
|   | 4 |  9|
-------------
17 entries filled
solution:
-------------
|987|654|321|
|246|173|985|
|351|928|746|
-------------
|128|537|694|
|634|892|157|
|795|461|832|
-------------
|519|286|473|
|472|319|568|
|863|745|219|
-------------
found 1 solutions

real	0m33.652s
user	0m33.098s
sys	0m0.015s
Flat profile:
Each sample counts as 0.01 seconds.
  %   cumulative   self              self     total
 time   seconds   seconds    calls   s/call   s/call  name
 46.42     10.04    10.04 622865043     0.00     0.00  check_row
 23.52     15.13     5.09        1     5.09    21.32  solve
 18.26     19.08     3.95 223473489     0.00     0.00  check_col
 10.02     21.25     2.17 100654218     0.00     0.00  check_region
  0.72     21.40     0.16        2     0.08     0.08  print
  0.39     21.49     0.09                             frame_dummy
I believe that if a GPU was used to enhance this program one would see a great increase of speed. All of the check functions essentially do the same thing, iterating through possible inserted values for any that violate the rules. If one is able to unload all of these iterations onto the GPU then there should be a corresponding increase in speed.
Christopher Ginac Image Processing Library
I decided to profile a single user created image processing library written by Christopher Ginac, you can follow his post of the library here. His library enables the user to play around with .PGM image formats. If given the right parameters, users have the following options:
What would you like to do:
[1] Get a Sub Image
[2] Enlarge Image
[3] Shrink Image
[4] Reflect Image
[5] Translate Image
[6] Rotate Image
[7] Negate Image
I went with the Enlarge option to see how long that would take. In order for me to do this, I had to test both the limits of the program and my own seneca machine allowed space, in order to do this, I had to use a fairly large image. However, since the program creates a second image, my Seneca account ran out of space for the new image, so the program could not write out the newly enlarged image. So I had to settle on an image that was 16.3MB max, so that it could write a new one, totally in 32.6MB of space.
real    0m10.595s
user    0m5.325s
sys     0m1.446s
Which isn't really bad, but when we look deeper, we see where most of our time is being spent
Flat profile:

Each sample counts as 0.01 seconds.
  %   cumulative   self              self     total
 time   seconds   seconds    calls   s/call   s/call  name
 21.74      1.06     1.06        1     1.06     1.06  Image::operator=(Image const&)
 21.33      2.10     1.04        2     0.52     0.52  Image::Image(int, int, int)
 18.66      3.01     0.91 154056114     0.00     0.00  Image::getPixelVal(int, int)
 15.59      3.77     0.76        1     0.76     2.34  Image::enlargeImage(int, Image&)
 14.97      4.50     0.73        1     0.73     1.67  writeImage(char*, Image&)
  3.69      4.68     0.18        2     0.09     0.09  Image::Image(Image const&)
  2.67      4.81     0.13 17117346     0.00     0.00  Image::setPixelVal(int, int, int)
  0.82      4.85     0.04        1     0.04     0.17  readImage(char*, Image&)
  0.62      4.88     0.03        1     0.03     0.03  Image::getImageInfo(int&, int&, int&)
  0.00      4.88     0.00        4     0.00     0.00  Image::~Image()
  0.00      4.88     0.00        3     0.00     0.00  std::operator|(std::_Ios_Openmode, std::_Ios_Openmode)
  0.00      4.88     0.00        1     0.00     0.00  _GLOBAL__sub_I__ZN5ImageC2Ev
  0.00      4.88     0.00        1     0.00     0.00  readImageHeader(char*, int&, int&, int&, bool&)
  0.00      4.88     0.00        1     0.00     0.00  __static_initialization_and_destruction_0(int, int)
It seems most of our time in this part of the code is spent assigning our enlarged image to the now one, and also creating our image object in the first place. I think if we were to somehow use a GPU for this process, we would see an decrease in run-time for this part of the library. Also, there also seems to be room for improvement on the very 'Image::enlargeImage' function itself. I feel like by loading said functionality onto thje GPU, we can reduce it's 0.76s to something even lower.
Using the same image as above (16MB file), I went ahead and profile the Negate option as well. This as the name implies turns the image into a negative form.
real    0m5.707s
user    0m0.000s
sys     0m0.000s
As you can see, about half the time of the Enlarge option, which is expect considering you're not doing as much.
Flat profile:

Each sample counts as 0.01 seconds.
  %   cumulative   self              self     total
 time   seconds   seconds    calls  ms/call  ms/call  name
 23.53      0.16     0.16        2    80.00    80.00  Image::Image(Image const&)
 16.18      0.27     0.11        2    55.00    55.00  Image::Image(int, int, int)
 14.71      0.37     0.10                             _fu62___ZSt4cout
 13.24      0.46     0.09 17117346     0.00     0.00  Image::getPixelVal(int, int)
 13.24      0.55     0.09        1    90.00    90.00  Image::operator=(Image const&)
  7.35      0.60     0.05        1    50.00   140.00  writeImage(char*, Image&)
  7.35      0.65     0.05        1    50.00   195.00  Image::negateImage(Image&)
  4.41      0.68     0.03 17117346     0.00     0.00  Image::setPixelVal(int, int, int)
  0.00      0.68     0.00        4     0.00     0.00  Image::~Image()
  0.00      0.68     0.00        3     0.00     0.00  std::operator|(std::_Ios_Openmode, std::_Ios_Openmode)
  0.00      0.68     0.00        1     0.00     0.00  readImageHeader(char*, int&, int&, int&, bool&)
  0.00      0.68     0.00        1     0.00     0.00  readImage(char*, Image&)
  0.00      0.68     0.00        1     0.00     0.00  Image::getImageInfo(int&, int&, int&)
Notice in both cases of the Enlarge and Negate options the function "Image::Image(int, int, int)" is always within the top 3 of functions that seem to take the most time. Also, the functions "Image::setPixelVal(int, int, int)" and "Image::getPixelVal(int, int)" are called very often. I think if we focus our efforts on unloading the "Image::getPixelVal(int, int)" and "Image::setPixelVal(int, int, int)" functions onto the GPU as I imagine they are VERY repetitive tasks, as well as try and optimize the "Image::Image(int, int, int)" function; we are sure to see an increase in performance for this program.
Merge Sort Algorithm
I decide to profile a vector merge sort algorithm. A merge sort is based on a based on divide and conquer technique which recursively breaks down a problem into two or more sub-problems of the same or related types. When these become simple enough to be solved directly the sub-problems are then combined to give a solution to the original problem. It first divides the array into equal halves and then combines them in a sorted manner. Due to this type of sort being broken into equal parts, I thought that it would be perfect for a GPU to be able to accelerate the process. With the sort being broken down into multiple chunks and then sent to the GPU it will be able to accomplish its task more efficiently. I was able to find the source code here.
Profile for 10 million elements between 1 and 10000. Using -02 optimization.
Flat profile:

Each sample counts as 0.01 seconds.
  %   cumulative   self              self     total
 time   seconds   seconds    calls  ns/call  ns/call  name
 48.35      1.16     1.16  9999999   115.56   115.56  mergeSort(std::vector<int, std::allocator<int> >&, std::vector<int, std::allocator<int> >&,
                                                      std::vector<int, std::allocator<int> >&)
 32.80      1.94     0.78                             sort(std::vector<int, std::allocator<int> >&)
 19.34      2.40     0.46 43708492    10.58    10.58  std::vector<int, std::allocator<int> >::_M_insert_aux(__gnu_cxx::__normal_iterator<int*, std::vector<int,
                                                      std::allocator<int> > >, int const&)
  0.00      2.40     0.00        1     0.00     0.00  _GLOBAL__sub_I_main
As you can see 80% of the total time was spent in mergeSort and sort functions.
If we look at Amdahl's law Sn = 1 / ( 1 - 0.80 + 0.80/8 ) we can expect a maximum speedup of 3.3x.
Calculation of Pi
Initial Thoughts
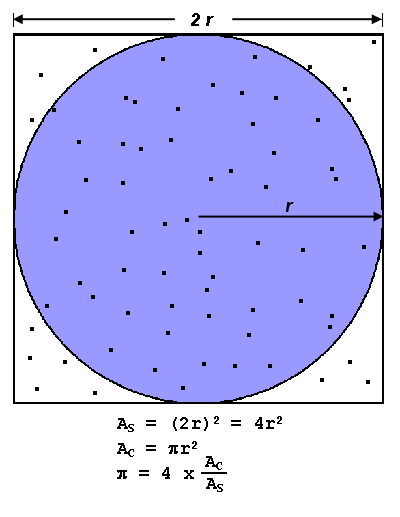
The program I decided to assess, and profile calculates the value of PI by using the approximation method called Monte Carlo. This works by having a circle that is 𝜋r2 and a square that is 4r2 with r being 1.0 and generating randomized points inside the area, both x and y being between -1 and 1 we keep track of how many points have been located inside the circle. The more points generated the more accurate the final calculation of PI will be. The amount of points needed for say billionth precision can easily reach in the hundreds of billions which would take just as many calculations of the same mathematical computation, which makes it a fantastic candidate to parallelize.
Figure 1

Figure 1: Graphical representation of the Monte Carlo method of approximating PI
Figure 2
| pi.cpp |
|---|
/*
	Author: Daniel Serpa
	Pseudo code: Blaise Barney (https://computing.llnl.gov/tutorials/parallel_comp/#ExamplesPI)
*/

#include <iostream>
#include <cstdlib>
#include <math.h>
#include <iomanip>

double calcPI(double);

int main(int argc, char ** argv) {
	if (argc != 2) {
		std::cout << "Invalid number of arguments" << std::endl;
		return 1;
	}
	std::srand(852);
	double npoints = atof(argv[1]);
	std::cout << "Number of points: " << npoints << std::endl;
	double PI = calcPI(npoints);
	std::cout << std::setprecision(10) << PI << std::endl;
	return 0;
}

double calcPI(double npoints) {
	double circle_count = 0.0;
	for (int j = 0; j < npoints; j++) {
		double x_coor = 2.0 * ((double)std::rand() / RAND_MAX) - 1.0;
		double y_coor = 2.0 * ((double)std::rand() / RAND_MAX) - 1.0;
		if (sqrt(pow(x_coor, 2) + pow(y_coor, 2)) < 1.0) circle_count += 1.0;
	}
	return 4.0*circle_count / npoints;
} |
Figure 2: Serial C++ program used for profiling of the Monte Carlo method of approximating PI
Compilation
Program is compiled using the command:gpp -O2 -g -pg -oapp pi.cppRunning
We will profile the program using 2 billion points
 > time app 2000000000
Number of points: 2e+09
3.14157

real    1m0.072s
user    0m59.268s
sys     0m0.018s
Profiling
Flat:
Each sample counts as 0.01 seconds.
  %   cumulative   self              self     total
 time   seconds   seconds    calls  Ts/call  Ts/call  name
100.80     34.61    34.61                             calcPI(double)
  0.00     34.61     0.00        1     0.00     0.00  _GLOBAL__sub_I_main
Call:
granularity: each sample hit covers 2 byte(s) for 0.03% of 34.61 seconds

index % time    self  children    called     name
                                                 <spontaneous>
[1]    100.0   34.61    0.00                 calcPI(double) [1]
-----------------------------------------------
                0.00    0.00       1/1           __libc_csu_init [16]
[9]      0.0    0.00    0.00       1         _GLOBAL__sub_I_main [9]
-----------------------------------------------

Index by function name

   [9] _GLOBAL__sub_I_main (pi.cpp) [1] calcPI(double)
Results
You need many billions of points and maybe even trillions to reach a high precision for the final result but using just 2 billion dots causes the program to take over 30 seconds to run. The most intensive part of the program is the loop which is what executes 2 billion times in my run of the program while profiling, which can all be parallelized. We can determine from the profiling that 100% of the time executing the program is spent in the loop but of course that is not possible so we will go with 99.9%, using a GTX 1080 as an example GPU which has 20 processors and each having 2048 threads, and using Amdahl's Law we can expect a speedup of 976.191 times
Assignment 2
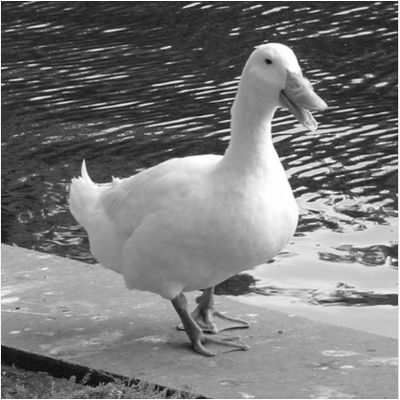
Beginning Information
Image used for all of the testing
Enlarge Image
__global__ void enlargeImg(int* a, int* b, int matrixSize, int growthVal, int imgCols, int enlargedCols) {
	int idx = blockIdx.x * blockDim.x + threadIdx.x;
	int x = idx / enlargedCols;
	int y = idx % enlargedCols;
	if (idx < matrixSize) {
		a[idx] = b[(x / growthVal) * imgCols + (y / growthVal)];
	}
}
Shrink Image
__global__ void shrinkImg(int* a, int* b, int matrixSize, int shrinkVal, int imgCols, int shrinkCols) {
	int idx = blockIdx.x * blockDim.x + threadIdx.x;
	int x = idx / shrinkCols;
	int y = idx % shrinkCols;
	if (idx < matrixSize) {
		a[idx] = b[(x / shrinkVal) * imgCols + (y / shrinkVal)];
	}
}
Reflect Image
// Reflect Image Horizontally
__global__ void reflectImgH(int* a, int* b, int rows, int cols) {
	int i = blockIdx.x * blockDim.x + threadIdx.x;
	int j = blockIdx.y * blockDim.y + threadIdx.y;
	//tempImage.pixelVal[rows - (i + 1)][j] = oldImage.pixelVal[i][j];
	a[j * cols + (rows - (i + 1))] = b[j * cols + i];

}

//Reflect Image Vertically
__global__ void reflectImgV(int* a, int* b, int rows, int cols) {
	int i = blockIdx.x * blockDim.x + threadIdx.x;
	int j = blockIdx.y * blockDim.y + threadIdx.y;
	//tempImage.pixelVal[i][cols - (j + 1)] = oldImage.pixelVal[i][j];
	a[(cols - (j + 1) * cols) + i] = b[j * cols + i];

}
Translate Image
__global__ void translateImg(int* a, int* b, int cols, int value) {
	int i = blockIdx.x * blockDim.x + threadIdx.x;
	int j = blockIdx.y * blockDim.y + threadIdx.y;

	//tempImage.pixelVal[i + value][j + value] = oldImage.pixelVal[i][j];
	a[(j-value) * cols + (i+value)] = b[j * cols + i];

}
Rotate Image
__global__ void rotateImg(int* a, int* b, int matrixSize, int imgCols, int imgRows, int r0, int c0, float rads) {
	int idx = blockIdx.x * blockDim.x + threadIdx.x;
	int r = idx / imgCols;
	int c = idx % imgCols;
	if (idx < matrixSize) {
		int r1 = (int)(r0 + ((r - r0) * cos(rads)) - ((c - c0) * sin(rads)));
		int c1 = (int)(c0 + ((r - r0) * sin(rads)) + ((c - c0) * cos(rads)));
		if (r1 >= imgRows || r1 < 0 || c1 >= imgCols || c1 < 0) {
		}
		else {
			a[c1 * imgCols + r1] = b[c * imgCols + r];
		}

	}
}

__global__ void rotateImgBlackFix(int* a, int imgCols) {
	int idx = blockIdx.x * blockDim.x + threadIdx.x;
	int r = idx / imgCols;
	int c = idx % imgCols;
	if (a[c * imgCols + r] == 0)
		a[c * imgCols + r] = a[(c + 1) * imgCols + r];
}
Negate Image
__global__ void negateImg(int* a, int* b, int matrixSize) {
	int matrixCol = blockIdx.x * blockDim.x + threadIdx.x;
	if(matrixCol < matrixSize)

