Difference between revisions of "GPU621/Code"
(→Intel® Advisor) |
(→Intel® Advisor) |
||
| Line 272: | Line 272: | ||
* Check Dependencies gives you a report on the errors and problems that thread are causing so that you can know where they are and fixing it. | * Check Dependencies gives you a report on the errors and problems that thread are causing so that you can know where they are and fixing it. | ||
| − | First step is to Collect the Survey Target report by clicking "Collect" | + | '''First step is to Collect the Survey Target report by clicking "Collect"''' |
| + | |||
[[File:Survey.png|250px]] | [[File:Survey.png|250px]] | ||
| + | |||
After Collecting the data for the report the following window will appear and there are 3 important things we should pay attention on | After Collecting the data for the report the following window will appear and there are 3 important things we should pay attention on | ||
| + | |||
[[File:Collectsurvey.png|900px]] | [[File:Collectsurvey.png|900px]] | ||
| + | |||
'''1 -''' Here display the list of the most important functions and loops which took a large part of the total program run time and tells a bit of information about them at the same time giving you some suggestions on how to improve it | '''1 -''' Here display the list of the most important functions and loops which took a large part of the total program run time and tells a bit of information about them at the same time giving you some suggestions on how to improve it | ||
| Line 285: | Line 289: | ||
* Source shows the actual code of the selected function call or loop selected from the #1 window | * Source shows the actual code of the selected function call or loop selected from the #1 window | ||
* Top Down shows all the run time of each calls and loop in your program which allows you to go more in detail with each of them | * Top Down shows all the run time of each calls and loop in your program which allows you to go more in detail with each of them | ||
| + | |||
[[File:Top_Down.png|700px]] | [[File:Top_Down.png|700px]] | ||
| − | '''3 -''' It is a dropdown list which shows you all the threads runned in this program which it is important | + | |
| + | '''3 -''' It is a dropdown list which shows you all the threads runned in this program which it is important in this case since we are focusing on debugging threads | ||
| + | |||
| + | |||
| + | '''Second step is running Check Dependecies''' | ||
| + | For running Check Dependecies we should select one of the function call or loop from the first step from the following window | ||
| + | |||
| + | |||
| + | [[File:Drop.png|800px]] | ||
| + | |||
| + | |||
| + | Pay attention to the black water drop which indicates me that I have selected a loop or function for Annotation. This means that part of the code will be inside of an Annotation range specially for the analysis. This is a new feature since before it did not exist and we would have to go into the source code and add the Annotation range for the part of the code which we would like to analyze. | ||
| + | |||
| + | |||
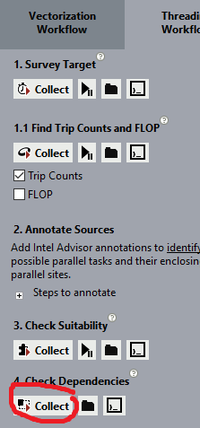
| + | After selecting the loop or function for Annotation we will proceed to start the Check Dependecies | ||
| + | |||
| + | |||
| + | [[File:Dependency.png|200px]] | ||
| + | |||
| + | |||
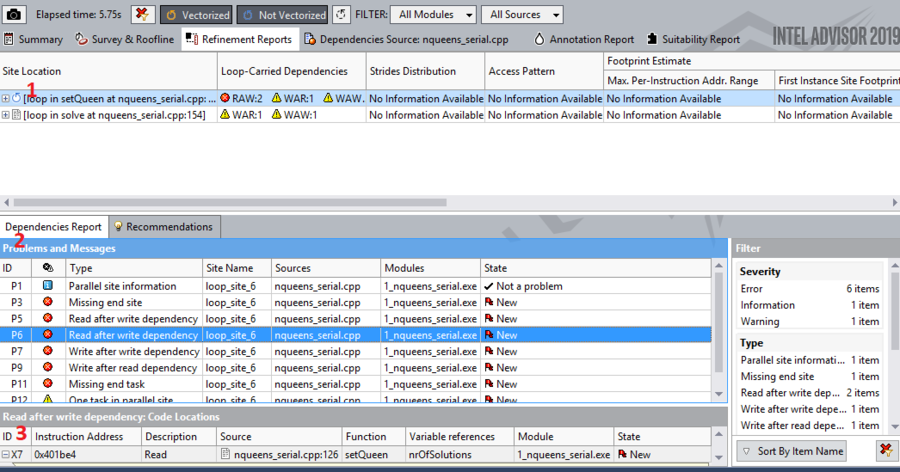
| + | Starting Check Dependencies will take a bit longer than running the program so be patient with it. After it is done the following window should appear. | ||
| + | |||
| + | |||
| + | [[File:No_lock.png|900px]] | ||
Revision as of 22:57, 27 November 2018
Contents
Debugging Threads in Intel Parallel Studio
Group Members
Intel® Parallel Studio XE
Intel Parallel Studio XE is a software development tool suite for compiling applications and optimizing performance with less effort.
The Intel C++ Compiler is not the only tool that comes with IPS XE 2019. It also includes next applications:
- Intel® Advisor
- Intel® Inspector
- Intel® VTune™ Amplifier
Let's take a quick look at each of them:
Intel® Advisor
Vectorization optimization and thread prototyping.
Use this tool in the vectorization and threading stages of the flow.
- Identify where it is safe to force compiler vectorization.
- Quickly find what's blocking vectorization capabilities.
- Use Threading Advisor to fast-track threading design.
- Delivers the data and tips you need to make faster design and optimization decisions.
Intel® Inspector
Memory and thread debugger.
Use this tool to find races, deadlocks, and illegal memory accesses.
- Locate root cause errors early―before you release
- Quickly debug intermittent races and deadlocks
Intel® VTune™ Amplifier
Performance profiler.
Use this tool in the threading and bandwidth optimization stages and for advanced vectorization optimization.
- Save money: Locate root cause errors early―before you release
- Save time: Quickly debug intermittent races and deadlocks
Intel Inspector
Intel Inspector is a dynamic memory and threading error checking instrument to inspect serial and multi-threaded programs.
Intel Inspector comes with Intel Parallel Studio XE along with two other debugging tools - VTune and Advisor.
Create a project
There are 2 ways to work with inspector.
- Run inspector directly from Visual Studio
This is the easiest and fastest way that requires no additional configurations.
- Run as a separate program.
Working with Intel Inspector application requires passing it a compiled version of your program. Additionally you may need to link some libraries (lib, dll, etc).
Configure a project
Intel suggests using small data set sizes and load threads with small chunks of work..
This will reduce run time and the speed of the analysis.
Choose analysis type
Inspector allows you to choose between predefined types of analysis.
Choose the type of Analysis using a drop-down menu (2):
- Memory error analysis
- Detect leaks
- Detect Memory problems
- Locate memory problems
- Threading error analysis
- Detect deadlocks
- Detect deadlocks and data races
- Locate deadlocks and data races
- Custom analysis types - users can create their own types based on selected preset type.
Use a slider (3) to select a predefined analysis type.
Types at the the top have smaller a scope but faster in execution;
Types at the the bottom have larger a scope but they are considerably slower;
Edit settings of the analysis in the settings section (4)
How it works
Inspector performs the analysis in multiple steps:
1. The program is executed
2. It identifies problems that may need to be resolved.
3. Gathers problems.
4. Converts symbol information into filenames and line numbers.
5. Applies suppression rules.
6. Removes duplicates.
7. Creates problem sets.
8. Opens a debugging session.
Interpreting results
After the analysis completes, IPS XE Inspector will show you information on 2 pages:
- Collection Log
Gives a general information about the execution of the program.
From there you can see the execution time, number of threads, the caller of threads, if they were active or not.
- Summary
The Summary window is divided into 4 parts:
1) Problems section.
It shows problems (if any found) that we asked the Inspector to look for.
It provides you with a name of the problem, the file where the problem is located, the executable module which contains it, and the state of problem (which changes when do you a rescan).
2) Filters (On the right side of the Problems section)
Gives the summary of all problems (Source files affected, total of problems by type, etc)
3) Code locations
When we select a problem, code locations will show a preview of a source file and highlights the line on which the problems was detected!
Moreover it shows the operation that is performed (Read, Write), including thread operations.
Source files can be opened and edited directly from the Inspector by double clicking the problem.
4) Timeline
Shows threads that involved at the certain step.
Memory leak problem : https://www.codeproject.com/Tips/1184749/Allocating-Memory-in-C-Cplusplus-How-to-Avoid-Memo
- Source
Shows source file and a call stack on different threads.
Intel VTune™ Amplifier
Introduction
Intel VTune amplifier is a analysis software that allows you the ability to measure performance of your serial or multithreaded program. VTune allows you to analyze the performance of your algorithms and multithreading. It can help with debugging threads by calculating overhead, finding bottlenecks or inefficiencies.
Create a project
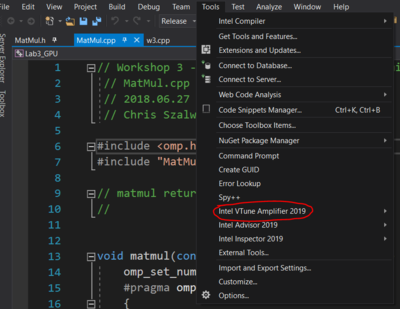
I will be explaining how to use VTune part Intel® Parallel Studio XE 2019 of the alongside Visual Studio 2017. Intel® Parallel Studio XE can be found here: https://software.intel.com/en-us/parallel-studio-xe. Once installed you will be able to find VTune in the tools tab inside Visual Studio.
Configure a project
When you hover over Intel VTune Amplifier 2019 in the tool’s menu. You will see more options appear. Select configure Analysis.
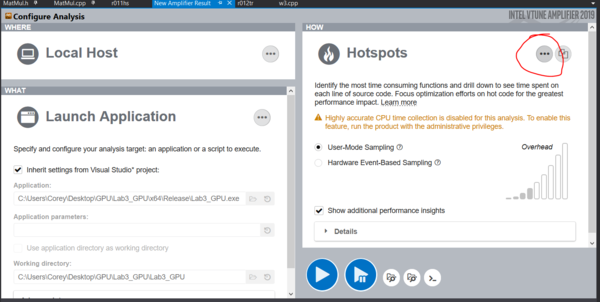
The following screen will be displayed. Click on the three little dots circled in the below picture. To expand more options for running VTune.
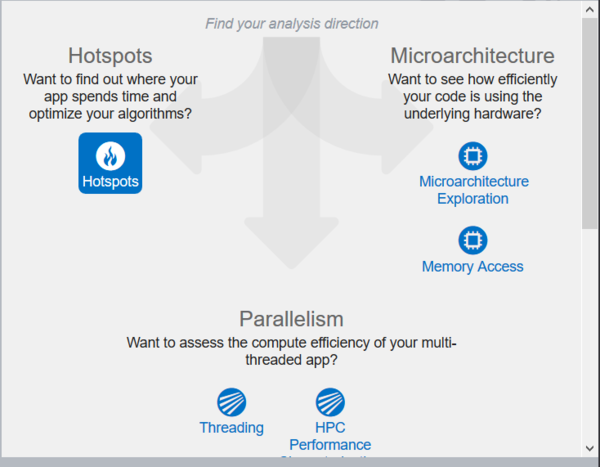
This menu will appear, it contains different tests that you can run against your program. The I am going to look through is the default test Hotspots. Depending on your program you may want too to look into the other options.
How it works
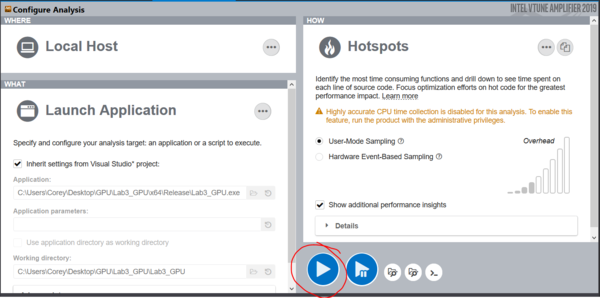
On the main page we can run the test, by clicking on the blue play button.
When the test completes, the summary page will be displayed. This will outline the results from the test.
Interpreting results
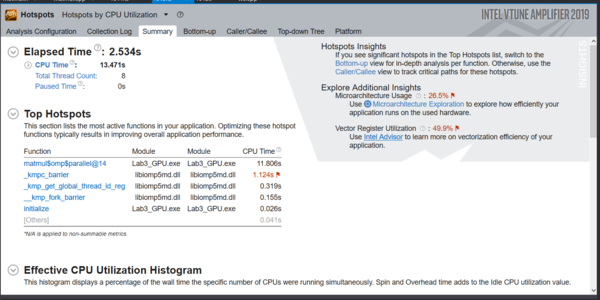
The following picture is the different tabs available from a hotspot analysis.
- Analysis configuration
- Main configuration page for VTune
- Collection log
- Logs from the analysis
- Summary
- Elapsed Time: this is the amount of time your program took to run
- The CPU time: displays the effective, spin and overhead times.
- Top Hotspots: Displays the area’s that were most active in your program.
- Effective CPU Utilization Histogram: This shows the time your program spent using x number of threads. The graph shows x axis is the moments that your program was a certain number of threads. And the y axis is the time that your program used that number of threads for.
- Collection and Platform Info: this display’s all the hardware information about the computer the test was run on.
- Elapsed Time: this is the amount of time your program took to run
- Bottom-up
- Allows you to se the call stack of a function starting from the first call.
- Caller/Callee
- Allows you to see details on each function and see callers and callees for each function
- Top-down tree
- Shows the call stack of the program as a tree starting from the top.
- Platform
- Displays the time and the utilization of each thread.
Intel® Advisor
Intel® Advisor gives software architects and developers the data and analysis tools they need to build well-threaded and vectorized code that exploits modern hardware capabilities.
Create a project
First of all you need to have Intel parallel XE installed on your machine it will allows you to have access to tools such as Intel Advisor, Vtune Amplifier and Inspector on top of your Visual Studio window.
Lets start by creating a project on Visual Studio, I am using a sample code from Intel Advisor folder which they provide different samples for you to test the functionality of it. They can be found under <Your-Installed-Directory>\IntelSWTools\Advisor 2019\samples\en. After choosing your project build the solution and look the following Icon from the image below
Configure the project
Before starting to play around with Intel Advisor, I encourage to set the optimazation of your project to O2 since it will speed up the analysis process on Intel Advisor which can be found under Debug > Properties > C/C++ > Optimization > Optimization > Maximize Speed (/O2)
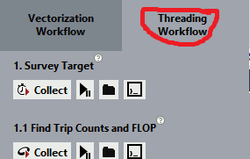
Now, you can see from the left side of Intel Advisor window Vectorization Workflow and Threading Workflow. I will be guiding you on how to debug Thread using this tool so click on Threading Workflow
How it works
For debugging Thread purpose we will have to run 2 analysis report in Intel Advisor - Threading Workflow pane: Survey Target and Check Dependencies.
- Survey Target gives you a report on how the threads are behaving and its run time on different calls so that you can try to improve it.
- Check Dependencies gives you a report on the errors and problems that thread are causing so that you can know where they are and fixing it.
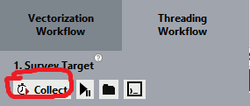
First step is to Collect the Survey Target report by clicking "Collect"
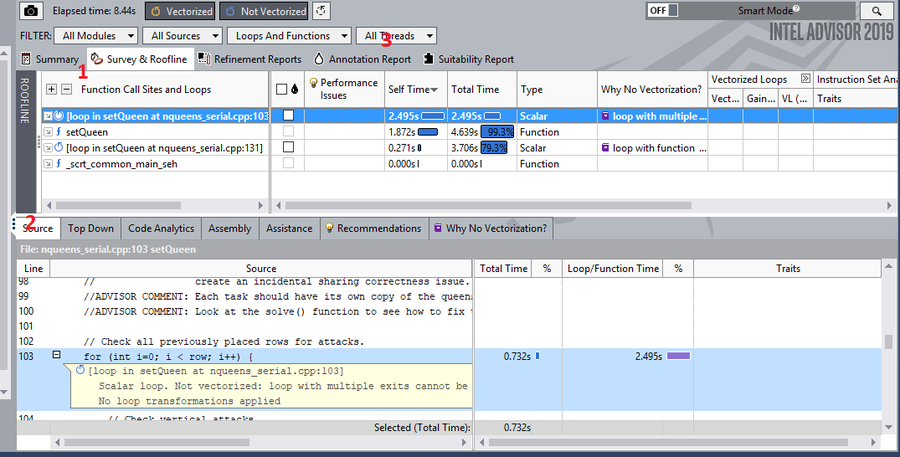
After Collecting the data for the report the following window will appear and there are 3 important things we should pay attention on
1 - Here display the list of the most important functions and loops which took a large part of the total program run time and tells a bit of information about them at the same time giving you some suggestions on how to improve it
2 - In this menu bar there are several options but the most important two are Source and Top Down.
- Source shows the actual code of the selected function call or loop selected from the #1 window
- Top Down shows all the run time of each calls and loop in your program which allows you to go more in detail with each of them
3 - It is a dropdown list which shows you all the threads runned in this program which it is important in this case since we are focusing on debugging threads
Second step is running Check Dependecies
For running Check Dependecies we should select one of the function call or loop from the first step from the following window
Pay attention to the black water drop which indicates me that I have selected a loop or function for Annotation. This means that part of the code will be inside of an Annotation range specially for the analysis. This is a new feature since before it did not exist and we would have to go into the source code and add the Annotation range for the part of the code which we would like to analyze.
After selecting the loop or function for Annotation we will proceed to start the Check Dependecies
Starting Check Dependencies will take a bit longer than running the program so be patient with it. After it is done the following window should appear.
