Difference between revisions of "GPU621/Debugging OpenMP"
(→Multiple Processes) |
(→Group Members) |
||
| (28 intermediate revisions by 3 users not shown) | |||
| Line 3: | Line 3: | ||
# [mailto:sali263@myseneca.ca?subject=GPU621 Sami Ali] | # [mailto:sali263@myseneca.ca?subject=GPU621 Sami Ali] | ||
# [mailto:lliu170@myseneca.ca?subject=GPU621 Leon Liu] | # [mailto:lliu170@myseneca.ca?subject=GPU621 Leon Liu] | ||
| − | |||
| − | |||
| − | |||
| − | |||
| − | |||
| − | |||
| − | |||
| − | |||
| − | |||
| − | |||
| − | |||
| − | |||
| − | |||
| − | |||
| − | |||
| − | |||
| − | |||
| − | |||
= Process and Thread = | = Process and Thread = | ||
| Line 41: | Line 23: | ||
=== Setup === | === Setup === | ||
| + | |||
| + | ==== Startup Project ==== | ||
To set the startup project or multiple projects: | To set the startup project or multiple projects: | ||
| − | + | # Right-click the solution in the Solution Explorer and select Properties. | |
| − | + | # In the Properties window, select Common Properties > Startup Project. | |
| − | + | # Here you can change the Startup Project to either the currently selected project, a single startup project (this is selected by default), or multiple startup projects. | |
| − | + | ## When selecting Multiple startup projects, you can modify the execution order and action for each project between Start, Start without debugging, or None. | |
| − | + | # Save your settings by selected Apply or OK. | |
| + | |||
| + | [[File:Startup-settings.png]] | ||
| + | |||
| + | ==== Command Scope ==== | ||
| + | |||
| + | When debugging with multiple processes, the break, step, and continue debugger commands will affect all processes by default. This can have unintended consequences when debugging. To gain more control over the targets, you can and should change these settings. You can do so by going to Tools (or Debug) > Options > Debugging > General, and clearing the checkbox '''Break all processes when one process breaks'''. | ||
| + | |||
| + | [[File:Break-processes.png]] | ||
| + | |||
| + | ==== Attach to Process ==== | ||
| + | |||
| + | The Visual Studio debugger has the capability to attach to applications running in processes outside of Visual Studio locally and remotely. This is useful as you are able to debug external applications that are already built. You can use the debugger while attached to a separate app, though some features may be limited. To attach to a running process: | ||
| + | |||
| + | # With the app and Visual Studio running, select Debug > Attach to Process. | ||
| + | # Select the desired process from the list and select Attach. | ||
| + | ## If you have multiple identical processes, use the w3wp process details or Command Line column to identify the correct process to use. | ||
| + | ## In the '''Attach to''' field, change the setting to Automatic to the specific type if necessary. Automatic will work for most applications. | ||
| + | |||
| + | [[File:Attach-to-process.png]] | ||
| + | |||
| + | Keep in mind that Visual Studio will not attach to any child process spawned by the debugged process. You will have to manually attach it to the new child. | ||
| + | |||
| + | ==== Registry Editor ==== | ||
| + | |||
| + | The Windows Registry Editor can be used to automatically start a process in the debugger. This will allow you to debug the startup code for an app that is launched by another process, such as Windows services. | ||
| + | |||
| + | # Start the Windows Registry Editor by running regedit.exe from the run window (Windows + R). | ||
| + | # In the Registry Editor, go to HKEY_LOCAL_MACHINE\SOFTWARE\Microsoft\Windows NT\CurrentVersion\Image File Execution Options. | ||
| + | # Select the folder of the app to start in the debugger. | ||
| + | ## If the app isn't listed, right-click Image File Execution Options, select New > Key, and enter the application's name. | ||
| + | # Right-click the new key in the tree and select New > String Value. | ||
| + | # Change the name of the new value from ''New Value #1'' to <code>debugger</code>. | ||
| + | # Right-click the new value and select Modify. Change the value data to <code>vsjitdebugger.exe</code> and select OK. | ||
| + | # In the Edit String dialog box, enter <code>vsjitdebugger.exe</code> in the Value data box, and then select OK. | ||
| + | |||
| + | === Debugging === | ||
| + | |||
| + | ==== Switching Between Processes ==== | ||
| + | |||
| + | While you've done all this work to be able to use multiple processes, only one process can be debugged at a time. You will need to break all processes in order to switch between processes. There are two ways to set the current process: | ||
| + | |||
| + | # Open the Debug Location toolbar through View > Toolbars > Debug Location. | ||
| + | # While you are debugging, select the process to set on the Debug Location toolbar. | ||
| + | |||
| + | [[File:Processes-window.png]] | ||
| + | |||
| + | The other method is to use the processes window. | ||
| + | |||
| + | # While you are debugging, open the processes window through Debug > Windows > Processes. | ||
| + | # Double-click the process you want to set as the current process. The current active process is marked by a yellow arrow. | ||
| + | |||
| + | You can now start debugging multiple processes with Visual Studio! You can break, step, and continue processes independent of each other, as well as being able to switch between multiple active processes in your solution. The next step is to familiarize yourself with the Visual Studio parallelization user interface. | ||
| + | |||
| + | === Stopping Debugging === | ||
| + | |||
| + | When you stop debugging, the process is ended by default. This will detach the debugger from any attached applications if necessary and then end the process. This will keep the previously attached process running. You can change this default setting by right-clicking the process in the Processes window and clearing the '''Detach when debugging stopped''' option. | ||
= User Interface = | = User Interface = | ||
| − | + | Primary tools include: | |
| + | * Attach to Process Dialog | ||
| + | * Process Window | ||
| + | * Debug Location Bar | ||
| − | + | Tools in debugging threads include: | |
| + | * Thread Windows | ||
| + | * Thread Markers in Source Windows | ||
| + | * Parallel Stacks Window | ||
| + | * Debug Location Toolbar | ||
| + | * Tasks Window | ||
| + | * GPU Threads Window | ||
== Attach to Process Dialog Box == | == Attach to Process Dialog Box == | ||
| + | |||
| + | In Attach to Process Dialog Box, you can attach: | ||
| + | * Process name | ||
| + | * Session number | ||
| + | * Menubar Title | ||
| + | * Process ID number | ||
| + | * Type (Managed v4.0; Managed v2.0, v1.1, v1.0; x86; x64; IA64) | ||
| + | * User Name | ||
| + | |||
| + | Actions you can perform include Select a process to attach to, Select a remote computer, and Change transport type for connecting to remote computers | ||
| + | |||
| + | |||
== Process Window == | == Process Window == | ||
| + | |||
| + | Processes you can attach include: | ||
| + | * Process Name | ||
| + | * Process ID number | ||
| + | * Path to process .exe | ||
| + | * Menubar Title | ||
| + | * State (Break. Running) | ||
| + | * Debugging (Native, Managed, and so on.) | ||
| + | * Transport type (default, native with no authentication) | ||
| + | * Transport Qualifier (remote computer) | ||
| + | |||
| + | Tools include: | ||
| + | * Attach | ||
| + | * Detach | ||
| + | * Terminate | ||
== Thread Window == | == Thread Window == | ||
| + | |||
| + | Thread Window is a tool in Visual Studio that allows you to manage and monitor your program's threads during debugging. | ||
| + | |||
| + | It can be set up by adding breakpoints in your program in order to examine it's activity. | ||
| + | |||
| + | This is done by right-clicking the desired line and choose the Breakpoint option. | ||
| + | |||
| + | ====How to use breakpoints==== | ||
| + | |||
| + | You can use this by going to Debug -> Windows -> Threads, or by pressing CTRL + ALT + H | ||
| + | |||
| + | This will allow the execution to stop at your breakpoints. | ||
| + | |||
| + | Thread Window allows any kind of usage, it has multiple columns which present multiple fields of data. | ||
| + | |||
| + | These fields include: | ||
| + | |||
| + | * Flag: Indicates which threads the user wants to pay special attention to | ||
| + | |||
| + | * Current Thread: Current thread would be indicated by an arrow. | ||
| + | |||
| + | * ID: Shows a thread's identification number. | ||
| + | |||
| + | * Managed ID: Shows managed identification numbers. | ||
| + | |||
| + | * Category: Displays a thread's category, for example: User Interface Threads, Remote Call Procedure Handlers, or Worker Threads. | ||
| + | |||
| + | * Name: Identifies each thread by name. | ||
| + | |||
| + | * Location: Displays the location threads run. | ||
| + | |||
| + | * Priority: Shows the precedence assigned to a specific thread by the system, which is hidden by default. | ||
| + | |||
| + | * Affinity Mask: Displays the affinity mask for a thread. Affinity mask directs which processors a thread can run on, which is hidden by default. | ||
| + | |||
| + | * Suspended Count: This determines if a thread can run, which is hidden by default. | ||
| + | |||
| + | * Process Name: Shows the thread's process name, which is hidden by default. | ||
| + | |||
| + | * Process ID: Shows the thread's process ID, which is hidden by default. | ||
| + | |||
| + | * Transport Qualifier: Helps identify which machine the debugger is connected to. | ||
| + | |||
== Source Window == | == Source Window == | ||
| + | |||
| + | The Source Window is used to display source code. | ||
| + | |||
| + | ====How to set it up==== | ||
| + | It can be set up by pressing F5, which starts debug. This will allow it to show up automatically. | ||
| + | |||
| + | If the window is closed, it can be opened by double-clicking any linked items or the filename in the project pane. | ||
| + | |||
| + | ====How to use it==== | ||
| + | There is an icon named "Show Threads in Source" near the top of the window that is off, turn it on. | ||
| + | |||
| + | Another way you can turn it on is by right-clicking the menu on the thread window. | ||
| + | |||
| + | In the window's gutter, there is a thread icon that displays the current working threads. Details can be shown by hovering your mouse over it. | ||
| + | |||
| + | You can add or remove breakpoints from here. | ||
== Debug Location Window == | == Debug Location Window == | ||
| + | |||
| + | The Debug Location Window allows you to set the active or current processes. | ||
| + | |||
| + | ====Options include:==== | ||
| + | |||
| + | *Current process | ||
| + | |||
| + | *Suspend the application | ||
| + | |||
| + | *Resume the application | ||
| + | |||
| + | *Suspend and shut down the application | ||
| + | |||
| + | *Current thread | ||
| + | |||
| + | *Toggle current thread flag state | ||
| + | |||
| + | *Show only flagged threads | ||
| + | |||
| + | *Show only current process | ||
| + | |||
| + | *Current stack frame | ||
| + | |||
| + | ====Which allows you to perform:==== | ||
| + | |||
| + | *Switch to another process | ||
| + | |||
| + | *Suspend, resume, or shut down the application | ||
| + | |||
| + | *Switch to another thread in current process | ||
| + | |||
| + | *Switch to another stack frame in current thread | ||
| + | |||
| + | *Flag or unflag current threads | ||
| + | |||
| + | *Show only flagged threads | ||
| + | |||
| + | *Show only the current process | ||
== Parallel Stacks Window == | == Parallel Stacks Window == | ||
| + | You can call stack information for your threads with Parallel Stacks Window, you can also focus on different threads and see the stack frames for those threads aswell. | ||
| + | |||
| + | ====How to set it up==== | ||
| + | |||
| + | * Click Debug -> Windows -> Parallel Stacks | ||
| + | * Detailed version can be accessed by going to Debug -> Options, go to Debugging -> General and uncheck "Enable just my code". Then go to Debugging -> Symbols and check "Microsoft Symbol Servers", which will allow the stack frames to be more descriptive. | ||
| + | |||
| + | ====How to use it==== | ||
| + | |||
| + | Parallel Stacks Window will show all of the threads that point within the program at every breakpoint you reach. It will also include their call stacks. | ||
| + | |||
| + | An example of the Threads Window and it's corresponding Parallel Stacks Window: | ||
| + | |||
| + | [[File:750px-Parallelstacks-threadsview.png]] [[File:750px-Parallelstacks-stacksview.png]] | ||
== Parallel Tasks Window == | == Parallel Tasks Window == | ||
| + | |||
| + | ====How to set it up==== | ||
| + | |||
| + | Go to "Call Stack" by going to Debug -> Windows, you can also open "Thread" through Debug -> Windows. | ||
| + | |||
| + | ====How to use it==== | ||
| + | |||
| + | Every task displays a specific ID, if you select this ID, you can access the specific methods the task is passing. To go to the next breakpoint, you press "Continue", to freeze a task, you can rick-click. | ||
| + | |||
| + | ====Features==== | ||
| + | |||
| + | Users can determine the Thread Assignment of each specific task. | ||
| + | Users have the ability to see the status of each specific task. | ||
== Parallel Watch Window == | == Parallel Watch Window == | ||
| + | |||
| + | The user can watch a thread and it's specific variables with Parallel Watch Window. This is done by organizing the columns in the way you want. | ||
| + | |||
| + | ====How to set it up==== | ||
| + | |||
| + | You can set it up by setting a breakpoint at a line of your interest, then you can debug by pressing F5 and going to Debug -> Windows -> Parallel Watch. | ||
| + | |||
| + | ====How to use it==== | ||
| + | |||
| + | Variables can be selected to be put on parallel watch by the user, it will show the value in all the steps for active threads. | ||
| + | |||
| + | ====Features==== | ||
| + | |||
| + | Users have the ability to freeze or unfreeze a thread, this allows you to work on other threads while pausing on a specific one you do not want to currently work on. | ||
= Walkthrough = | = Walkthrough = | ||
| − | |||
| − | // | + | === Environment === |
| + | |||
| + | ==== IDE ==== | ||
| + | |||
| + | * Microsoft Visual Studio 2019 | ||
| + | |||
| + | ==== Compiler ==== | ||
| + | |||
| + | * Intel oneAPI DPC++/C++ | ||
| + | |||
| + | |||
| + | === Sample Code === | ||
| + | |||
| + | <syntaxhighlight lang="cpp"> | ||
| + | #include <stdio.h> | ||
| + | #include <omp.h> | ||
| + | |||
| + | int main(int argc, char** argv) { | ||
| + | int partial_Sum, total_Sum; | ||
| + | |||
| + | #pragma omp parallel private(partial_Sum) shared(total_Sum) | ||
| + | { | ||
| + | partial_Sum = 0; | ||
| + | total_Sum = 0; | ||
| + | |||
| + | #pragma omp for | ||
| + | { | ||
| + | for (int i = 1; i <= 1000; i++) { | ||
| + | partial_Sum += i; | ||
| + | } | ||
| + | } | ||
| + | |||
| + | //Create thread safe region. | ||
| + | #pragma omp critical | ||
| + | { | ||
| + | //add each threads partial sum to the total sum | ||
| + | total_Sum += partial_Sum; | ||
| + | } | ||
| + | } | ||
| + | printf("Total Sum : % d\n", total_Sum); | ||
| + | return 0; | ||
| + | } | ||
| + | </syntaxhighlight> | ||
| + | |||
| + | |||
| + | === Configuration === | ||
| + | |||
| + | * Enable OpenMP for the current project file | ||
| + | |||
| + | '''Project''' - '''Property''' - '''C/C++''' - '''Language [Intel C++]''' - '''OpenMP Support''' - '''Generate Parallel Code (/Qiopenmp)''' | ||
| + | |||
| + | [[File: config.png]] | ||
| + | |||
| + | |||
| + | === Output === | ||
| + | |||
| + | * The output of the sample program | ||
| + | |||
| + | [[File: walkthrouth_output.png]] | ||
| − | |||
== Case A: Using the Thread Window == | == Case A: Using the Thread Window == | ||
| − | |||
| − | + | === Serial Region === | |
| + | [[File: walkthrouth_serial.png]] | ||
| + | |||
| + | |||
| + | * When one of the breakpoints is reached and the debugger stops at the serial region, only the main thread exists | ||
| + | |||
| + | |||
| + | [[File: walkthrough_serial2.png]] | ||
| + | |||
| + | |||
| + | === Parallel Region === | ||
| + | |||
| + | [[File: walkthrough_parallel.png]] | ||
| + | |||
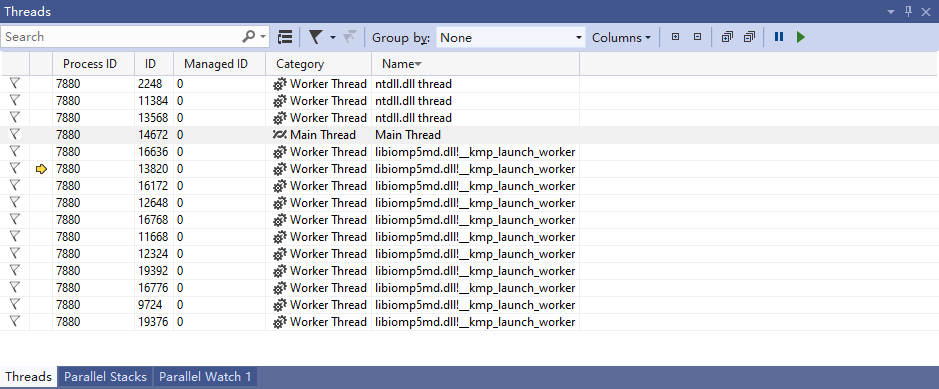
| + | |||
| + | * When one of the breakpoints is reached and the debugger stops at a parallel region, all threads are listed in the Thread window. (including main & worker threads) | ||
| + | |||
| + | |||
| + | [[File: walkthrough_parallel2.png]] | ||
| + | |||
| + | |||
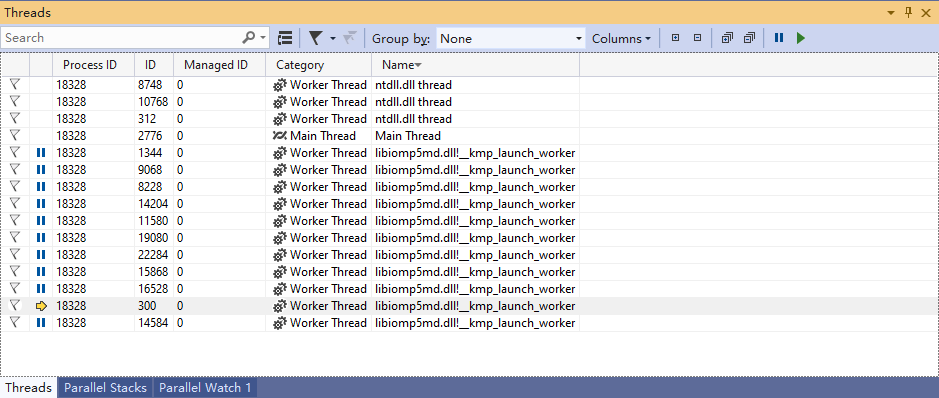
| + | === Freeze Feature === | ||
| + | |||
| + | * All threads can be frozen (including the main thread) so that the programmer can check the status of one specific thread | ||
| + | * Frozen thread can also be thawed at any time to make it back into service | ||
| + | |||
| + | |||
| + | [[File: freeze.png]] | ||
| + | |||
| + | |||
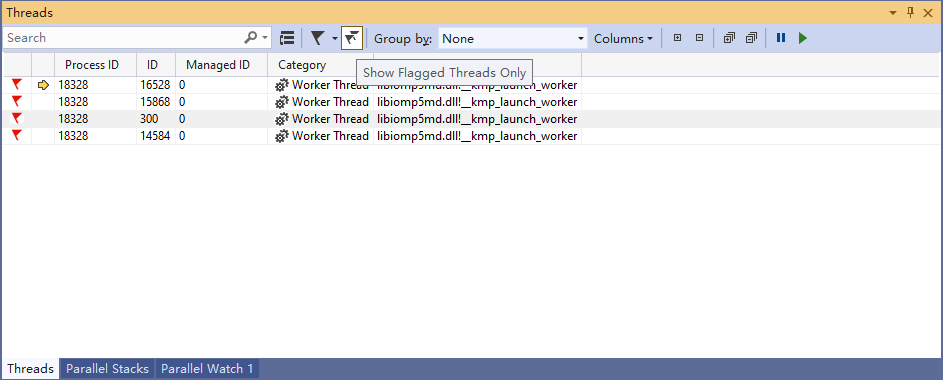
| + | === Flag Feature === | ||
| + | |||
| + | * All threads can be flagged in order to filter the list in the Threads window | ||
| + | * It is quite useful when there are too many threads | ||
| + | * By clicking `Show Flagged Threads Only`, only threads that are marked will be displayed | ||
| + | |||
| + | |||
| + | [[File: flag.png]] | ||
| + | |||
| + | |||
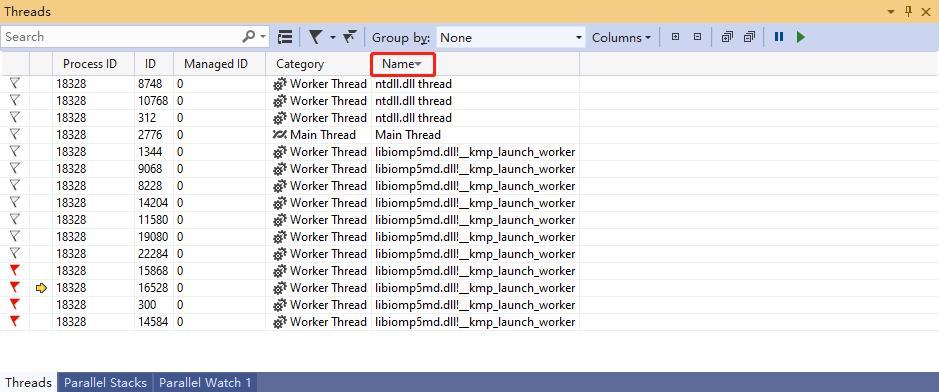
| + | === Search & Sort === | ||
| + | |||
| + | *A specific thread can be searched using the Search bar located at the upper left corner | ||
| + | |||
| + | |||
| + | [[File: search.png]] | ||
| + | |||
| + | |||
| + | *By clicking the title of each column, existing threads can be sorted based on the selected column | ||
| + | |||
| + | |||
| + | [[File: sort.png]] | ||
| + | |||
| + | |||
| + | |||
| + | |||
== Case B: Using the Parallel Stacks Window == | == Case B: Using the Parallel Stacks Window == | ||
| − | + | ||
| + | |||
| + | === Start Execution Until the 1st Breakpoint === | ||
| + | |||
| + | When the program stops at the first break point, only the main thread exists in Parallel Stacks Window | ||
| + | |||
| + | |||
| + | [[File: 1stExe.png]] | ||
| + | |||
| + | |||
| + | === Resume Execution Until the 2nd Breakpoint === | ||
| + | |||
| + | * The Parallel Stacks Window reveals the current status of all threads in the program | ||
| + | * There are 2 Threads that come from `ntdll.dll`, which is a runtime library that we don't really care here | ||
| + | * There are 2 threads that are ahead of other worker threads | ||
| + | ** They have reached the barrier (`__kmp_linear_barrier_release_template` & `__kmp_yield`) | ||
| + | * There are 8 threads that are ready to move on | ||
| + | |||
| + | |||
| + | [[File: 2nd.png]] | ||
| + | |||
| + | |||
| + | === Resume Execution Until the 3rd Breakpoint === | ||
| + | |||
| + | * When reaches the 3rd break point, Thanks to `#pragma omp critical`, all threads are waiting, trying to pass their result to main | ||
| + | * As shown in the picture, there are 11 threads are ready to pass their values | ||
| + | ** They are either in the current thread or in the waiting list (`__kmp_wait_4` / `__kmp_yield`) | ||
| + | * According to the code, we know that there will be 11 threads passing their calculated results to the main thread | ||
| + | * At this point, the value of `total_Sum` is 0 | ||
| + | |||
| + | |||
| + | [[File: 3rd.png]] | ||
| + | |||
| + | |||
| + | === Resume Execution Until the 4th Breakpoint === | ||
| + | |||
| + | |||
| + | * When the program reaches this step, all calculations have been completed | ||
| + | * As can be seen in the figure, all worker threads have reached `__kmp_linear_barrier_release_template` | ||
| + | * This means that their work is done | ||
| + | * And we can see that the result of the program is correct | ||
| + | |||
| + | |||
| + | [[File: 4th.png]] | ||
| + | |||
| + | |||
| + | === Resume Execution Until the Last Breakpoint === | ||
| + | |||
| + | |||
| + | * When the program ends, all threads are terminated and the program returns to only one main thread | ||
| − | |||
| − | + | [[File: 5th.png]] | |
Latest revision as of 15:19, 30 November 2022
Contents
- 1 Group Members
- 2 Process and Thread
- 3 User Interface
- 4 Walkthrough
Group Members
Process and Thread
Process
A process is an instance of a program executed by the computer. Processes are started when programs are initiated, and they can be comprised of one or more threads.
On Windows operating systems, you can look at your running processes on the Task Manager.
Thread
A single thread is a set of instructions that the CPU schedules and executes independently. A process consists of one or more threads which are able to be run concurrently. This forms the basis of multithreading.
Multiple Processes
Background
Visual Studio supports the creation of solutions with multiple processes. Visual Studio's debugger will by default run the first project (selected in bold), but this can be changed in the Solution Explorer by right-clicking on a different project and selecting Set as Startup Project. This will allow you when debugging to switch between processes, as well as break, stop, and continue currently debugging processes.
Setup
Startup Project
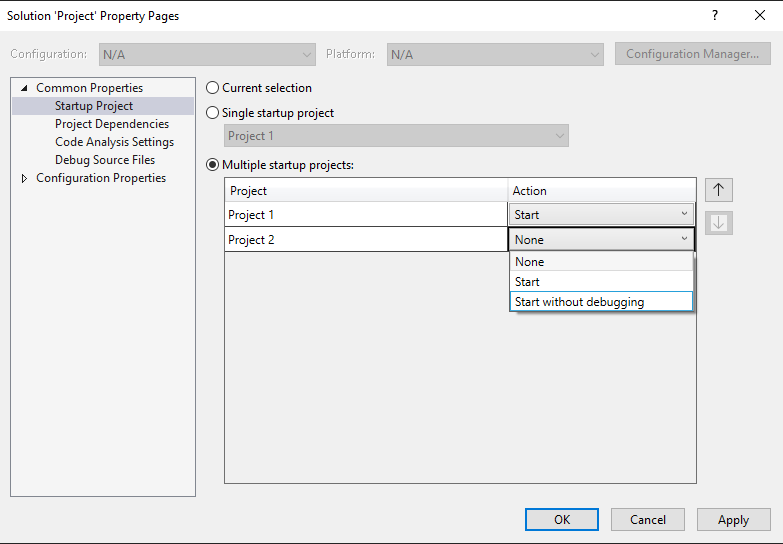
To set the startup project or multiple projects:
- Right-click the solution in the Solution Explorer and select Properties.
- In the Properties window, select Common Properties > Startup Project.
- Here you can change the Startup Project to either the currently selected project, a single startup project (this is selected by default), or multiple startup projects.
- When selecting Multiple startup projects, you can modify the execution order and action for each project between Start, Start without debugging, or None.
- Save your settings by selected Apply or OK.
Command Scope
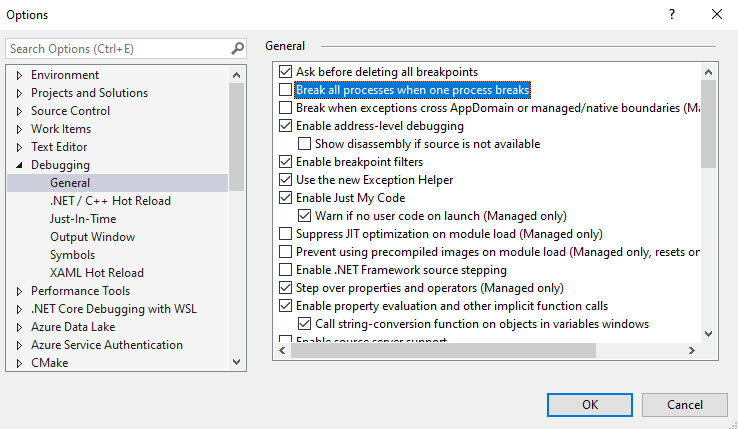
When debugging with multiple processes, the break, step, and continue debugger commands will affect all processes by default. This can have unintended consequences when debugging. To gain more control over the targets, you can and should change these settings. You can do so by going to Tools (or Debug) > Options > Debugging > General, and clearing the checkbox Break all processes when one process breaks.
Attach to Process
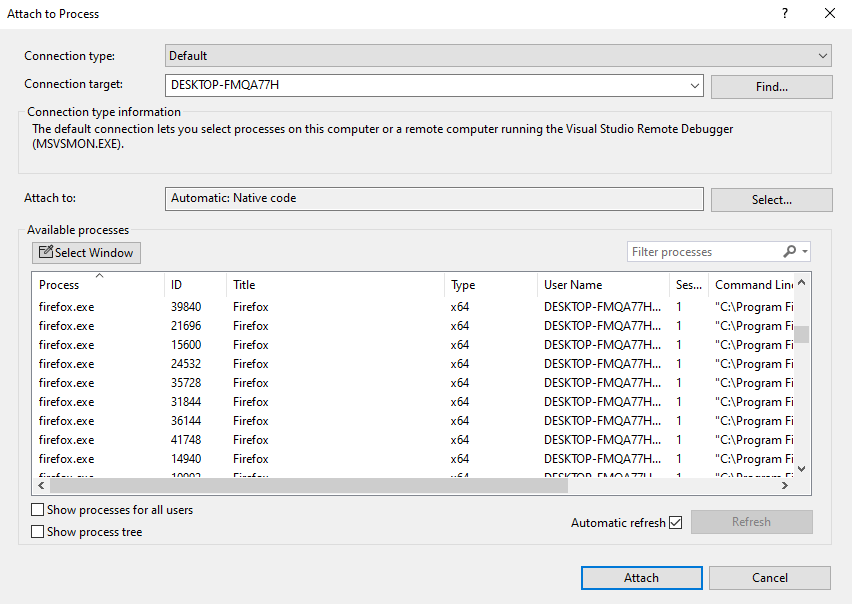
The Visual Studio debugger has the capability to attach to applications running in processes outside of Visual Studio locally and remotely. This is useful as you are able to debug external applications that are already built. You can use the debugger while attached to a separate app, though some features may be limited. To attach to a running process:
- With the app and Visual Studio running, select Debug > Attach to Process.
- Select the desired process from the list and select Attach.
- If you have multiple identical processes, use the w3wp process details or Command Line column to identify the correct process to use.
- In the Attach to field, change the setting to Automatic to the specific type if necessary. Automatic will work for most applications.
Keep in mind that Visual Studio will not attach to any child process spawned by the debugged process. You will have to manually attach it to the new child.
Registry Editor
The Windows Registry Editor can be used to automatically start a process in the debugger. This will allow you to debug the startup code for an app that is launched by another process, such as Windows services.
- Start the Windows Registry Editor by running regedit.exe from the run window (Windows + R).
- In the Registry Editor, go to HKEY_LOCAL_MACHINE\SOFTWARE\Microsoft\Windows NT\CurrentVersion\Image File Execution Options.
- Select the folder of the app to start in the debugger.
- If the app isn't listed, right-click Image File Execution Options, select New > Key, and enter the application's name.
- Right-click the new key in the tree and select New > String Value.
- Change the name of the new value from New Value #1 to
debugger. - Right-click the new value and select Modify. Change the value data to
vsjitdebugger.exeand select OK. - In the Edit String dialog box, enter
vsjitdebugger.exein the Value data box, and then select OK.
Debugging
Switching Between Processes
While you've done all this work to be able to use multiple processes, only one process can be debugged at a time. You will need to break all processes in order to switch between processes. There are two ways to set the current process:
- Open the Debug Location toolbar through View > Toolbars > Debug Location.
- While you are debugging, select the process to set on the Debug Location toolbar.
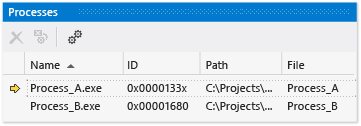
The other method is to use the processes window.
- While you are debugging, open the processes window through Debug > Windows > Processes.
- Double-click the process you want to set as the current process. The current active process is marked by a yellow arrow.
You can now start debugging multiple processes with Visual Studio! You can break, step, and continue processes independent of each other, as well as being able to switch between multiple active processes in your solution. The next step is to familiarize yourself with the Visual Studio parallelization user interface.
Stopping Debugging
When you stop debugging, the process is ended by default. This will detach the debugger from any attached applications if necessary and then end the process. This will keep the previously attached process running. You can change this default setting by right-clicking the process in the Processes window and clearing the Detach when debugging stopped option.
User Interface
Primary tools include:
- Attach to Process Dialog
- Process Window
- Debug Location Bar
Tools in debugging threads include:
- Thread Windows
- Thread Markers in Source Windows
- Parallel Stacks Window
- Debug Location Toolbar
- Tasks Window
- GPU Threads Window
Attach to Process Dialog Box
In Attach to Process Dialog Box, you can attach:
- Process name
- Session number
- Menubar Title
- Process ID number
- Type (Managed v4.0; Managed v2.0, v1.1, v1.0; x86; x64; IA64)
- User Name
Actions you can perform include Select a process to attach to, Select a remote computer, and Change transport type for connecting to remote computers
Process Window
Processes you can attach include:
- Process Name
- Process ID number
- Path to process .exe
- Menubar Title
- State (Break. Running)
- Debugging (Native, Managed, and so on.)
- Transport type (default, native with no authentication)
- Transport Qualifier (remote computer)
Tools include:
- Attach
- Detach
- Terminate
Thread Window
Thread Window is a tool in Visual Studio that allows you to manage and monitor your program's threads during debugging.
It can be set up by adding breakpoints in your program in order to examine it's activity.
This is done by right-clicking the desired line and choose the Breakpoint option.
How to use breakpoints
You can use this by going to Debug -> Windows -> Threads, or by pressing CTRL + ALT + H
This will allow the execution to stop at your breakpoints.
Thread Window allows any kind of usage, it has multiple columns which present multiple fields of data.
These fields include:
- Flag: Indicates which threads the user wants to pay special attention to
- Current Thread: Current thread would be indicated by an arrow.
- ID: Shows a thread's identification number.
- Managed ID: Shows managed identification numbers.
- Category: Displays a thread's category, for example: User Interface Threads, Remote Call Procedure Handlers, or Worker Threads.
- Name: Identifies each thread by name.
- Location: Displays the location threads run.
- Priority: Shows the precedence assigned to a specific thread by the system, which is hidden by default.
- Affinity Mask: Displays the affinity mask for a thread. Affinity mask directs which processors a thread can run on, which is hidden by default.
- Suspended Count: This determines if a thread can run, which is hidden by default.
- Process Name: Shows the thread's process name, which is hidden by default.
- Process ID: Shows the thread's process ID, which is hidden by default.
- Transport Qualifier: Helps identify which machine the debugger is connected to.
Source Window
The Source Window is used to display source code.
How to set it up
It can be set up by pressing F5, which starts debug. This will allow it to show up automatically.
If the window is closed, it can be opened by double-clicking any linked items or the filename in the project pane.
How to use it
There is an icon named "Show Threads in Source" near the top of the window that is off, turn it on.
Another way you can turn it on is by right-clicking the menu on the thread window.
In the window's gutter, there is a thread icon that displays the current working threads. Details can be shown by hovering your mouse over it.
You can add or remove breakpoints from here.
Debug Location Window
The Debug Location Window allows you to set the active or current processes.
Options include:
- Current process
- Suspend the application
- Resume the application
- Suspend and shut down the application
- Current thread
- Toggle current thread flag state
- Show only flagged threads
- Show only current process
- Current stack frame
Which allows you to perform:
- Switch to another process
- Suspend, resume, or shut down the application
- Switch to another thread in current process
- Switch to another stack frame in current thread
- Flag or unflag current threads
- Show only flagged threads
- Show only the current process
Parallel Stacks Window
You can call stack information for your threads with Parallel Stacks Window, you can also focus on different threads and see the stack frames for those threads aswell.
How to set it up
- Click Debug -> Windows -> Parallel Stacks
- Detailed version can be accessed by going to Debug -> Options, go to Debugging -> General and uncheck "Enable just my code". Then go to Debugging -> Symbols and check "Microsoft Symbol Servers", which will allow the stack frames to be more descriptive.
How to use it
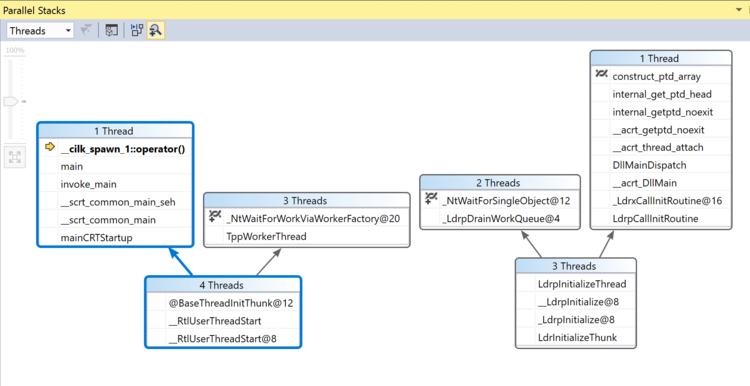
Parallel Stacks Window will show all of the threads that point within the program at every breakpoint you reach. It will also include their call stacks.
An example of the Threads Window and it's corresponding Parallel Stacks Window:
Parallel Tasks Window
How to set it up
Go to "Call Stack" by going to Debug -> Windows, you can also open "Thread" through Debug -> Windows.
How to use it
Every task displays a specific ID, if you select this ID, you can access the specific methods the task is passing. To go to the next breakpoint, you press "Continue", to freeze a task, you can rick-click.
Features
Users can determine the Thread Assignment of each specific task. Users have the ability to see the status of each specific task.
Parallel Watch Window
The user can watch a thread and it's specific variables with Parallel Watch Window. This is done by organizing the columns in the way you want.
How to set it up
You can set it up by setting a breakpoint at a line of your interest, then you can debug by pressing F5 and going to Debug -> Windows -> Parallel Watch.
How to use it
Variables can be selected to be put on parallel watch by the user, it will show the value in all the steps for active threads.
Features
Users have the ability to freeze or unfreeze a thread, this allows you to work on other threads while pausing on a specific one you do not want to currently work on.
Walkthrough
Environment
IDE
- Microsoft Visual Studio 2019
Compiler
- Intel oneAPI DPC++/C++
Sample Code
#include <stdio.h>
#include <omp.h>

int main(int argc, char** argv) {
    int partial_Sum, total_Sum;

#pragma omp parallel private(partial_Sum) shared(total_Sum)
    {
        partial_Sum = 0;
        total_Sum = 0;

#pragma omp for
        {
            for (int i = 1; i <= 1000; i++) {
                partial_Sum += i;
            }
        }

        //Create thread safe region.
#pragma omp critical
        {
            //add each threads partial sum to the total sum
            total_Sum += partial_Sum;
        }
    }
    printf("Total Sum : % d\n", total_Sum);
    return 0;
}
Configuration
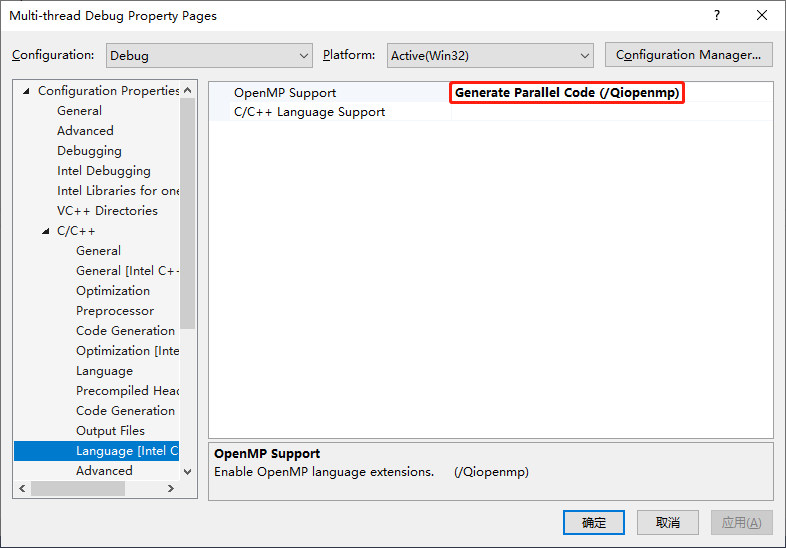
- Enable OpenMP for the current project file
Project - Property - C/C++ - Language [Intel C++] - OpenMP Support - Generate Parallel Code (/Qiopenmp)
Output
- The output of the sample program
Case A: Using the Thread Window
Serial Region
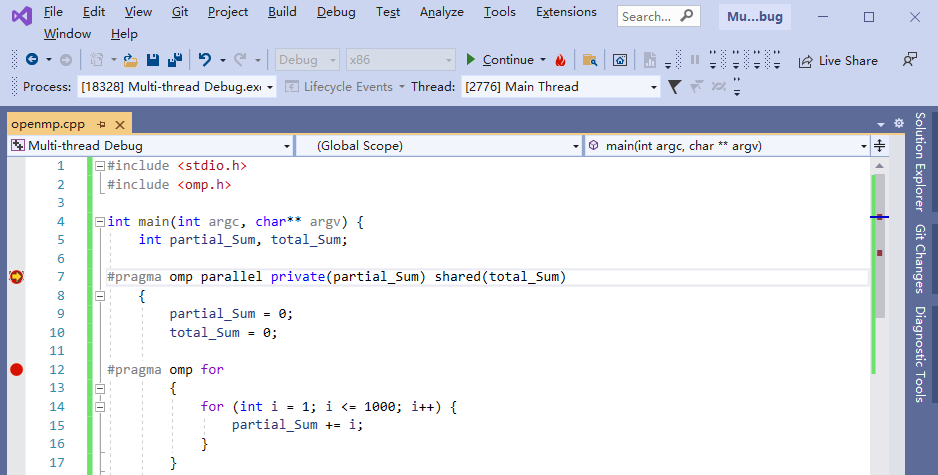
- When one of the breakpoints is reached and the debugger stops at the serial region, only the main thread exists
Parallel Region
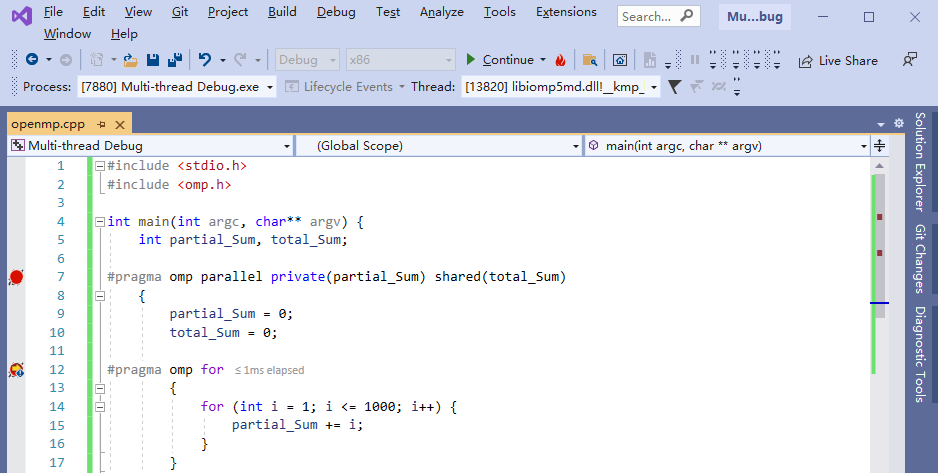
- When one of the breakpoints is reached and the debugger stops at a parallel region, all threads are listed in the Thread window. (including main & worker threads)
Freeze Feature
- All threads can be frozen (including the main thread) so that the programmer can check the status of one specific thread
- Frozen thread can also be thawed at any time to make it back into service
Flag Feature
- All threads can be flagged in order to filter the list in the Threads window
- It is quite useful when there are too many threads
- By clicking `Show Flagged Threads Only`, only threads that are marked will be displayed
Search & Sort
- A specific thread can be searched using the Search bar located at the upper left corner
- By clicking the title of each column, existing threads can be sorted based on the selected column
Case B: Using the Parallel Stacks Window
Start Execution Until the 1st Breakpoint
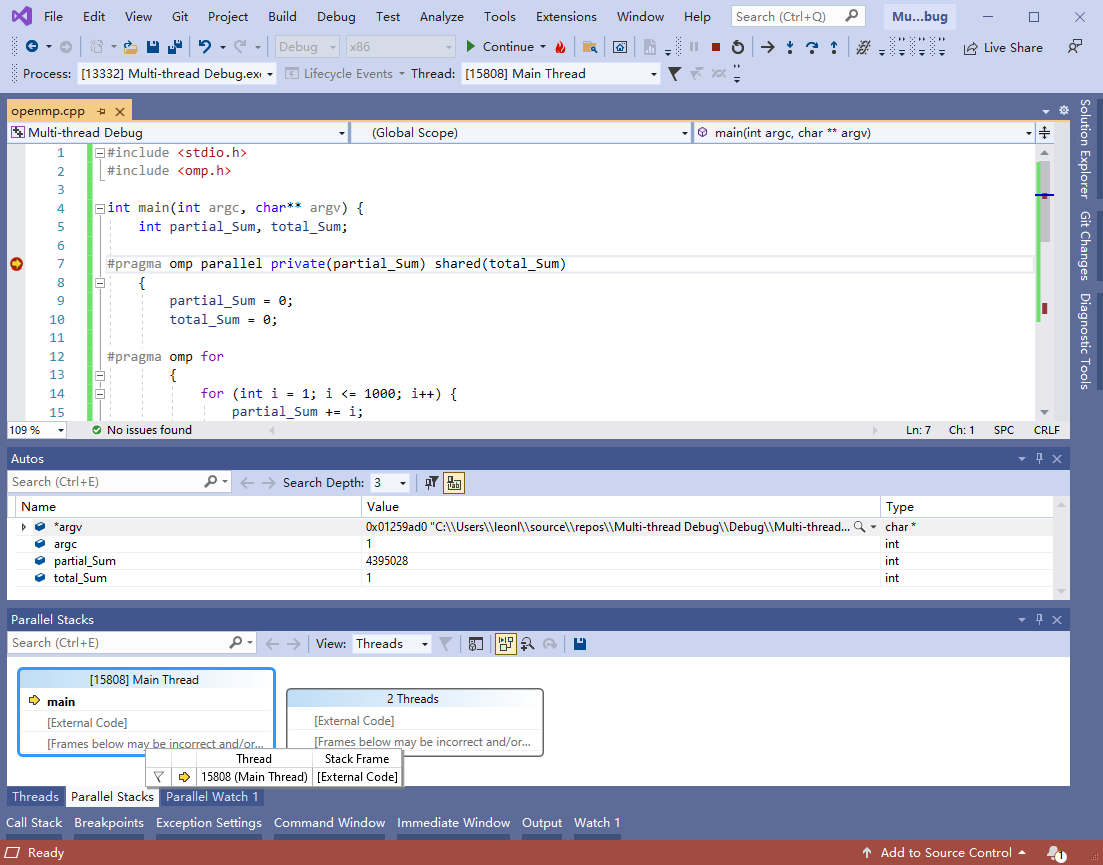
When the program stops at the first break point, only the main thread exists in Parallel Stacks Window
Resume Execution Until the 2nd Breakpoint
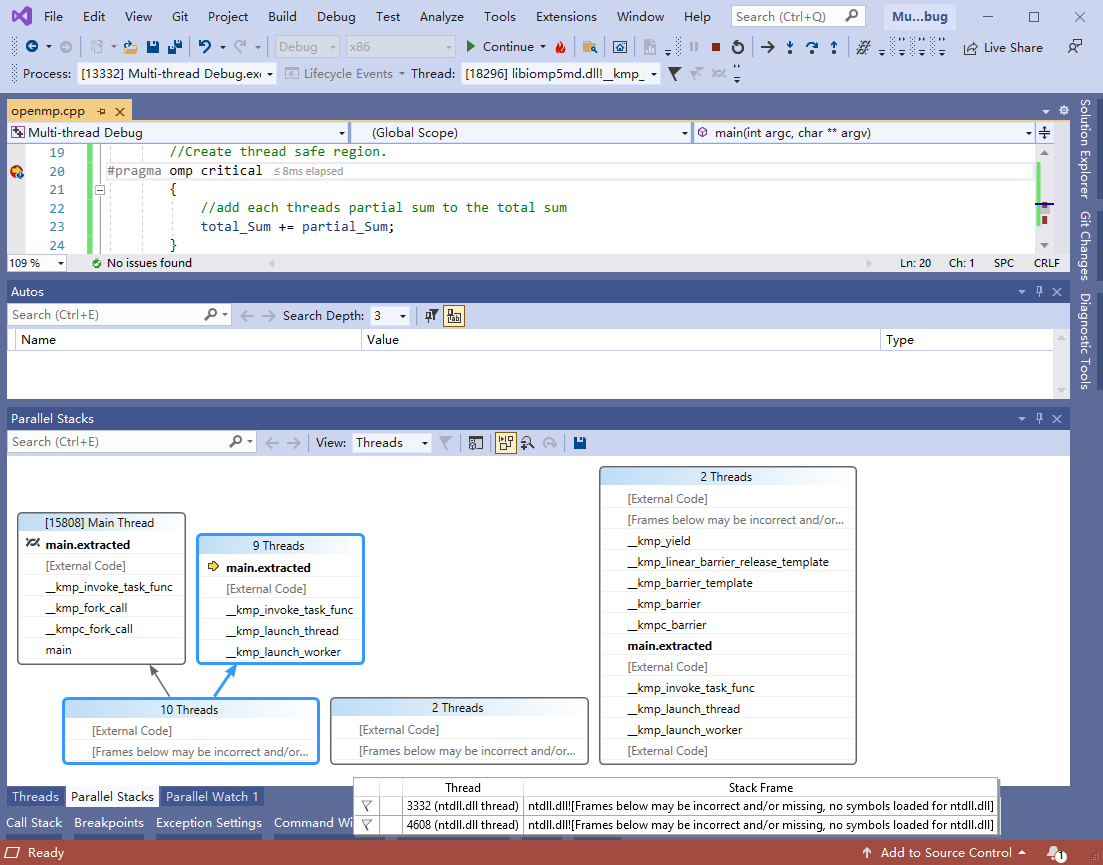
- The Parallel Stacks Window reveals the current status of all threads in the program
- There are 2 Threads that come from `ntdll.dll`, which is a runtime library that we don't really care here
- There are 2 threads that are ahead of other worker threads
- They have reached the barrier (`__kmp_linear_barrier_release_template` & `__kmp_yield`)
- There are 8 threads that are ready to move on
Resume Execution Until the 3rd Breakpoint
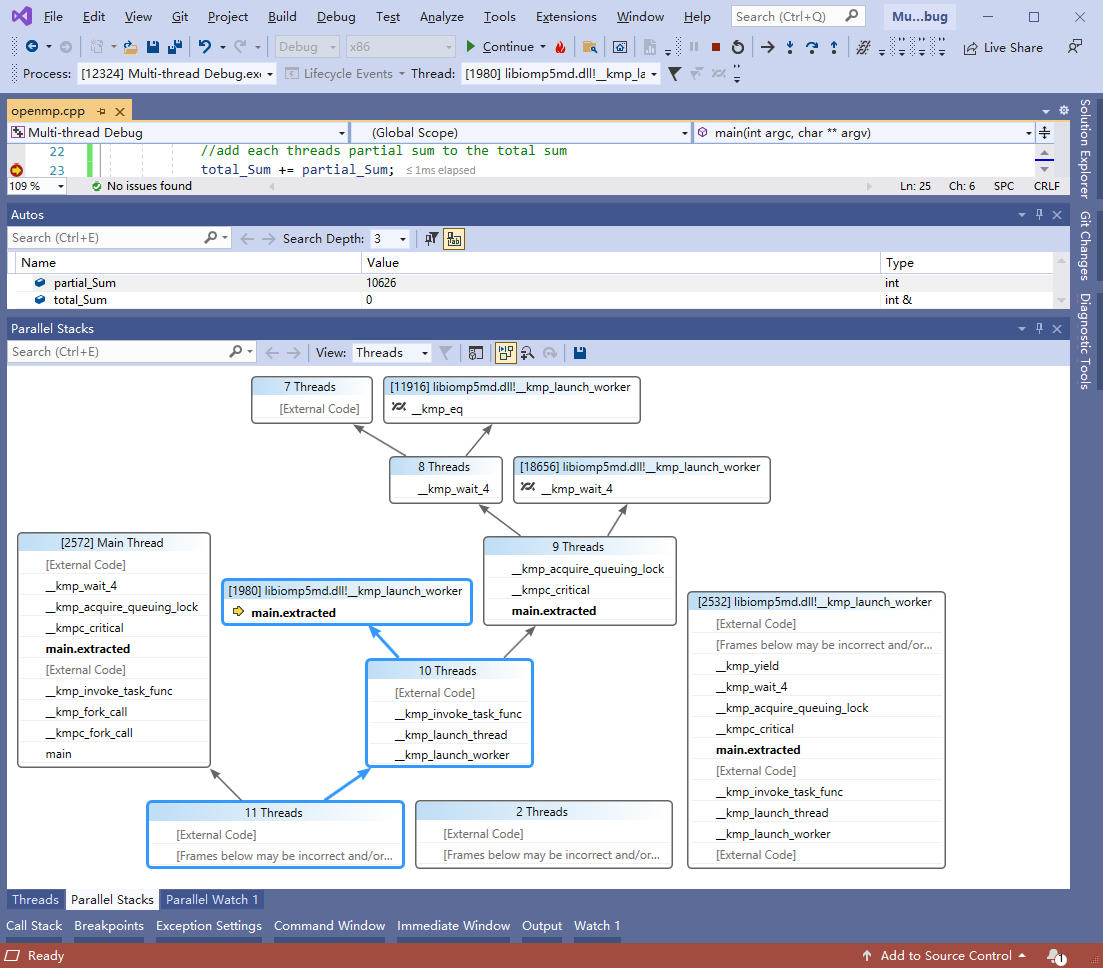
- When reaches the 3rd break point, Thanks to `#pragma omp critical`, all threads are waiting, trying to pass their result to main
- As shown in the picture, there are 11 threads are ready to pass their values
- They are either in the current thread or in the waiting list (`__kmp_wait_4` / `__kmp_yield`)
- According to the code, we know that there will be 11 threads passing their calculated results to the main thread
- At this point, the value of `total_Sum` is 0
Resume Execution Until the 4th Breakpoint
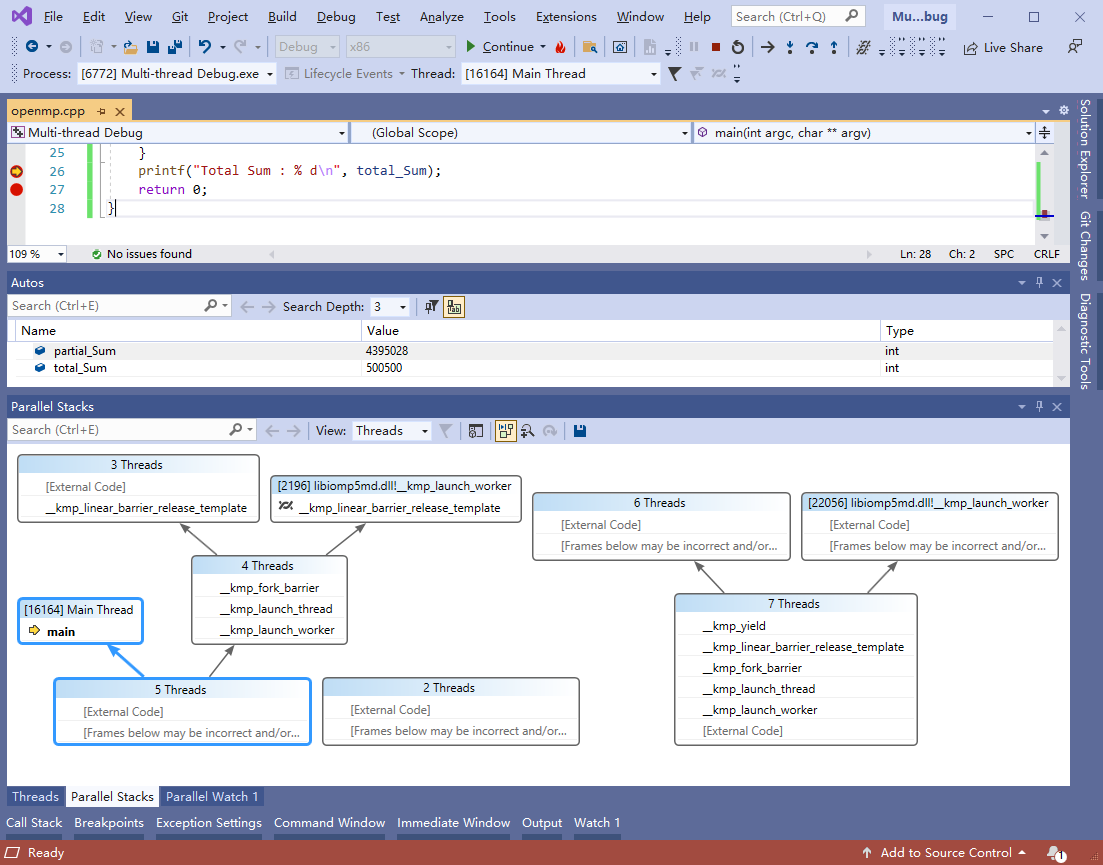
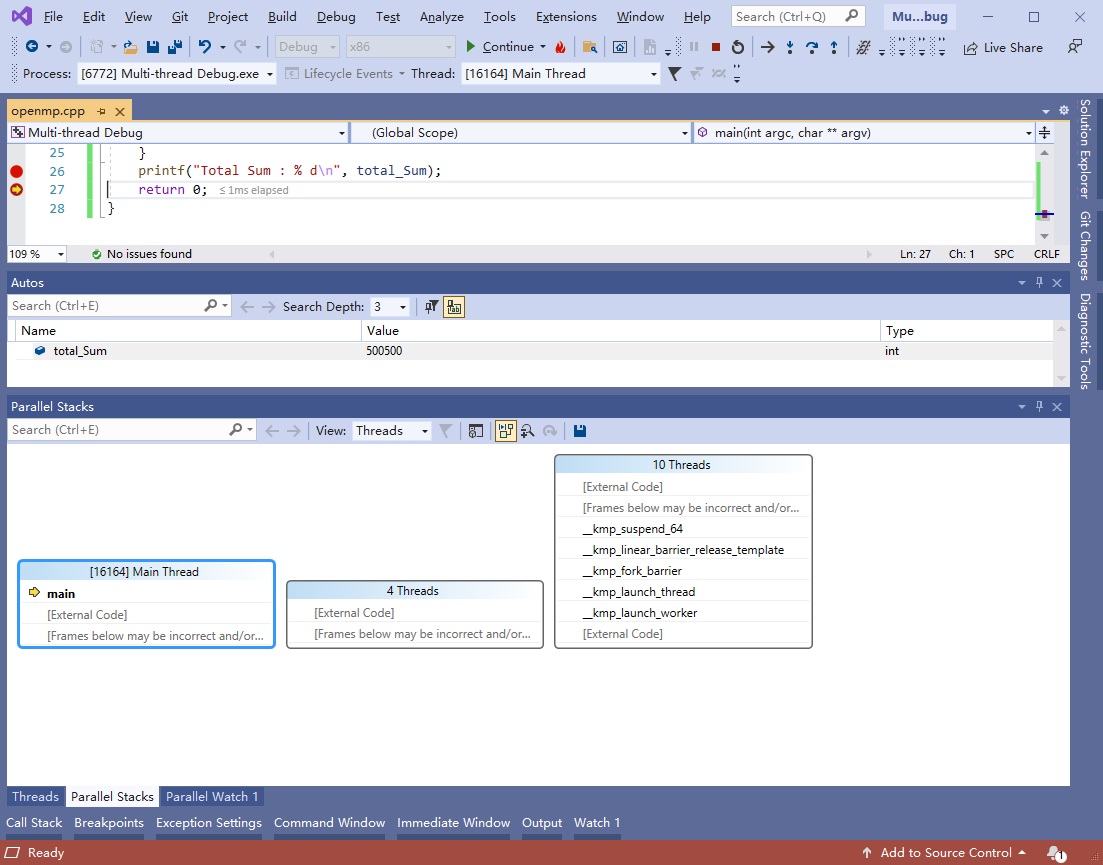
- When the program reaches this step, all calculations have been completed
- As can be seen in the figure, all worker threads have reached `__kmp_linear_barrier_release_template`
- This means that their work is done
- And we can see that the result of the program is correct
Resume Execution Until the Last Breakpoint
- When the program ends, all threads are terminated and the program returns to only one main thread
