Difference between revisions of "GPU621/Jedd Clan"
Jchionglo1 (talk | contribs) |
Jchionglo1 (talk | contribs) (→Data Management) |
||
| (32 intermediate revisions by the same user not shown) | |||
| Line 4: | Line 4: | ||
== Group Members == | == Group Members == | ||
| − | Jedd Chionglo | + | *Jedd Chionglo |
| − | Gabriel Dizon | + | *Gabriel Dizon |
| + | |||
| + | == Background == | ||
| + | The Intel® Data Analytics Acceleration Library (DAAT) is used by data scientists to help analyze big data and solve their problems. This is due to the nature of the data which is becoming too large, fast, or complex to process using the traditional means. Recently data sources are becoming more complex compared to traditional data, in some cases they’re being driven by artificial intelligence, the Internet of Things, and our mobile devices. This is because the data coming from devices, sensors, web and social media, and log files are being generated at a large scale and in real time. | ||
| + | Intel has launched their oneDAL library on December 2020 and the intial DAAL library was made on August 25, 2020. It is bundled with the intel oneAPI Base Toolkit and is compatible with Windows, Linux and Mac and also uses C++, python, Java, etc. | ||
| + | To install the Intel DAAL library follow the [https://software.intel.com/en-us/get-started-with-daal-for-linux instructions]. | ||
== Features == | == Features == | ||
| Line 20: | Line 25: | ||
*Researchers | *Researchers | ||
*Data Analysts | *Data Analysts | ||
| + | |||
| + | == Data Analytics Pipeline == | ||
| + | The Intel® Data Analytics Acceleration Library (DAAT) is used by data scientists to help analyze big data and solve their problems. This is due to the nature of the data which is becoming too large, fast, or complex to process using the traditional means. Recently data sources are becoming more complex compared to traditional data, in some cases they’re being driven by artificial intelligence, the Internet of Things, and our mobile devices. This is because the data coming from devices, sensors, web and social media, and log files are being generated at a large scale and in real time. | ||
| + | *The Intel® Data Analytics Acceleration Library provides optimized building blocks for the various stages of data analysis | ||
| + | [[File:DataAnalyticsStages.jpg | 900px]] | ||
| + | |||
| + | == Data Management == | ||
| + | Data management refers to a set of operations that work on the data and are distributed between the stages of the data analytics pipeline. The data management flow is shown in the figure below. You start with your raw data and its acquisition. The first step is to transfer the out of memory data, the source could be from files, databases, or remote storage, into an in-memory representation. | ||
| + | Once it’s inside memory you can then prepare the data in many ways. DAAL offers support of various in-memory data formats such as an array of structures or compressed-sparse-row format, you can also convert data into a numeric representation, filter data and perform data normalization, compute various statistical metrics for numerical data such as the mean, variance, and covariance, and also compress and decompress the data. | ||
| + | The third step is to stream the in-memory numerical data to the algorithm | ||
| + | In complex usage scenarios the data ends up going through these three stages back and forth, so for example if your data isn’t fully available at the start of the computation it can be sent in chunks which is an advantage of DAAL. | ||
| + | *Raw Data Acquisition | ||
| + | *Data preperation | ||
| + | *Algorithim computation | ||
| + | |||
| + | [[File:ManagemenFlowDal.jpg|900px]] <br/> | ||
| + | |||
| + | |||
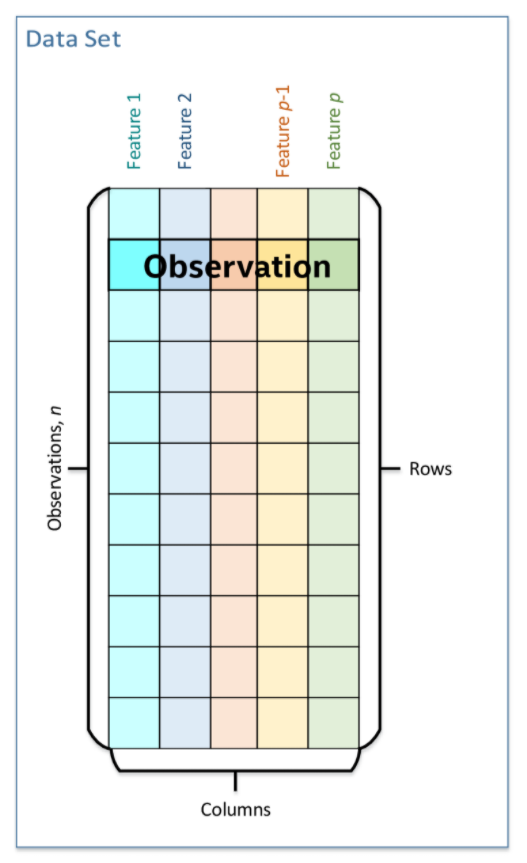
| + | This is a tabular view of data where the columns represent features, these are properties or qualities of a real object or event, and the table rows represent observations which are feature vectors that are used to encode information for a real object or event. This is used in our machine learning regression example. | ||
| + | The data set is used across all stages of the data analytics pipeline, during acquisition it’s downloaded into local memory, during preparation it’s converted to a numerical representation, and during computation it’s used with an algorithm as an input or result.<br/> | ||
| + | |||
| + | [[File:DataSet.jpg]]<br/> | ||
| + | |||
| + | == Building Blocks == | ||
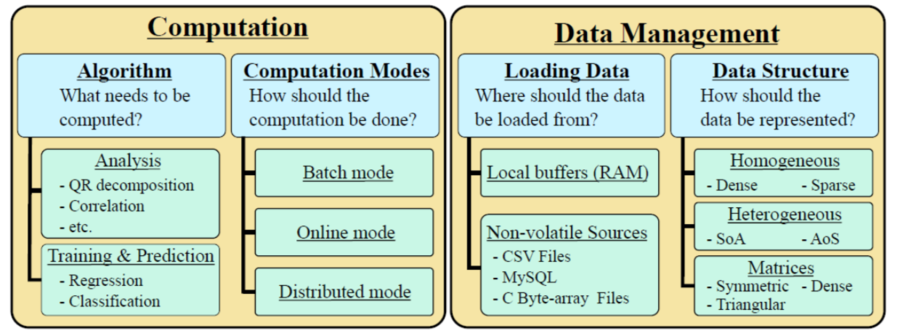
| + | DAAL provides building blocks which helps with aspects of data analytics from the tools used for managing data to computational algorithms. | ||
| + | *DAAL helps with aspects of data analytics from the tools used for managing data to computational algorithms | ||
| + | |||
| + | [[File:BuildingBlocks.jpg | 900px]] | ||
| + | |||
| + | == Computations == | ||
| + | *Must choose an algorithm for the application | ||
| + | *Below are the different types of algorithms that DAAL currently has for analysis training and prediction | ||
| + | [[File:Algorithims.jpg | 900px]] | ||
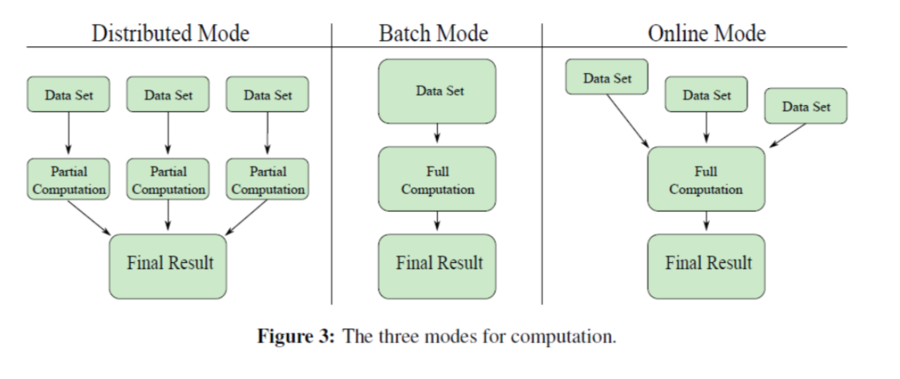
| + | *Modes of Computation | ||
| + | **Batch Mode - simplest mode uses a single data set | ||
| + | **Online Mode - multiple training sets | ||
| + | ** Distributed Mode - computation of partial results and supports multiple data sets | ||
| + | [[File:ComputationMode.jpg | 900px]] | ||
| + | |||
| + | == How To Use Intel DAAL == | ||
| + | In the example below we will show how to use the basics of the intel DAAL library. | ||
| + | The example looks at the hydrodynamics of yachts and builds a predictive model based on that information. | ||
| + | It uses linear regression to extrapolate the data based on the training algorithm and predictive modelling, | ||
| + | more specifically it uses polynomial regression. This will show how to load data, call loaded data, create a training model based on the information, | ||
| + | show how to use the trained model for predictions, apply implementations to the model and then finally test the quality of the data. | ||
| + | |||
| + | == How To Load Data == | ||
| + | Intel DAAL requires the use of numeric tables as inputs there are three different types of tables: | ||
| + | * Heterogenous - contains multiple data types | ||
| + | * Homogeneous - only one data type | ||
| + | * Matrices - used when matrix algebra is needed | ||
| + | The information can be loaded offline using two different methods: | ||
| + | |||
| + | Arrays | ||
| + | <source lang=c++> | ||
| + | // Array containing the data | ||
| + | const int nRows = 100; | ||
| + | const int nCols = 100; | ||
| + | double* rawData = (double*) malloc(sizeof(double)*nRows*nCols); | ||
| + | |||
| + | // Creating the numeric table | ||
| + | NumericTable* dataTable = new HomogenNumericTable<double>(rawData, nCols, nRows); | ||
| + | |||
| + | // Creating a SharedPtr table | ||
| + | services::SharedPtr<NumericTable> sharedNTable(dataTable); | ||
| + | </source> | ||
| + | |||
| + | CSV Files - The rows should be determined during runtime, in the example hard coded 1000 | ||
| + | <source lang=c++> | ||
| + | string dataFileName = "/path/to/file/datafile.csv"; | ||
| + | const int nRows = 1000; // number of rows to be read | ||
| + | |||
| + | // Create the data source | ||
| + | FileDataSource<CSVFeatureManager> dataSource(dataFileName, | ||
| + | DataSource::doAllocateNumericTable, | ||
| + | DataSource::doDictionaryFromContext); | ||
| + | |||
| + | // Load data from the CSV file | ||
| + | dataSource.loadDataBlock(nRows); | ||
| + | |||
| + | // Extract NumericTable | ||
| + | services::SharedPtr<NumericTable> sharedNTable; | ||
| + | </source> | ||
| + | |||
| + | == How to Extract Data == | ||
| + | Information can be extracted directly from the table. | ||
| + | <source lang=c++> | ||
| + | services::SharedPtr<NumericTable> dataTable; | ||
| + | // ... Populate dataTable ... // | ||
| + | |||
| + | double* rawData = dataTable.getArray(); | ||
| + | </source> | ||
| + | |||
| + | Can also acquire data by transferring information to a BlockDescriptor object | ||
| + | <source lang=c++> | ||
| + | services::SharedPtr<NumericTable> dataTable; | ||
| + | services::SharedPtr<NumericTable> dataTable; | ||
| + | // ... Populate dataTable ... // | ||
| + | |||
| + | BlockDescriptor<double> block; | ||
| + | |||
| + | //offset defines the row number one wants to begin at, number of rows, read/write permissions, block is the object being written to | ||
| + | //provides more control vs. just defining an array | ||
| + | dataTable->getBlockOfRows(offset, numRows, readwrite, block); | ||
| + | double* rawData = block.getBlockPtr(); | ||
| + | </source> | ||
| + | |||
| + | == How to create the Training Model == | ||
| + | After the data is loaded into a numeric table it is then put into an algorithm and a trained model is created. | ||
| + | It first requires features and response values to be inputted. | ||
| + | |||
| + | <source lang=c++> | ||
| + | // Setting up the training sets. | ||
| + | services::SharedPtr<NumericTable> trnFeatures(trnFeatNumTable); | ||
| + | services::SharedPtr<NumericTable> trnResponse(trnRespNumTable); | ||
| + | |||
| + | // Setting up the algorithm object | ||
| + | training::Batch<> algorithm; | ||
| + | algorithm.input.set(training::data, trnFeatures); | ||
| + | algorithm.input.set(training::dependentVariables, trnResponse); | ||
| + | |||
| + | // Training | ||
| + | algorithm.compute(); | ||
| + | |||
| + | // Extracting the result | ||
| + | services::SharedPtr<training::Result> trainingResult; | ||
| + | trainingResult = algorithm.getResult(); | ||
| + | </source> | ||
| + | |||
| + | The example used default values for the Batch object but these can be configured to show the type/precision (float, double) | ||
| + | and method which defines the mathematical algorithm which can be used for computation. | ||
| + | <source lang=c++> | ||
| + | training::Batch<algorithmFPType=TYPE, method=MTHD> algorithm; | ||
| + | </source> | ||
| + | |||
| + | == Creating the Prediction Model == | ||
| + | The predictive model requires the training portion to be completed because it uses the model made from there. | ||
| + | It also has a batch object similar to the training portion with the same types of inputs. This algorithm will need two different inputs | ||
| + | the data and a model. The values are extracted from the results object and once obtained will compute the predicted responses to the | ||
| + | test feature vectors. The results will be printed out in a one dimensional result. | ||
| + | <source lang=c++> | ||
| + | // ... Set up: training algorithm ... // | ||
| + | services::SharedPtr<training::Result> trainingResult; | ||
| + | trainingResult = algorithm.getResult(); | ||
| + | services::SharedPtr<NumericTable> testFeatures(tstFeatNumTable); | ||
| + | // ... Set up: populating testFeatures ... // | ||
| + | |||
| + | // Creating the algorithm object | ||
| + | prediction::Batch<> algorithm; | ||
| + | algorithm.input.set(prediction::data, testFeatures); | ||
| + | algorithm.input.set(prediction::model, trainingResult->get(training::model)); | ||
| + | |||
| + | // Training | ||
| + | algorithm.compute(); | ||
| + | |||
| + | // Extracting the result | ||
| + | services::SharedPtr<prediction::Result> predictionResult; | ||
| + | predictionResult = algorithm.getResult(); | ||
| + | BlockDescriptor<double> resultBlock; | ||
| + | predictionResult->get(prediction::prediction)->getBlockOfRows(0, numDepVariables, | ||
| + | readOnly, resultBlock); | ||
| + | double* result = resultBlock.getBlockPtr(); | ||
| + | </source> | ||
| + | |||
| + | [[File:TrainingPrediction.jpg]] <br/> | ||
| + | This image shows what has been created so far. The training has made a data model with the use of the features and responses and with that model the prediction is able to test new features and output a response based on | ||
| + | the training information. | ||
| + | |||
| + | == Implementation == | ||
| + | For this example once again it required the use of polynomial regression which required the information to be expanded upon before training. After that is completed it would then be implemented similarly to above and a prediction model can be created once again. | ||
| + | |||
| + | <source lang=c++> | ||
| + | // Getting data from the source | ||
| + | FileDataSource<CSVFeatureManager> featuresSrc(trainingFeaturesFile, | ||
| + | DataSource::doAllocateNumericTable, | ||
| + | DataSource::doDictionaryFromContext); | ||
| + | featuresSrc.loadDataBlock(nTrnVectors); | ||
| + | |||
| + | // Creating a block object to extract data | ||
| + | BlockDescriptor<double> features_block; | ||
| + | featuresSrc.getNumericTable()->getBlockOfRows(0, nTrnVectors, | ||
| + | readOnly, features_block); | ||
| + | |||
| + | // Getting the pointer to the data | ||
| + | double* featuresArray = features_block.getBlockPtr(); | ||
| + | |||
| + | // Expanding the data (see source for full implementation) | ||
| + | const int features_count = nFeatures*expansion*nTrnVectors; | ||
| + | double * expanded_tstFeatures = (double*) malloc(sizeof(double)*features_count); | ||
| + | expand_feature_vector(trnFeatures_block.getBlockPtr(), expanded_trnFeatures, | ||
| + | nFeatures, nTrnVectors, expansion); | ||
| + | |||
| + | // Repackaging the result into a numeric table | ||
| + | HomogenNumericTable<double> expanded_table(expanded_trnFeatures, | ||
| + | nFeatures*expansion, nTrnVectors); | ||
| + | trainingFeaturesTable = services::SharedPtr<NumericTable>(expanded_table); | ||
| + | </source> | ||
| + | |||
| + | |||
| + | |||
| + | [[File:TableValue.jpg]]<br/> | ||
| + | Shows the results of the reference vs the prediction for 1st - 3rd order expansions | ||
| + | |||
| + | |||
| + | |||
| + | [[File:TableValueGraph.jpg]]<br/> | ||
| + | The information plotted graphically | ||
| + | |||
| + | |||
| + | == Testing Quality Of Model == | ||
| + | Finally the DAAL library contains the feature to test one's model with a set of ground values and see how accurate the predictions actually are. | ||
| + | One would just need to load the values, obtain the prediction results and then run the quality metric to compute the error rates. | ||
| + | |||
| + | [[File:QualityModel.jpg|900px]] | ||
| + | <br/><br/> | ||
| + | As one can see from the results the model has an error rate of 0.004 showing that the algorithm is quite proficient at making predictions for these yachts. | ||
| + | <br/> | ||
| + | [[File:QualityResults.jpg | 700px]] | ||
| + | |||
| + | == Sources == | ||
| + | *https://software.intel.com/content/www/us/en/develop/tools/oneapi/components/onedal.html#gs.8qq3cz | ||
| + | *https://software.intel.com/content/www/us/en/develop/documentation/onedal-developer-guide-and-reference/top.html | ||
| + | *https://www.codeproject.com/Articles/1151612/A-Performance-Library-for-Data-Analytics-and-Machi | ||
| + | *https://colfaxresearch.com/intro-to-daal-1/ | ||
Latest revision as of 17:03, 11 August 2021
Contents
- 1 Project Name
- 2 Group Members
- 3 Background
- 4 Features
- 5 Users of the Library
- 6 Data Analytics Pipeline
- 7 Data Management
- 8 Building Blocks
- 9 Computations
- 10 How To Use Intel DAAL
- 11 How To Load Data
- 12 How to Extract Data
- 13 How to create the Training Model
- 14 Creating the Prediction Model
- 15 Implementation
- 16 Testing Quality Of Model
- 17 Sources
Project Name
Intel Data Analytics Acceleration Library
Group Members
- Jedd Chionglo
- Gabriel Dizon
Background
The Intel® Data Analytics Acceleration Library (DAAT) is used by data scientists to help analyze big data and solve their problems. This is due to the nature of the data which is becoming too large, fast, or complex to process using the traditional means. Recently data sources are becoming more complex compared to traditional data, in some cases they’re being driven by artificial intelligence, the Internet of Things, and our mobile devices. This is because the data coming from devices, sensors, web and social media, and log files are being generated at a large scale and in real time. Intel has launched their oneDAL library on December 2020 and the intial DAAL library was made on August 25, 2020. It is bundled with the intel oneAPI Base Toolkit and is compatible with Windows, Linux and Mac and also uses C++, python, Java, etc. To install the Intel DAAL library follow the instructions.
Features
- Produce quicker and better predictions
- Analyze large datasets with available computer resources
- Optimize data ingestion and algorithmic compute simultaneously
- Supports offline, distributed, and streaming usage models
- Handles big data better than libraries such as Intel’s Math Kernel Library (MKL)
- Maximum Calculation Performance
- High-Speed Algorithms
Users of the Library
- Data Scientist
- Researchers
- Data Analysts
Data Analytics Pipeline
The Intel® Data Analytics Acceleration Library (DAAT) is used by data scientists to help analyze big data and solve their problems. This is due to the nature of the data which is becoming too large, fast, or complex to process using the traditional means. Recently data sources are becoming more complex compared to traditional data, in some cases they’re being driven by artificial intelligence, the Internet of Things, and our mobile devices. This is because the data coming from devices, sensors, web and social media, and log files are being generated at a large scale and in real time.
- The Intel® Data Analytics Acceleration Library provides optimized building blocks for the various stages of data analysis
Data Management
Data management refers to a set of operations that work on the data and are distributed between the stages of the data analytics pipeline. The data management flow is shown in the figure below. You start with your raw data and its acquisition. The first step is to transfer the out of memory data, the source could be from files, databases, or remote storage, into an in-memory representation. Once it’s inside memory you can then prepare the data in many ways. DAAL offers support of various in-memory data formats such as an array of structures or compressed-sparse-row format, you can also convert data into a numeric representation, filter data and perform data normalization, compute various statistical metrics for numerical data such as the mean, variance, and covariance, and also compress and decompress the data. The third step is to stream the in-memory numerical data to the algorithm In complex usage scenarios the data ends up going through these three stages back and forth, so for example if your data isn’t fully available at the start of the computation it can be sent in chunks which is an advantage of DAAL.
- Raw Data Acquisition
- Data preperation
- Algorithim computation
This is a tabular view of data where the columns represent features, these are properties or qualities of a real object or event, and the table rows represent observations which are feature vectors that are used to encode information for a real object or event. This is used in our machine learning regression example.
The data set is used across all stages of the data analytics pipeline, during acquisition it’s downloaded into local memory, during preparation it’s converted to a numerical representation, and during computation it’s used with an algorithm as an input or result.
Building Blocks
DAAL provides building blocks which helps with aspects of data analytics from the tools used for managing data to computational algorithms.
- DAAL helps with aspects of data analytics from the tools used for managing data to computational algorithms
Computations
- Must choose an algorithm for the application
- Below are the different types of algorithms that DAAL currently has for analysis training and prediction
- Modes of Computation
- Batch Mode - simplest mode uses a single data set
- Online Mode - multiple training sets
- Distributed Mode - computation of partial results and supports multiple data sets
How To Use Intel DAAL
In the example below we will show how to use the basics of the intel DAAL library. The example looks at the hydrodynamics of yachts and builds a predictive model based on that information. It uses linear regression to extrapolate the data based on the training algorithm and predictive modelling, more specifically it uses polynomial regression. This will show how to load data, call loaded data, create a training model based on the information, show how to use the trained model for predictions, apply implementations to the model and then finally test the quality of the data.
How To Load Data
Intel DAAL requires the use of numeric tables as inputs there are three different types of tables:
- Heterogenous - contains multiple data types
- Homogeneous - only one data type
- Matrices - used when matrix algebra is needed
The information can be loaded offline using two different methods:
Arrays
// Array containing the data
const int nRows = 100;
const int nCols = 100;
double* rawData = (double*) malloc(sizeof(double)*nRows*nCols);

// Creating the numeric table
NumericTable* dataTable = new HomogenNumericTable<double>(rawData, nCols, nRows);

// Creating a SharedPtr table
services::SharedPtr<NumericTable> sharedNTable(dataTable);
CSV Files - The rows should be determined during runtime, in the example hard coded 1000
string dataFileName = "/path/to/file/datafile.csv";
const int nRows = 1000; // number of rows to be read

// Create the data source
FileDataSource<CSVFeatureManager> dataSource(dataFileName,
DataSource::doAllocateNumericTable,
DataSource::doDictionaryFromContext);

// Load data from the CSV file
dataSource.loadDataBlock(nRows);

// Extract NumericTable
services::SharedPtr<NumericTable> sharedNTable;
How to Extract Data
Information can be extracted directly from the table.
services::SharedPtr<NumericTable> dataTable;
// ... Populate dataTable ... //

double* rawData = dataTable.getArray();
Can also acquire data by transferring information to a BlockDescriptor object
services::SharedPtr<NumericTable> dataTable;
services::SharedPtr<NumericTable> dataTable;
// ... Populate dataTable ... //

BlockDescriptor<double> block;

//offset defines the row number one wants to begin at, number of rows, read/write permissions, block is the object being written to
//provides more control vs. just defining an array
dataTable->getBlockOfRows(offset, numRows, readwrite, block);
double* rawData = block.getBlockPtr();
How to create the Training Model
After the data is loaded into a numeric table it is then put into an algorithm and a trained model is created. It first requires features and response values to be inputted.
// Setting up the training sets.
services::SharedPtr<NumericTable> trnFeatures(trnFeatNumTable);
services::SharedPtr<NumericTable> trnResponse(trnRespNumTable);

// Setting up the algorithm object
training::Batch<> algorithm;
algorithm.input.set(training::data, trnFeatures);
algorithm.input.set(training::dependentVariables, trnResponse);

// Training
algorithm.compute();

// Extracting the result
services::SharedPtr<training::Result> trainingResult;
trainingResult = algorithm.getResult();
The example used default values for the Batch object but these can be configured to show the type/precision (float, double) and method which defines the mathematical algorithm which can be used for computation.
training::Batch<algorithmFPType=TYPE, method=MTHD> algorithm;Creating the Prediction Model
The predictive model requires the training portion to be completed because it uses the model made from there. It also has a batch object similar to the training portion with the same types of inputs. This algorithm will need two different inputs the data and a model. The values are extracted from the results object and once obtained will compute the predicted responses to the test feature vectors. The results will be printed out in a one dimensional result.
// ... Set up: training algorithm  ... //
services::SharedPtr<training::Result> trainingResult;
trainingResult = algorithm.getResult();
services::SharedPtr<NumericTable> testFeatures(tstFeatNumTable);
// ... Set up: populating testFeatures  ... //

// Creating the algorithm object
prediction::Batch<> algorithm;
algorithm.input.set(prediction::data, testFeatures);
algorithm.input.set(prediction::model, trainingResult->get(training::model));

// Training
algorithm.compute();

// Extracting the result
services::SharedPtr<prediction::Result> predictionResult;
predictionResult = algorithm.getResult();
BlockDescriptor<double> resultBlock;
predictionResult->get(prediction::prediction)->getBlockOfRows(0, numDepVariables,
readOnly, resultBlock);
double* result = resultBlock.getBlockPtr();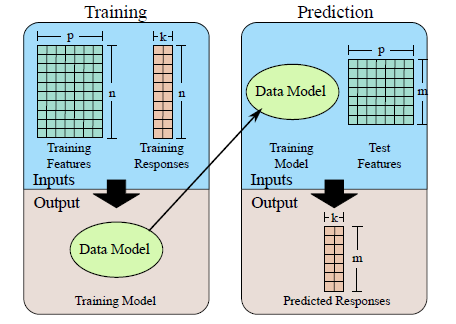
This image shows what has been created so far. The training has made a data model with the use of the features and responses and with that model the prediction is able to test new features and output a response based on
the training information.
Implementation
For this example once again it required the use of polynomial regression which required the information to be expanded upon before training. After that is completed it would then be implemented similarly to above and a prediction model can be created once again.
// Getting data from the source
FileDataSource<CSVFeatureManager> featuresSrc(trainingFeaturesFile,
DataSource::doAllocateNumericTable,
DataSource::doDictionaryFromContext);
featuresSrc.loadDataBlock(nTrnVectors);

// Creating a block object to extract data
BlockDescriptor<double> features_block;
featuresSrc.getNumericTable()->getBlockOfRows(0, nTrnVectors,
readOnly, features_block);

// Getting the pointer to the data
double* featuresArray = features_block.getBlockPtr();

// Expanding the data (see source for full implementation)
const int features_count = nFeatures*expansion*nTrnVectors;
double * expanded_tstFeatures = (double*) malloc(sizeof(double)*features_count);
expand_feature_vector(trnFeatures_block.getBlockPtr(), expanded_trnFeatures,
nFeatures, nTrnVectors, expansion);

// Repackaging the result into a numeric table
HomogenNumericTable<double> expanded_table(expanded_trnFeatures,
nFeatures*expansion, nTrnVectors);
trainingFeaturesTable = services::SharedPtr<NumericTable>(expanded_table);
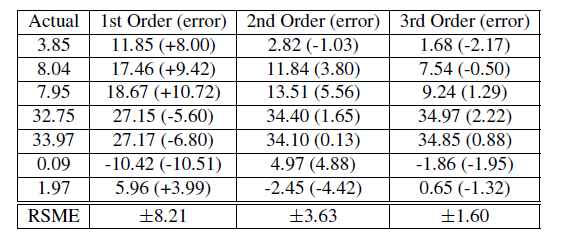
Shows the results of the reference vs the prediction for 1st - 3rd order expansions
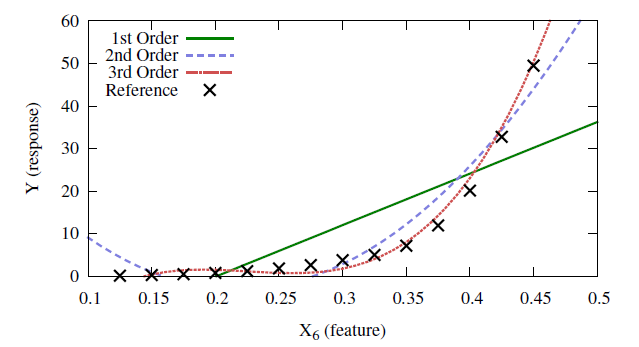
The information plotted graphically
Testing Quality Of Model
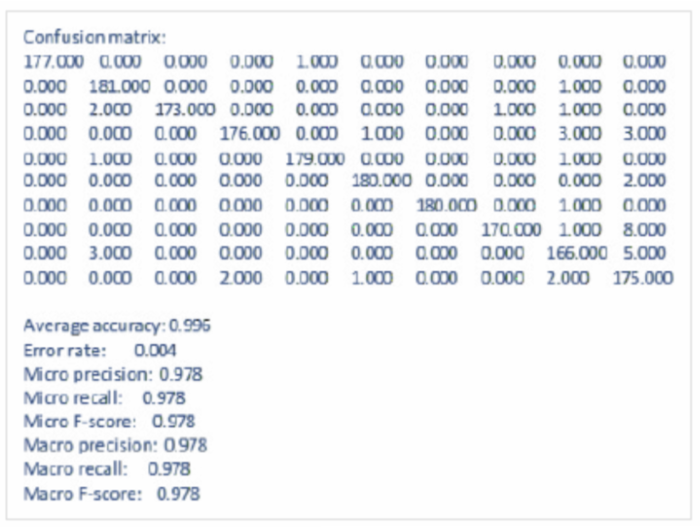
Finally the DAAL library contains the feature to test one's model with a set of ground values and see how accurate the predictions actually are. One would just need to load the values, obtain the prediction results and then run the quality metric to compute the error rates.

As one can see from the results the model has an error rate of 0.004 showing that the algorithm is quite proficient at making predictions for these yachts.
Sources
- https://software.intel.com/content/www/us/en/develop/tools/oneapi/components/onedal.html#gs.8qq3cz
- https://software.intel.com/content/www/us/en/develop/documentation/onedal-developer-guide-and-reference/top.html
- https://www.codeproject.com/Articles/1151612/A-Performance-Library-for-Data-Analytics-and-Machi
- https://colfaxresearch.com/intro-to-daal-1/


