Difference between revisions of "GPU621/Intel Parallel Studio Inspector"
(→Intel Parallel Studio Inspector) |
(→Correctness Analyzer & Debugger) |
||
| (37 intermediate revisions by the same user not shown) | |||
| Line 8: | Line 8: | ||
= Intel Parallel Studio Inspector = | = Intel Parallel Studio Inspector = | ||
| + | |||
=== Description === | === Description === | ||
| + | |||
The purpose of this project is to provide a functional overview of the Intel Inspector, which is a correctness checking program that detects and locates threading errors (deadlocks and data races) and memory errors (memory leaks and illegal memory accesses) of an application. In this project, the functional components and the graphical user interface of the Intel Inspector are demonstrated by use case examples. The successful delivery of this project concludes that how to utilize this tool from Intel to improve the accuracy and efficiency when developing memory and computation-intensive application. | The purpose of this project is to provide a functional overview of the Intel Inspector, which is a correctness checking program that detects and locates threading errors (deadlocks and data races) and memory errors (memory leaks and illegal memory accesses) of an application. In this project, the functional components and the graphical user interface of the Intel Inspector are demonstrated by use case examples. The successful delivery of this project concludes that how to utilize this tool from Intel to improve the accuracy and efficiency when developing memory and computation-intensive application. | ||
| − | + | = Features and Functionalities = | |
| + | For further information, please refer to the official site of [https://software.intel.com/content/www/us/en/develop/tools/inspector.html Intel Inspector]. | ||
| + | Intel Inspector is available as a stand-alone debugger as well as part of the Parallel Studio XE. Intel Inspector is designed to save money, time, data, and effort in developing applications. It is a convenient tool for solving memory, threading, and persistent memory errors of an application. | ||
| + | |||
| + | |||
| + | [[File:WorkFlow.png|500px]] | ||
| + | [https://hpc.llnl.gov/software/development-environment-software/intel-inspector Work Flow of Intel Inspector] | ||
| + | |||
| + | ==Features== | ||
| + | |||
| + | Intel Inspector provides developers a way to secure their program by detecting and locating memory and threading errors. When a program is large and the logic within it is complicated, the memory and threading bugs become difficult to locate. This is particularly true when developing programs that need to be optimized using multi-threading approaches. Intel Inspector offers parallelization model support, which includes the support to: | ||
| + | |||
| + | * '''OpenMP''' | ||
| + | * '''TBB''' | ||
| + | * Parallel language extensions for the Intel C++ Compiler | ||
| + | * Microsoft PPL | ||
| + | * Win32 and POSIX threads | ||
| + | * '''Intel MPI Library''' | ||
| + | |||
| + | Besides, Intel Inspector also supports various languages (C, C++, and Fortran), operating systems (Windows and Linux), IDEs (Visual Studio, Eclipse, etc.), and compilers (Intel C++, Intel Fortran, Visual C++, GCC, etc.). These all together make Intel Inspector a convenient and efficient tool in helping developers build and test complicated programs and HPCs more easily. | ||
| + | |||
| + | |||
| + | ==Functionalilites== | ||
| + | |||
| + | In terms of functionalities, the Intel Inspector four different debuggers: Correctness Analyzer & Debugger, Memory Debugger, Threading Debugger, and Persistent Memory Debugger. In the scope of this course and project, we will focus on the first three debuggers. | ||
| + | |||
| + | ===Correctness Analyzer & Debugger=== | ||
| + | |||
| + | Normally a debugging process inserts a breakpoint right at the location where an error occurs. However, it is sometimes hard to find out what exactly the problem is because that location may have been executed hundreds of times. The Correctness Analyzer & Debugger makes the Intel Inspector work on the code without special recompiles for analysis. More, it makes the diagnosis faster by combining debug with analysis, the Intel Inspector determines when a problem occurs and breaks into the debugger at the right time and location. | ||
| + | |||
| + | ===Memory Debugger=== | ||
| + | |||
| + | The memory problem is a big headache in programming. The Memory Debugger in Intel Inspector detects and locates the memory error location, as well as providing a graphical tool to show memory growth, locate the call stack, and the code snippet where the memory growth is produced. | ||
| + | |||
| + | ===Threading Debugger=== | ||
| + | |||
| + | In a program, threading problems are very hard to detect and locate since they are usually considered 'errors' in the program logic. The reason for this is that threading problems are often non-deterministic problems such as race conditions and deadlock. These kinds of problems do not happen in every run of the program and even they happen, the program runs as usual but generates wrong outputs. The Threading Debugger inside Intel Inspector works as an efficient diagnosis tool against threading errors in the program even if the program does not encounter the error. This debugger is particularly helpful when building HPC applications and optimizing codes using multi-threading algorithms. | ||
| + | |||
| + | When using Intel Inspector for analysis, it is important to have a proper balance between analysis deepness and memory overload. | ||
| + | |||
| + | = How to use = | ||
| + | |||
| + | == Intel Inspector GUI == | ||
| + | |||
| + | It is extremely simple to use Intel Inspector. The Intel Inspector can work as a stand-alone application or as an insider function of the IDE. Here we use Microsoft Visual Studio as an example. | ||
| + | |||
| + | When we are inside the source code of a program in Visual Studio, build your program, simply click on the dropdowns besides the Intel Inspector icon, select "New Analysis" | ||
| + | |||
| + | |||
| + | [[File:Dropdowns.jpg|1100px]] | ||
| + | |||
| + | |||
| + | Now we are inside the analysis panel, select the analysis type, deepness of analysis, and extra options, then press start to launch analysis | ||
| + | |||
| + | |||
| + | [[File:GUIpanel.jpg|1100px]] | ||
| + | |||
| + | |||
| + | Now the Intel Inspector runs the code and trying to debug. The debug progress is shown in the collection log. When the analysis is complete, click on the "Summary" tag and the error type and location the error is shown in the panels respectively. | ||
| + | |||
| + | |||
| + | [[File:CollectionLog.jpg|1100px]] | ||
| + | |||
| + | [[File:AnalysisSummary.jpg|1100px]] | ||
| + | |||
| + | |||
| + | == On-Demand Memory Analysis == | ||
| + | Intel Inspector offers on-demand memory analysis to help developers save time on debugging memory problems. Memory analysis is very expensive and takes a lot of time. With the on-demand analysis, a developer can specify a portion of the execution time of the application to minimize the overhead created by memory analysis. The on-demand analysis focuses on memory growth detection and memory leak analysis. | ||
| + | |||
| + | |||
| + | [[File:OnDemandMemoryAnalysis.jpg|1100px]] | ||
| + | |||
| + | |||
| + | For more details, please refer to this [https://software.intel.com/content/www/us/en/develop/videos/intel-inspector-xe-memory-and-thread-correctness-tool-overview.html video by Intel] | ||
| + | |||
| + | = Memory problems = | ||
| + | |||
| + | ===Memory Leak=== | ||
| + | |||
| + | In order to test the memory leak diagnosis, the following code snippet is used as the error code. | ||
| + | |||
| + | |||
| + | <syntaxhighlight lang="cpp" line='line'> | ||
int main() | int main() | ||
{ | { | ||
int* c; | int* c; | ||
| − | c = new int(5); | + | c = new int(5); //requests heap memory which will not be freed |
std::cout << *c << std::endl; | std::cout << *c << std::endl; | ||
return 0; | return 0; | ||
} | } | ||
| − | }} | + | </syntaxhighlight> |
| + | |||
| + | |||
| + | As we can see the variable 'c' is assigned a heap resource but never deallocate. We run this program in Intel Inspector | ||
| + | |||
| + | [[File:MemoryLeak.png|1100px]] | ||
| + | |||
| + | |||
| + | The inspection result shows where the leak resource comes from and its location in the code. | ||
| + | |||
| + | |||
| + | ===Invalid Memory Access=== | ||
| + | |||
| + | A special program is used as an example in this section. The inspection on the TBB parallel_for workshop perfectly demonstrates the compatibility of Intel Inspector towards Threading Building Blocks algorithm. | ||
| + | |||
| + | |||
| + | <syntaxhighlight lang="cpp" line='line'> | ||
| + | #ifndef WORDCOUNT_H_ | ||
| + | #define WORDCOUNT_H_ | ||
| + | |||
| + | #include <tbb/tbb.h> | ||
| + | |||
| + | typedef bool (*Delimiter)(char); | ||
| + | |||
| + | class WordCount { | ||
| + | const char* string; | ||
| + | int* const stringSize; | ||
| + | int* const numberOfWord; | ||
| + | int number; | ||
| + | Delimiter delimiter; | ||
| + | |||
| + | public: | ||
| + | WordCount(const char* str, int* const size, int* const numb, int numChar, const Delimiter del): stringSize(size), numberOfWord(numb){ | ||
| + | string = str; | ||
| + | number = numChar; | ||
| + | delimiter = del; | ||
| + | } | ||
| + | |||
| + | void operator()(const tbb::blocked_range<int>& r)const { | ||
| + | for (auto i = r.begin(); i != r.end(); i++) { // the loop only stops when i exactly equals to r.end() | ||
| + | if (!delimiter(string[i])) { | ||
| + | int s = 0; | ||
| + | while (i + s < number && !delimiter(string[i + s])) s++; | ||
| + | stringSize[i] = s; | ||
| + | int n = 0; | ||
| + | for (int j = i + s + 1; j + s < number; j++) { | ||
| + | bool bad = false; | ||
| + | for (int k = 0; | ||
| + | k < s && k + i < number && k + j < number; k++) { | ||
| + | if (string[i + k] != string[j + k]) { | ||
| + | bad = true; | ||
| + | break; | ||
| + | } | ||
| + | } | ||
| + | if (!bad && delimiter(string[j + s])) n++; | ||
| + | } | ||
| + | numberOfWord[i] = n; | ||
| + | } | ||
| + | else { | ||
| + | stringSize[i] = 0; | ||
| + | numberOfWord[i] = 0; | ||
| + | } | ||
| + | i += stringSize[i]; //may jump and sit on outside of the array but still satisfies | ||
| + | //the loop control clause "i != r.end()" | ||
| + | } | ||
| + | } | ||
| + | }; | ||
| + | </syntaxhighlight> | ||
| + | |||
| + | |||
| + | Inspection result | ||
| + | |||
| + | [[File:TBBinvalidAccess.jpg|1100px]] | ||
| + | |||
| + | |||
| + | The Intel Inspector locates the error that comes from the loop inside the functor used by the tbb::parallel_for() function. All the references of the location being illegally accessing are marked as errors, which indicates the error happens during a specific iteration of the loop. However, this inspection has an extremely high memory overhead which makes the analysis time a thousand times longer than the normal run. | ||
| + | |||
| + | |||
| + | ===Memory Growth=== | ||
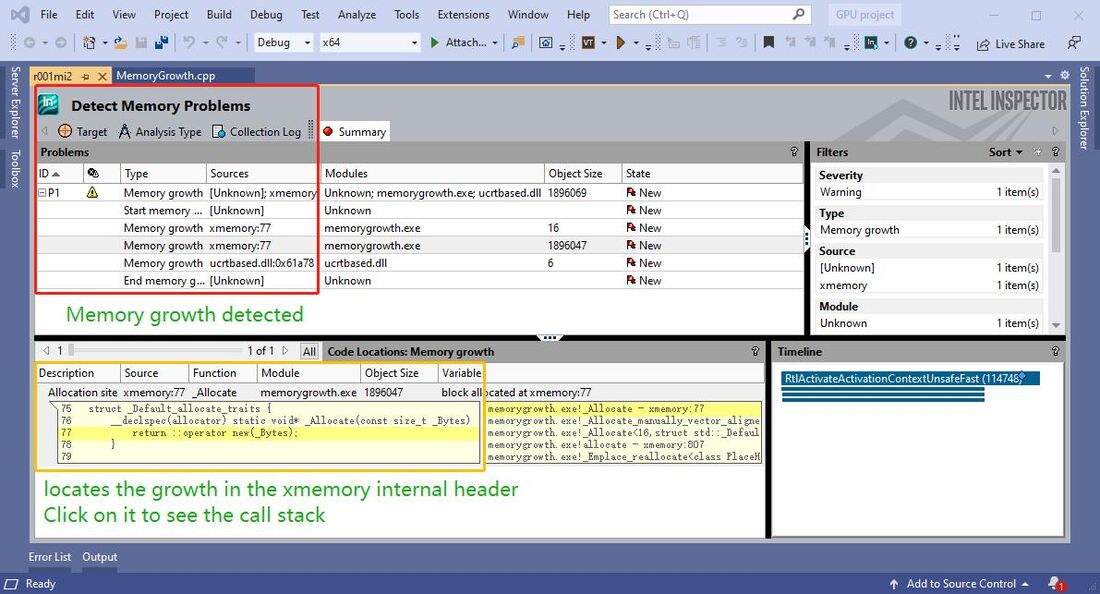
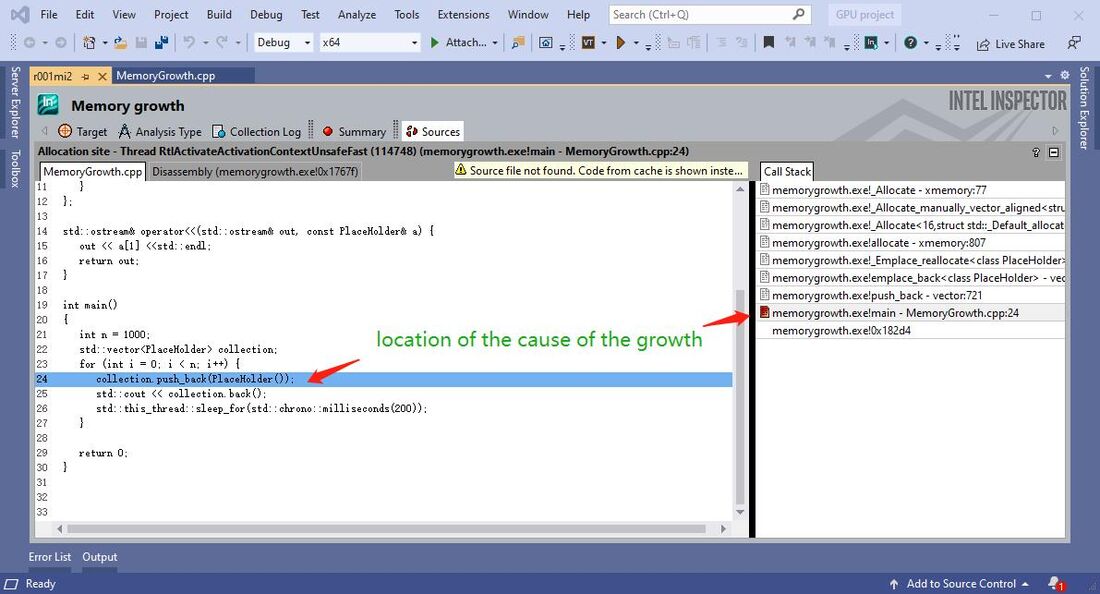
| + | In application development, unexpected memory growth causes a lot of problems and it is very hard to locate since for most of the time it is not considered an error. By using Intel Inspector, we can quickly locate all potential lines that may be the cause of memory growth. | ||
| + | |||
| + | <syntaxhighlight lang="cpp" line='line'> | ||
| + | #include <iostream> | ||
| + | #include <vector> | ||
| + | #include <thread> | ||
| + | |||
| + | class PlaceHolder { | ||
| + | int array[10000]{10}; | ||
| + | }; | ||
| + | |||
| + | |||
| + | int main() | ||
| + | { | ||
| + | int n = 1000; | ||
| + | std::vector<PlaceHolder> collection; | ||
| + | for (int i = 0; i < n; i++) { | ||
| + | collection.push_back(PlaceHolder()); //keep allocating heap memory | ||
| + | std::this_thread::sleep_for(std::chrono::milliseconds(200)); | ||
| + | } | ||
| + | |||
| + | return 0; | ||
| + | } | ||
| + | </syntaxhighlight> | ||
| + | |||
| + | |||
| + | [[File:MemoryGrowth.jpg|1100px]] | ||
| + | |||
| + | [[File:MemoryGrowthSource.jpg|1100px]] | ||
| + | |||
| + | = Thread problems = | ||
| + | |||
| + | ===Race Condition=== | ||
| + | The following program is used to demonstrate the race condition detection in Intel Inspector. In this program, 5 threads are competing to update the 'wallet' object without a lock. The compiler does not see competition as an error and the program always runs successfully. However, the race condition makes the program different results (inconsistent output). A data race is hard to locate manually but with Intel Inspector, it is easy and quick. | ||
| + | |||
| + | <syntaxhighlight lang="cpp" line='line'> | ||
| + | int main() | ||
| + | #include <iostream> | ||
| + | #include <thread> | ||
| + | #include <vector> | ||
| + | |||
| + | class Wallet { | ||
| + | int mMoney; | ||
| + | public: | ||
| + | Wallet() :mMoney(0) {} | ||
| + | int getMoney() { | ||
| + | return mMoney; | ||
| + | } | ||
| + | void addMoney(int money) { | ||
| + | mMoney += money; | ||
| + | } | ||
| + | }; | ||
| + | |||
| + | int testMultithreadWallet() { | ||
| + | Wallet wallet; | ||
| + | int threadNum = 5; | ||
| + | std::vector<std::thread> threads; | ||
| + | //Create 5 threads and push to the vector | ||
| + | for (int i = 0; i < threadNum; i++) { | ||
| + | threads.push_back( | ||
| + | //Create a thread and run its lamda function | ||
| + | std::thread([&]() -> void { | ||
| + | //Call the addMoney 1000 time to add money to the wallet, add 1 dollar each time | ||
| + | for (int i = 0; i < 1000; i++) { | ||
| + | wallet.addMoney(1); | ||
| + | } | ||
| + | }) | ||
| + | ); | ||
| + | } | ||
| + | //Join all threads back to main thread | ||
| + | for (int i = 0; i < threadNum; i++) { | ||
| + | threads.at(i).join(); | ||
| + | } | ||
| + | return wallet.getMoney(); | ||
| + | } | ||
| + | |||
| + | |||
| + | int main() { | ||
| + | int result = 0; | ||
| + | //Run the testMultithreadWallet function 50 times to get the race condition result | ||
| + | for (int k = 0; k < 50; k++) { | ||
| + | //The result should be 5000, if not, print the error result | ||
| + | if ((result = testMultithreadWallet()) != 5000) { | ||
| + | std::cout << "Error at count = " << k << " Money in Wallet = " << result << std::endl; | ||
| + | } | ||
| + | } | ||
| + | return 0; | ||
| + | } | ||
| + | </syntaxhighlight> | ||
| + | |||
| + | |||
| + | Incorrect results generated by the race condition code. | ||
| + | |||
| + | [[File:RaceResult1.jpg|500px]] [[File:RaceResult2.jpg|500px]] | ||
| + | |||
| + | |||
| + | Inspection summary by Intel Inspector | ||
| + | |||
| + | [[File:DataRace.jpg|1100px]] | ||
| + | |||
| + | |||
| + | Using Intel Inspector, data race is quickly detected and located. | ||
| + | |||
| + | |||
| + | ===Deadlock=== | ||
| + | Deadlock is another common error that we encounter when developing multi-threading solutions. The cause of deadlock is one or multiple threads that acquiring resources. Simultaneously, resources that being acquired are locked by other threads that are acquiring resources being locked by the previous threads. The situation causes infinite wait time and the program crashes. Deadlock does not happen in each run of the program, sometimes the program runs successfully, but there is a big chance the program will run into a deadlock. | ||
| + | |||
| + | The following program uses the Mutex template to create a deadlock scenario. | ||
| + | |||
| + | |||
| + | <syntaxhighlight lang="cpp" line='line'> | ||
| + | #include <iostream> | ||
| + | #include <mutex> | ||
| + | #include <thread> | ||
| + | |||
| + | using namespace std; | ||
| + | const int SIZE = 10; | ||
| + | |||
| + | mutex Mutex1, Mutex2; | ||
| + | |||
| + | void even_thread_print(int i) | ||
| + | { | ||
| + | lock_guard<mutex> g1(Mutex1); | ||
| + | lock_guard<mutex> g2(Mutex2); | ||
| + | cout << " " << i << " "; | ||
| + | } | ||
| + | |||
| + | void odd_thread_print(int i) | ||
| + | { | ||
| + | lock_guard<mutex> g2(Mutex2); | ||
| + | lock_guard<mutex> g1(Mutex1); | ||
| + | cout << " " << i << " "; | ||
| + | } | ||
| + | |||
| + | |||
| + | void print(int n) | ||
| + | { | ||
| + | for (int i = SIZE * (n - 1); i < SIZE * n; i++) { | ||
| + | if (n % 2 == 0) { | ||
| + | even_thread_print(i); | ||
| + | } | ||
| + | else | ||
| + | odd_thread_print(i); | ||
| + | |||
| + | } | ||
| + | cout << endl; | ||
| + | cout << "---------------------------------------" << endl; | ||
| + | } | ||
| + | |||
| + | int main() | ||
| + | { | ||
| + | thread t1(print, 1); // print 0-9 | ||
| + | thread t2(print, 2); // print 10-19 | ||
| + | thread t3(print, 3); // print 20-29 | ||
| + | thread t4(print, 4); // print 30-39 | ||
| + | |||
| + | t1.join(); | ||
| + | t2.join(); | ||
| + | t3.join(); | ||
| + | t4.join(); | ||
| + | |||
| + | return 0; | ||
| + | } | ||
| + | </syntaxhighlight> | ||
| + | |||
| + | |||
| + | Program Outputs (Correct output and encounters deadlock) | ||
| + | |||
| + | [[File:DeadLockNoIssue.jpg|500px]] [[File:DeadLockWithIssue.jpg|530px]] | ||
| + | |||
| + | |||
| + | Intel Inspector result | ||
| + | |||
| + | [[File:DeadLockSummary.jpg|1100px]] | ||
| + | |||
| + | [[File:LocateDeadLock.jpg|1100px]] | ||
| + | |||
| + | |||
| + | With the use of Intel Inspector, the deadlock is quickly detected and located. By tracing the call stack we know which locations in our source code produced the deadlock. | ||
| + | |||
| + | |||
| + | = Resources = | ||
| + | https://software.intel.com/content/www/us/en/develop/videos/intel-inspector-xe-memory-and-thread-correctness-tool-overview.html | ||
| + | |||
| + | https://software.intel.com/content/www/us/en/develop/tools/inspector.html | ||
| + | |||
| + | = Progress = | ||
| + | Update 1: Sunday, Nov 8, 2020 - Created home page. | ||
| + | |||
| + | Update 2: Friday, Nov 13, 2020 - Created features section. | ||
| + | |||
| + | Update 3: Saturday, Nov 14, 2020 - Worked on creating and referencing error programs for use case demonstrations. | ||
| + | |||
| + | Update 4: Monday, Nov 16, 2020 - Created "how to use" section. | ||
| + | |||
| + | Update 5: Tuesday, Nov 17, 2020 - All error codes for the use case scenario are complete. | ||
| + | |||
| + | Update 6: Wednesday, Nov 18, 2020 - Created use case sections. | ||
| + | |||
| + | Update 7: Friday, Nov 20, 2020 - Minor fixes | ||
| + | |||
| + | Update 8: Wednesday, Nov 25, 2020 - Minor fixes | ||
Latest revision as of 18:04, 27 November 2020
GPU621/DPS921 | Participants | Groups and Projects | Resources | Glossary
Contents
Group Members
1. Yuhao Lu
2. Song Zeng
3. Jiawei Yang
Intel Parallel Studio Inspector
Description
The purpose of this project is to provide a functional overview of the Intel Inspector, which is a correctness checking program that detects and locates threading errors (deadlocks and data races) and memory errors (memory leaks and illegal memory accesses) of an application. In this project, the functional components and the graphical user interface of the Intel Inspector are demonstrated by use case examples. The successful delivery of this project concludes that how to utilize this tool from Intel to improve the accuracy and efficiency when developing memory and computation-intensive application.
Features and Functionalities
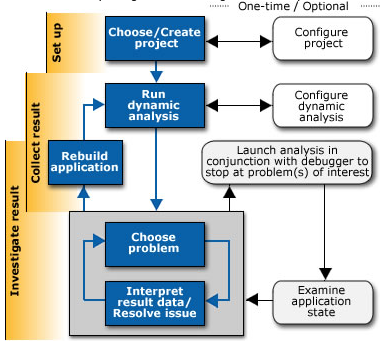
For further information, please refer to the official site of Intel Inspector. Intel Inspector is available as a stand-alone debugger as well as part of the Parallel Studio XE. Intel Inspector is designed to save money, time, data, and effort in developing applications. It is a convenient tool for solving memory, threading, and persistent memory errors of an application.
Features
Intel Inspector provides developers a way to secure their program by detecting and locating memory and threading errors. When a program is large and the logic within it is complicated, the memory and threading bugs become difficult to locate. This is particularly true when developing programs that need to be optimized using multi-threading approaches. Intel Inspector offers parallelization model support, which includes the support to:
- OpenMP
- TBB
- Parallel language extensions for the Intel C++ Compiler
- Microsoft PPL
- Win32 and POSIX threads
- Intel MPI Library
Besides, Intel Inspector also supports various languages (C, C++, and Fortran), operating systems (Windows and Linux), IDEs (Visual Studio, Eclipse, etc.), and compilers (Intel C++, Intel Fortran, Visual C++, GCC, etc.). These all together make Intel Inspector a convenient and efficient tool in helping developers build and test complicated programs and HPCs more easily.
Functionalilites
In terms of functionalities, the Intel Inspector four different debuggers: Correctness Analyzer & Debugger, Memory Debugger, Threading Debugger, and Persistent Memory Debugger. In the scope of this course and project, we will focus on the first three debuggers.
Correctness Analyzer & Debugger
Normally a debugging process inserts a breakpoint right at the location where an error occurs. However, it is sometimes hard to find out what exactly the problem is because that location may have been executed hundreds of times. The Correctness Analyzer & Debugger makes the Intel Inspector work on the code without special recompiles for analysis. More, it makes the diagnosis faster by combining debug with analysis, the Intel Inspector determines when a problem occurs and breaks into the debugger at the right time and location.
Memory Debugger
The memory problem is a big headache in programming. The Memory Debugger in Intel Inspector detects and locates the memory error location, as well as providing a graphical tool to show memory growth, locate the call stack, and the code snippet where the memory growth is produced.
Threading Debugger
In a program, threading problems are very hard to detect and locate since they are usually considered 'errors' in the program logic. The reason for this is that threading problems are often non-deterministic problems such as race conditions and deadlock. These kinds of problems do not happen in every run of the program and even they happen, the program runs as usual but generates wrong outputs. The Threading Debugger inside Intel Inspector works as an efficient diagnosis tool against threading errors in the program even if the program does not encounter the error. This debugger is particularly helpful when building HPC applications and optimizing codes using multi-threading algorithms.
When using Intel Inspector for analysis, it is important to have a proper balance between analysis deepness and memory overload.
How to use
Intel Inspector GUI
It is extremely simple to use Intel Inspector. The Intel Inspector can work as a stand-alone application or as an insider function of the IDE. Here we use Microsoft Visual Studio as an example.
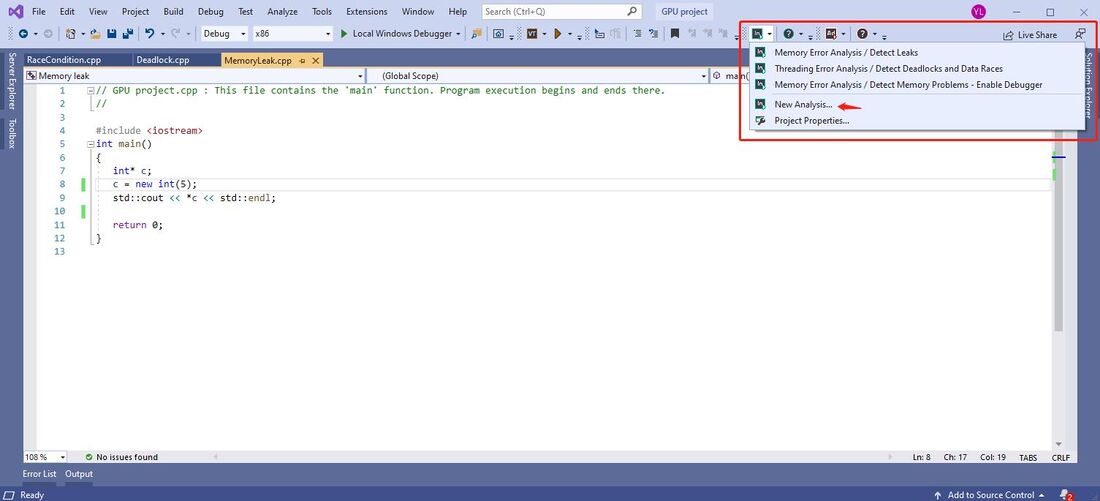
When we are inside the source code of a program in Visual Studio, build your program, simply click on the dropdowns besides the Intel Inspector icon, select "New Analysis"
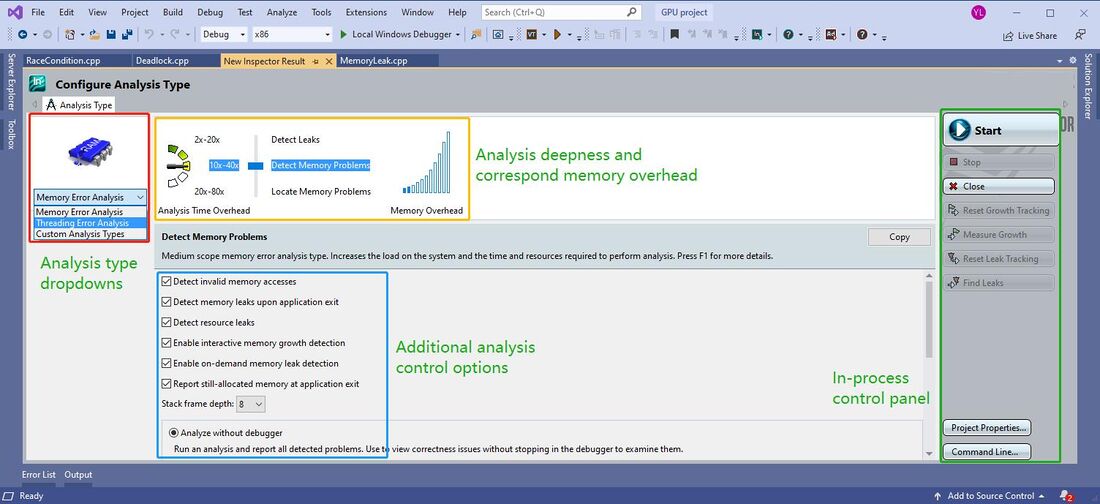
Now we are inside the analysis panel, select the analysis type, deepness of analysis, and extra options, then press start to launch analysis
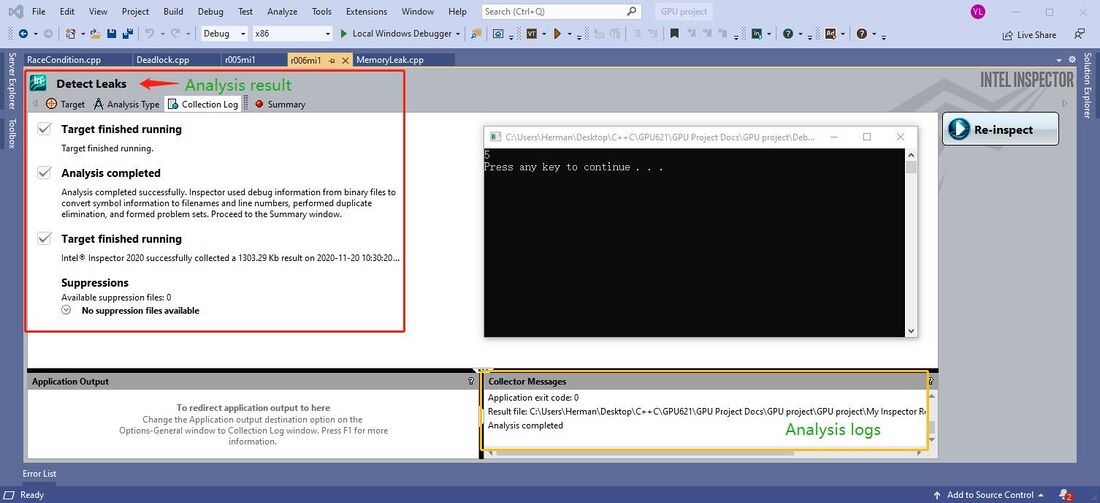
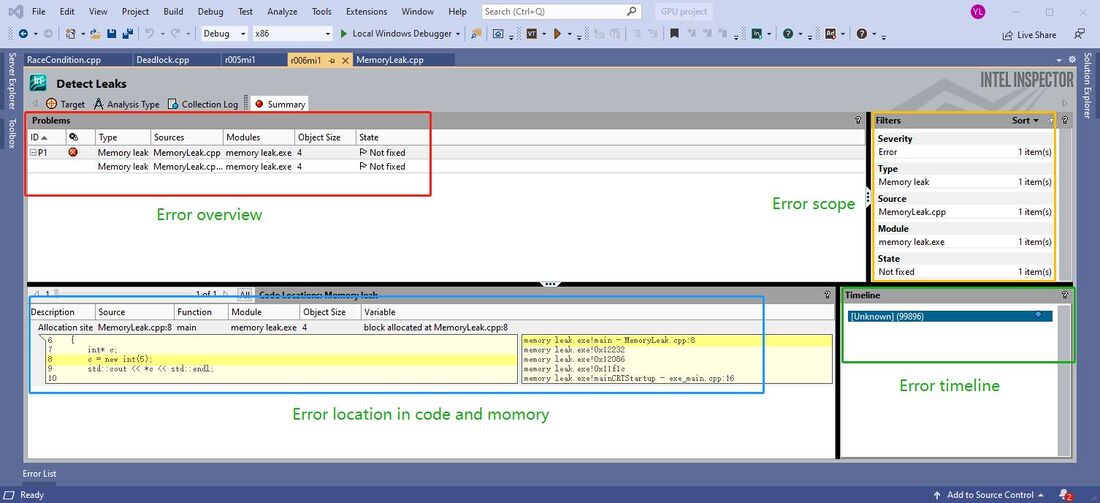
Now the Intel Inspector runs the code and trying to debug. The debug progress is shown in the collection log. When the analysis is complete, click on the "Summary" tag and the error type and location the error is shown in the panels respectively.
On-Demand Memory Analysis
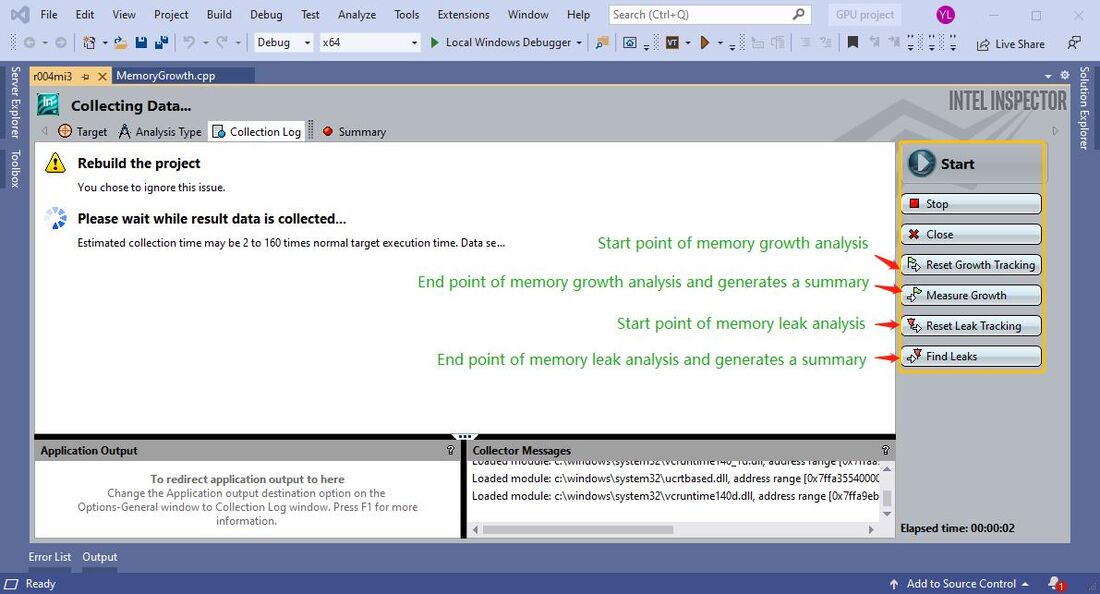
Intel Inspector offers on-demand memory analysis to help developers save time on debugging memory problems. Memory analysis is very expensive and takes a lot of time. With the on-demand analysis, a developer can specify a portion of the execution time of the application to minimize the overhead created by memory analysis. The on-demand analysis focuses on memory growth detection and memory leak analysis.
For more details, please refer to this video by Intel
Memory problems
Memory Leak
In order to test the memory leak diagnosis, the following code snippet is used as the error code.
int main()
{
	int* c;
	c = new int(5); //requests heap memory which will not be freed
	std::cout << *c << std::endl;

	return 0;
}
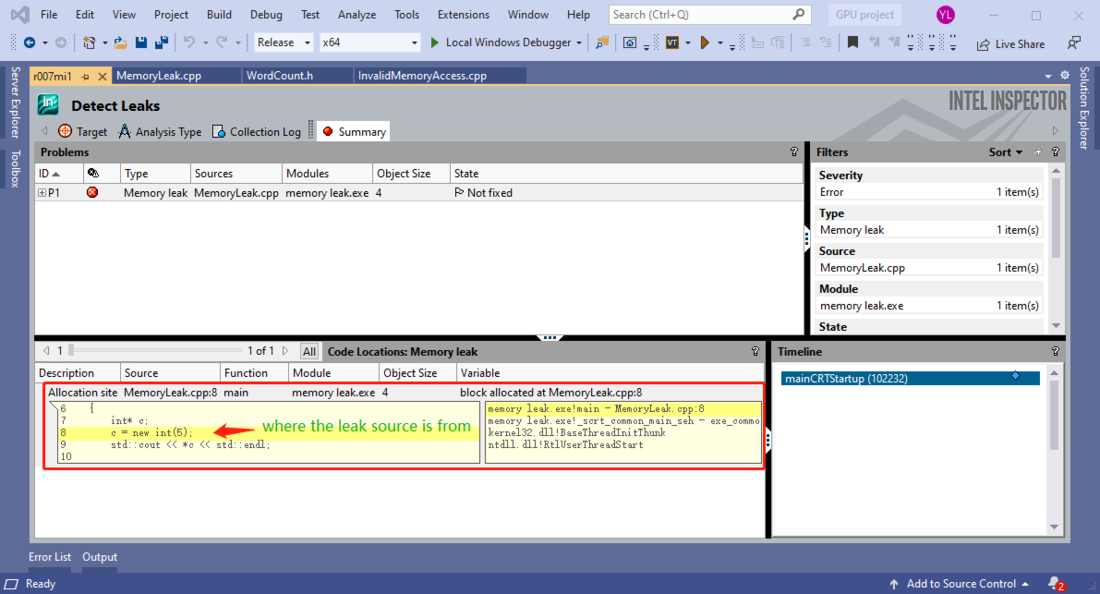
As we can see the variable 'c' is assigned a heap resource but never deallocate. We run this program in Intel Inspector
The inspection result shows where the leak resource comes from and its location in the code.
Invalid Memory Access
A special program is used as an example in this section. The inspection on the TBB parallel_for workshop perfectly demonstrates the compatibility of Intel Inspector towards Threading Building Blocks algorithm.
#ifndef WORDCOUNT_H_
#define WORDCOUNT_H_

#include <tbb/tbb.h>

typedef bool (*Delimiter)(char);

class WordCount {
	const char* string;
	int* const stringSize;
	int* const numberOfWord;
	int number;
	Delimiter delimiter;

public:
	WordCount(const char* str, int* const size, int* const numb, int numChar, const Delimiter del): stringSize(size), numberOfWord(numb){
		string = str;
		number = numChar;
		delimiter = del;
	}

	void operator()(const tbb::blocked_range<int>& r)const {
		for (auto i = r.begin(); i != r.end(); i++) { // the loop only stops when i exactly equals to r.end()
			if (!delimiter(string[i])) {
				int s = 0;
				while (i + s < number && !delimiter(string[i + s])) s++;
				stringSize[i] = s;
				int n = 0;
				for (int j = i + s + 1; j + s < number; j++) {
					bool bad = false;
					for (int k = 0;
						k < s && k + i < number && k + j < number; k++) {
						if (string[i + k] != string[j + k]) {
							bad = true;
							break;
						}
					}
					if (!bad && delimiter(string[j + s])) n++;
				}
				numberOfWord[i] = n;
			}
			else {
				stringSize[i] = 0;
				numberOfWord[i] = 0;
			}
			i += stringSize[i]; //may jump and sit on outside of the array but still satisfies
                                //the loop control clause "i != r.end()"
		}
	}
};
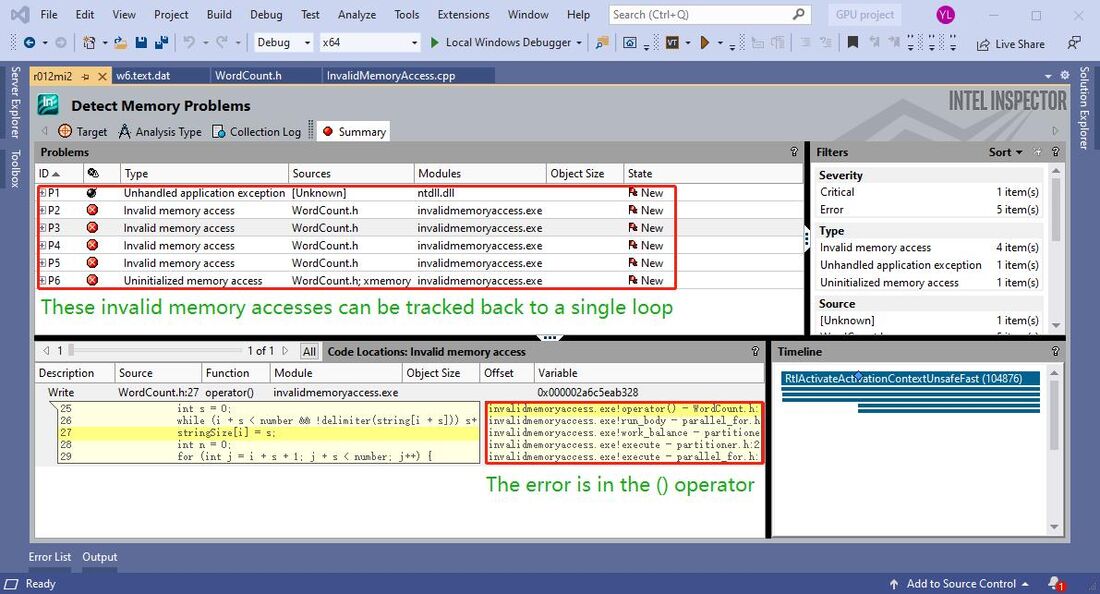
Inspection result
The Intel Inspector locates the error that comes from the loop inside the functor used by the tbb::parallel_for() function. All the references of the location being illegally accessing are marked as errors, which indicates the error happens during a specific iteration of the loop. However, this inspection has an extremely high memory overhead which makes the analysis time a thousand times longer than the normal run.
Memory Growth
In application development, unexpected memory growth causes a lot of problems and it is very hard to locate since for most of the time it is not considered an error. By using Intel Inspector, we can quickly locate all potential lines that may be the cause of memory growth.
#include <iostream>
#include <vector>
#include <thread>

class PlaceHolder {
   int array[10000]{10};
};


int main()
{
   int n = 1000;
   std::vector<PlaceHolder> collection;
   for (int i = 0; i < n; i++) {
      collection.push_back(PlaceHolder()); //keep allocating heap memory
      std::this_thread::sleep_for(std::chrono::milliseconds(200));
   }

   return 0;
}
Thread problems
Race Condition
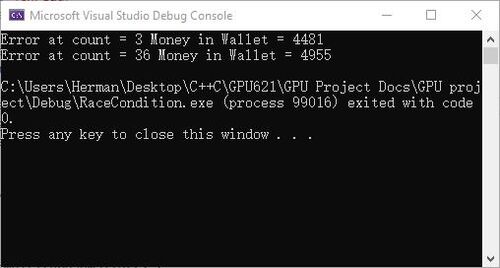
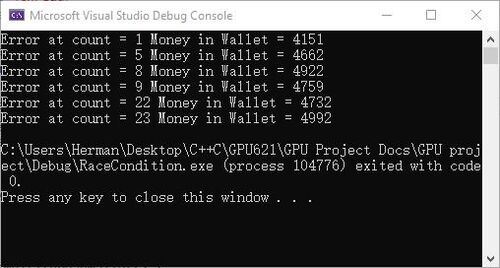
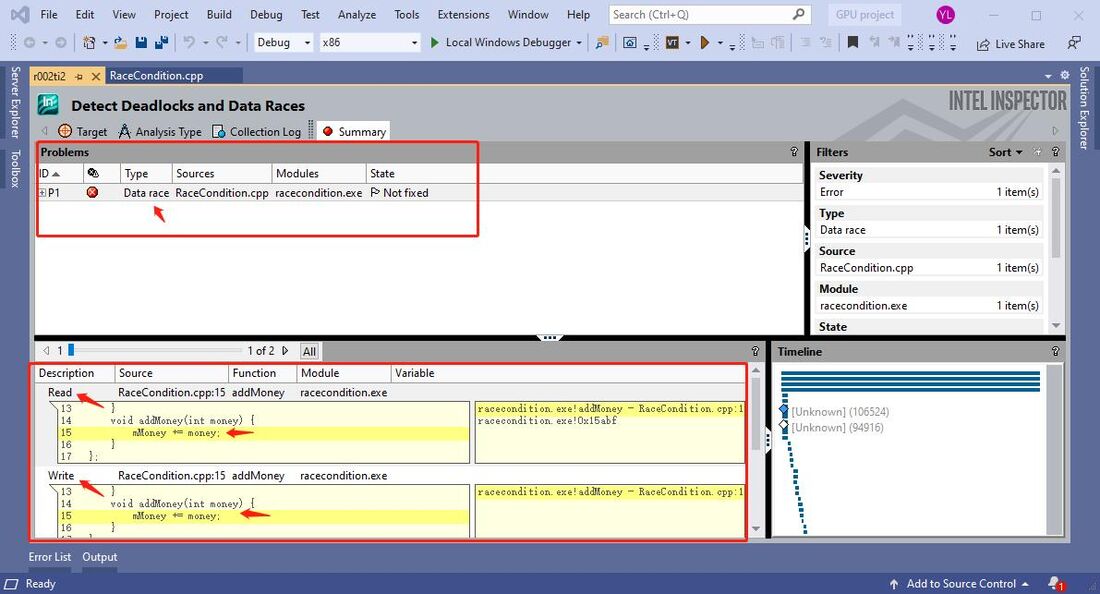
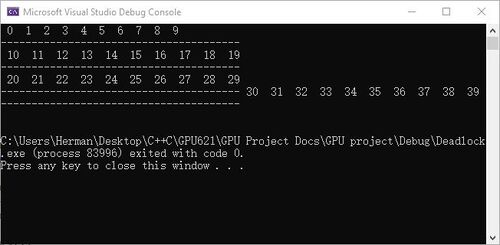
The following program is used to demonstrate the race condition detection in Intel Inspector. In this program, 5 threads are competing to update the 'wallet' object without a lock. The compiler does not see competition as an error and the program always runs successfully. However, the race condition makes the program different results (inconsistent output). A data race is hard to locate manually but with Intel Inspector, it is easy and quick.
int main()
#include <iostream>
#include <thread>
#include <vector>

class Wallet {
	int mMoney;
public:
	Wallet() :mMoney(0) {}
	int getMoney() {
		return mMoney;
	}
	void addMoney(int money) {
		mMoney += money;
	}
};

int testMultithreadWallet() {
	Wallet wallet;
	int threadNum = 5;
	std::vector<std::thread> threads;
	//Create 5 threads and push to the vector
	for (int i = 0; i < threadNum; i++) {
		threads.push_back(
			//Create a thread and run its lamda function
			std::thread([&]() -> void {
				//Call the addMoney 1000 time to add money to the wallet, add 1 dollar each time
				for (int i = 0; i < 1000; i++) {
					wallet.addMoney(1);
				}
				})
		);
	}
	//Join all threads back to main thread
	for (int i = 0; i < threadNum; i++) {
		threads.at(i).join();
	}
	return wallet.getMoney();
}


int main() {
	int result = 0;
	//Run the testMultithreadWallet function 50 times to get the race condition result
	for (int k = 0; k < 50; k++) {
		//The result should be 5000, if not, print the error result
		if ((result = testMultithreadWallet()) != 5000) {
			std::cout << "Error at count = " << k << " Money in Wallet = " << result << std::endl;
		}
	}
	return 0;
}
Incorrect results generated by the race condition code.
Inspection summary by Intel Inspector
Using Intel Inspector, data race is quickly detected and located.
Deadlock
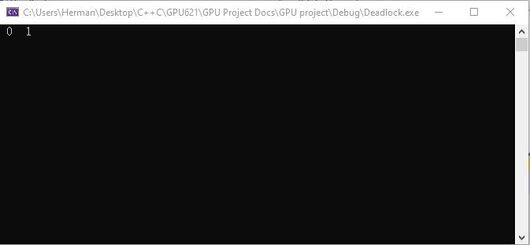
Deadlock is another common error that we encounter when developing multi-threading solutions. The cause of deadlock is one or multiple threads that acquiring resources. Simultaneously, resources that being acquired are locked by other threads that are acquiring resources being locked by the previous threads. The situation causes infinite wait time and the program crashes. Deadlock does not happen in each run of the program, sometimes the program runs successfully, but there is a big chance the program will run into a deadlock.
The following program uses the Mutex template to create a deadlock scenario.
#include <iostream>
#include <mutex>
#include <thread>

using namespace std;
const int SIZE = 10;

mutex  Mutex1, Mutex2;

void even_thread_print(int i)
{
   lock_guard<mutex> g1(Mutex1);
   lock_guard<mutex> g2(Mutex2);
   cout << " " << i << " ";
}

void odd_thread_print(int i)
{
   lock_guard<mutex> g2(Mutex2);
   lock_guard<mutex> g1(Mutex1);
   cout << " " << i << " ";
}


void print(int n)
{
   for (int i = SIZE * (n - 1); i < SIZE * n; i++) {
      if (n % 2 == 0) {
         even_thread_print(i);
      }
      else
         odd_thread_print(i);

   }
   cout << endl;
   cout << "---------------------------------------" << endl;
}

int main()
{
   thread t1(print, 1);  // print 0-9
   thread t2(print, 2);  // print 10-19
   thread t3(print, 3);  // print 20-29
   thread t4(print, 4);  // print 30-39

   t1.join();
   t2.join();
   t3.join();
   t4.join();

   return 0;
}
Program Outputs (Correct output and encounters deadlock)
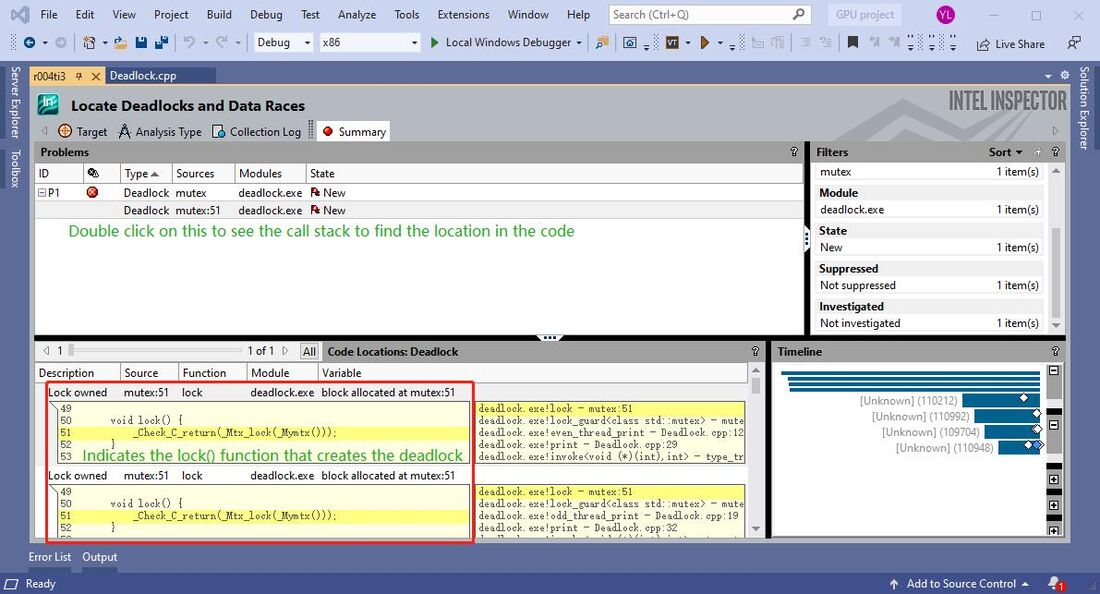
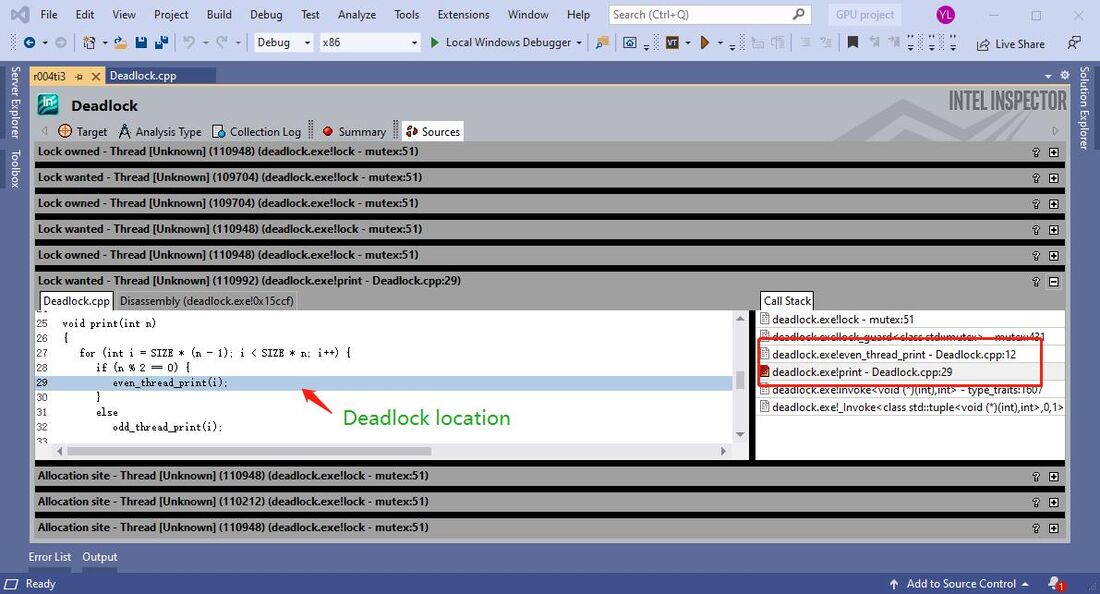
Intel Inspector result
With the use of Intel Inspector, the deadlock is quickly detected and located. By tracing the call stack we know which locations in our source code produced the deadlock.
Resources
https://software.intel.com/content/www/us/en/develop/tools/inspector.html
Progress
Update 1: Sunday, Nov 8, 2020 - Created home page.
Update 2: Friday, Nov 13, 2020 - Created features section.
Update 3: Saturday, Nov 14, 2020 - Worked on creating and referencing error programs for use case demonstrations.
Update 4: Monday, Nov 16, 2020 - Created "how to use" section.
Update 5: Tuesday, Nov 17, 2020 - All error codes for the use case scenario are complete.
Update 6: Wednesday, Nov 18, 2020 - Created use case sections.
Update 7: Friday, Nov 20, 2020 - Minor fixes
Update 8: Wednesday, Nov 25, 2020 - Minor fixes
