Difference between revisions of "GPU621/Sentinel"
(→Setting up a Solution in Visual Studio 2017 Comunity Edition) |
m (Add the shortcuts to access the tools) |
||
| (13 intermediate revisions by 3 users not shown) | |||
| Line 24: | Line 24: | ||
Visual Studio provides the developers with a variety of tools to assist with the multithreaded application debugging: | Visual Studio provides the developers with a variety of tools to assist with the multithreaded application debugging: | ||
| − | 1. '''Threads window''' - Allows to view and manipulate the threads, also provides partial call stack for each of the threads | + | 1. '''Threads window''' - Allows to view and manipulate the threads, also provides partial call stack for each of the threads (Debug -> Windows -> Threads or Ctrl+Alt+H) |
| − | 2. '''Thread markers''' - Icon resembling two cloth threads indicating where a thread is stopped. Provides a DataTip containing the name and thread ID, as well as thread manipulation shortcut menu | + | 2. '''Thread markers''' - Icon resembling two cloth threads indicating where a thread is stopped. Provides a DataTip containing the name and thread ID, as well as thread manipulation shortcut menu |
| − | 3. '''Parallel Stacks window''' - Shows call stack information for all the threads in the program | + | 3. '''Parallel Stacks window''' - Shows call stack information for all the threads in the program (Debug -> Windows -> Parallel Stacks or Ctrl + Shift + D, S) |
| − | 4. '''Parallel Watch window''' - Tracks the values produced by the multithreaded expression | + | 4. '''Parallel Watch window''' - Tracks the values produced by the multithreaded expression (Debug -> Windows -> Parallel Watch -> Parallel Watch n or Ctrl + Shift + D, watch number) |
5. '''Debug Location toolbar''' - Allows manipulating threads and processes | 5. '''Debug Location toolbar''' - Allows manipulating threads and processes | ||
| − | 6. '''Tasks window''' - Lists all the current parallel and scheduled tasks | + | 6. '''Tasks window''' - Lists all the current parallel and scheduled tasks (Debug -> Windows -> Tasks or Ctrl + Shift + D, K) |
| − | 7. '''GPU Threads window''' - Allows working with the GPU threads | + | 7. '''GPU Threads window''' - Allows working with the GPU threads (Debug -> Windows -> GPU Threads) |
| − | 8. '''Attach to Process dialog box''' - Allows the developer to attach the VS debugger to the process, enables the process debugging | + | 8. '''Attach to Process dialog box''' - Allows the developer to attach the VS debugger to the process, enables the process debugging (Debug -> Attach to Process... or Ctrl + Alt + P) |
| − | + | ||
| − | 9. '''Processes window''' - Lists all the processes currently attached to the debugger | + | 9. '''Processes window''' - Lists all the processes currently attached to the debugger (Debug -> Windows -> Processes or Ctrl + Alt + Z) |
The tools mentioned above can be divided into the following categories depending on the multithreading technique: | The tools mentioned above can be divided into the following categories depending on the multithreading technique: | ||
| − | 1. Threads - Threads windows, Thread markers, Parallel Stacks window, Parallel Parallel Watch window, Debug Location toolbar | + | 1. '''Threads''' - Threads windows, Thread markers, Parallel Stacks window, Parallel Parallel Watch window, Debug Location toolbar |
| − | 2. Tasks - Parallel Stacks window, Parallel Watch window, Tasks window | + | 2. '''Tasks''' - Parallel Stacks window, Parallel Watch window, Tasks window |
| − | 3. GPU Threads - GPU Threads window | + | 3. '''GPU Threads''' - GPU Threads window |
| − | 4. Processes - Attach to Process dialog, Processes window, Debug Location toolbar | + | 4. '''Processes''' - Attach to Process dialog, Processes window, Debug Location toolbar |
For our project, we are going to do OpenMP debugging, so we will need the following tools: | For our project, we are going to do OpenMP debugging, so we will need the following tools: | ||
* Breakpoints | * Breakpoints | ||
| − | * | + | * Locals |
* Thread markers | * Thread markers | ||
| − | |||
* Parallel Watch window | * Parallel Watch window | ||
| − | |||
| − | |||
== Basic Debugging Steps == | == Basic Debugging Steps == | ||
| − | # | + | # Set up a Solution in Visual Studio 2017 |
# Build in Debug mode | # Build in Debug mode | ||
# Double-check the outputs | # Double-check the outputs | ||
| − | # Start where the bug is | + | # Start where the bug is by placing a breakpoint |
==Setting up a Solution in Visual Studio 2017 Comunity Edition== | ==Setting up a Solution in Visual Studio 2017 Comunity Edition== | ||
| Line 72: | Line 69: | ||
1. Create a new project and select the properties. | 1. Create a new project and select the properties. | ||
| − | [[File: Properties.png | | + | |
| − | 2. Click the configuration manager at the top right of your properties window. | + | [[File: Properties.png | 300px]] |
| − | 3. Create a new configuration [[File: | + | |
| − | 4. Copy your current configuration for the current project (with the working openMP solution) and give the new configuration a nice name[[File: Copy_Old_Configuration| | + | 2. Click the configuration manager at the top right of your properties window. |
| − | 5. Go to the C/C++ configuration and then select optimization. Ensure that optimization is turned '''off''' for debugging.[[File:Optimization_Off]] | + | |
| + | 3. Create a new configuration | ||
| + | |||
| + | [[File: New_Configuration.png | 300px]] | ||
| + | |||
| + | 4. Copy your current working openMP configuration for the current project (with the working openMP solution) and give the new configuration a nice name | ||
| + | |||
| + | [[File: Copy_Old_Configuration.png | 300px]]. | ||
| + | |||
| + | 5. Go to the C/C++ configuration and then select optimization. Ensure that optimization is turned '''off''' for debugging. | ||
| + | |||
| + | [[File: Optimization_Off.png | 300px]] | ||
| + | |||
| + | 6. Finally, ensure that all threads stop when hitting a breakpoint by editing the debug configuration and enabling the setting Break all processes when one process breaks. | ||
| + | |||
| + | [[File:BreakAll.png|300px]] | ||
== How to Debug Multithreaded Application in VS == | == How to Debug Multithreaded Application in VS == | ||
| − | + | == '''Tools'''== | |
| − | + | ||
| + | [[File:debug-windows.JPG | 900px]] | ||
| + | |||
| + | When working with the debugger in VS to debug a multi-threaded application, the two most important windows are: Locals window (on the left), and the Parallel Watch window (on the right). On the Locals window, you'll see all your local variable that are declared and visible in the current scope of where the breakpoint is set. On the Parallel Watch window, you'll see all the threads that have spawned and the *yellow arrow* on the left of the thread number is which thread's local variables you're viewing in the Locals window. Double click on another thread number and you'll see it's local variables in the Locals window. We will work with these windows in the coming walkthrough | ||
| + | |||
| + | == '''Walkthrough'''== | ||
| − | + | In order to help sink in the knowledge on how to use the debugger, the group will conduct a workshop. For our intents and purposes, the code is very short and simple. Your job is to find the bug with the variable "sum" and investigate why it doesn't have the correct value using the debugger. You might find the bug right off-the-bat but the point is to use the debugger to find it or put you in the right path as to what the bug might be. You can download the code file from here: [https://wiki.cdot.senecacollege.ca/w/imgs/Workshop.txt Workshop.cpp] | |
Latest revision as of 18:14, 25 November 2018
Contents
Multithreaded Application Debugging in Visual Studio
- The project is based on the material outlined in "Debug multithreaded applications in Visual Studio" section of MSDN documentation and other related MSDN documentation.
Group Members
Introduction
Multithreaded applications debugging overview
Debugging is one of the crucial software development stages. While all of us know the importance and the basics of debugging in the Visual Studio, debugging the multithreaded applications is more complicated than that of the serial programs we were used to before. The first problem of the multithreaded debugging is keeping track of multiple threads instead of just one as we did with the serial programs. Secondly, having multiple threads introduces new kinds of bugs and issues that can seriously affect the output of the software. Such issues include race conditions and deadlocks. A race condition is the behavior of the system when the output is dependent on the sequence of other events or commands. It becomes a bug when the events are out of order (Race condition wiki). Deadlock is a situation when each member of the group (a group of threads in our case) is waiting for some other member to take action, it typically happens when mutual exclusion is executed incorrectly, and the lock on the resource cannot be released (Deadlock wiki).
Visual Studio tools for multithreaded debugging
Visual Studio provides the developers with a variety of tools to assist with the multithreaded application debugging:
1. Threads window - Allows to view and manipulate the threads, also provides partial call stack for each of the threads (Debug -> Windows -> Threads or Ctrl+Alt+H)
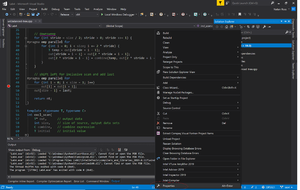
2. Thread markers - Icon resembling two cloth threads indicating where a thread is stopped. Provides a DataTip containing the name and thread ID, as well as thread manipulation shortcut menu
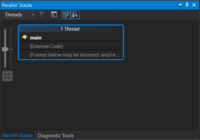
3. Parallel Stacks window - Shows call stack information for all the threads in the program (Debug -> Windows -> Parallel Stacks or Ctrl + Shift + D, S)
4. Parallel Watch window - Tracks the values produced by the multithreaded expression (Debug -> Windows -> Parallel Watch -> Parallel Watch n or Ctrl + Shift + D, watch number)
5. Debug Location toolbar - Allows manipulating threads and processes
6. Tasks window - Lists all the current parallel and scheduled tasks (Debug -> Windows -> Tasks or Ctrl + Shift + D, K)
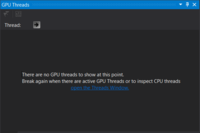
7. GPU Threads window - Allows working with the GPU threads (Debug -> Windows -> GPU Threads)
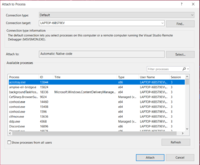
8. Attach to Process dialog box - Allows the developer to attach the VS debugger to the process, enables the process debugging (Debug -> Attach to Process... or Ctrl + Alt + P)
9. Processes window - Lists all the processes currently attached to the debugger (Debug -> Windows -> Processes or Ctrl + Alt + Z)
The tools mentioned above can be divided into the following categories depending on the multithreading technique:
1. Threads - Threads windows, Thread markers, Parallel Stacks window, Parallel Parallel Watch window, Debug Location toolbar
2. Tasks - Parallel Stacks window, Parallel Watch window, Tasks window
3. GPU Threads - GPU Threads window
4. Processes - Attach to Process dialog, Processes window, Debug Location toolbar
For our project, we are going to do OpenMP debugging, so we will need the following tools:
- Breakpoints
- Locals
- Thread markers
- Parallel Watch window
Basic Debugging Steps
- Set up a Solution in Visual Studio 2017
- Build in Debug mode
- Double-check the outputs
- Start where the bug is by placing a breakpoint
Setting up a Solution in Visual Studio 2017 Comunity Edition
This tutorial begins after the installation and setup of Intel Parallel Studios. Also, you should already have openMP running properly on your setup.
1. Create a new project and select the properties.
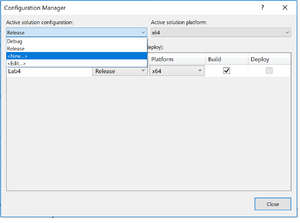
2. Click the configuration manager at the top right of your properties window.
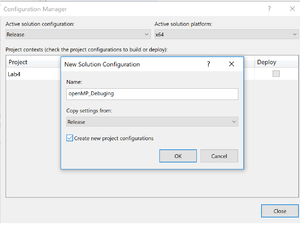
3. Create a new configuration
4. Copy your current working openMP configuration for the current project (with the working openMP solution) and give the new configuration a nice name
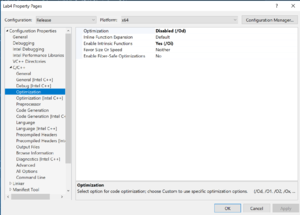
5. Go to the C/C++ configuration and then select optimization. Ensure that optimization is turned off for debugging.
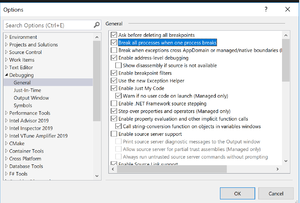
6. Finally, ensure that all threads stop when hitting a breakpoint by editing the debug configuration and enabling the setting Break all processes when one process breaks.
How to Debug Multithreaded Application in VS
Tools
When working with the debugger in VS to debug a multi-threaded application, the two most important windows are: Locals window (on the left), and the Parallel Watch window (on the right). On the Locals window, you'll see all your local variable that are declared and visible in the current scope of where the breakpoint is set. On the Parallel Watch window, you'll see all the threads that have spawned and the *yellow arrow* on the left of the thread number is which thread's local variables you're viewing in the Locals window. Double click on another thread number and you'll see it's local variables in the Locals window. We will work with these windows in the coming walkthrough
Walkthrough
In order to help sink in the knowledge on how to use the debugger, the group will conduct a workshop. For our intents and purposes, the code is very short and simple. Your job is to find the bug with the variable "sum" and investigate why it doesn't have the correct value using the debugger. You might find the bug right off-the-bat but the point is to use the debugger to find it or put you in the right path as to what the bug might be. You can download the code file from here: Workshop.cpp

