Difference between revisions of "Studyapplocator"
(→Assignment 3) |
(→Presentation) |
||
| (8 intermediate revisions by the same user not shown) | |||
| Line 322: | Line 322: | ||
for (unsigned x = 0; x < IMG_RES; ++x) { | for (unsigned x = 0; x < IMG_RES; ++x) { | ||
int k = x + y * IMG_RES; | int k = x + y * IMG_RES; | ||
| − | float | + | float xxPoints = (2 * ((x + 0.5) * iwidth) - 1) * viewangle * aspectratio; |
| − | float | + | float yyPoints = (1 - 2 * ((y + 0.5) * iheight)) * viewangle; |
| − | Vec3f | + | Vec3f rayDirection, rayOrigin; |
| − | + | rayDirection.init(xxPoints, yyPoints, -1); | |
| − | + | rayDirection.normalize(); | |
| − | + | rayOrigin.init(0); | |
| − | trace( | + | |
| + | // Begin tracing // | ||
| + | trace(rayOrigin, rayDirection, 0, pixel, sphere, k); | ||
} | } | ||
} | } | ||
| Line 398: | Line 400: | ||
= Assignment 3 = | = Assignment 3 = | ||
| − | In this assignment we decided to enhance memory access to a vital data point which decreased the run time of the render kernel by half. This effect is shown in the graph below: | + | In this assignment we decided to enhance memory access to a vital data point which decreased the run time of the render kernel by almost half. This effect is shown in the graph below: |
[[File:optimizedExcel.jpg]] | [[File:optimizedExcel.jpg]] | ||
We can see the difference of run times in the kernel from the Nvidia Visual Profiler | We can see the difference of run times in the kernel from the Nvidia Visual Profiler | ||
| − | ===Image Resolution at 512=== | + | ===Optimized Image Resolution Results at 512=== |
[[File:512Optimized.jpg]] | [[File:512Optimized.jpg]] | ||
| − | ===Image Resolution at | + | |
| + | ===Optimized Image Resolution Results at 1024=== | ||
[[File:1024Optimized.jpg]] | [[File:1024Optimized.jpg]] | ||
| − | ===Image Resolution at | + | |
| + | ===Optimized Image Resolution Results at 2048=== | ||
[[File:2048Optimized.jpg]] | [[File:2048Optimized.jpg]] | ||
| − | ===Image Resolution at | + | |
| + | ===Optimized Image Resolution Results at 4096=== | ||
[[File:4096Optimized.jpg]] | [[File:4096Optimized.jpg]] | ||
Although there are more ways to optimize the code by better using available GPU resources, like using more available bandwidth, using more cores depending on compute capability, having better memcpy efficiency. For simplicity we decided to reduce memory access times as it was the main area where the kernel was spending most of its time as indicated by the nvvp profiles we collected. | Although there are more ways to optimize the code by better using available GPU resources, like using more available bandwidth, using more cores depending on compute capability, having better memcpy efficiency. For simplicity we decided to reduce memory access times as it was the main area where the kernel was spending most of its time as indicated by the nvvp profiles we collected. | ||
| + | |||
| + | = Presentation = | ||
| + | [[File:Presentation.pdf]] | ||
Latest revision as of 13:33, 22 April 2018
Studyapplocator
Team Members
Assignment 1
Sudoku
What is Sudoku?
It is a puzzle game where players insert number on a grid consisting of squares with equal number of smaller squares inside. Most games consist of 9x9 grid with higher difficulty and run-time at bigger sizes and more missing numbers. The rules of the game are to insert numbers in such a way that every number appears once in each horizontal and vertical line and the inner square.
Profiling and Analysis
The following program was run on Matrix command line without any modification to the original code.
Easy Problem
command: ./Sudoku sample-puzzle-1

Input:

0 6 0 0 0 0 9 7 2
0 5 0 0 0 2 0 0 3
0 7 0 3 9 0 5 0 0
2 0 0 0 0 5 4 0 8
0 0 0 0 0 0 0 0 0
3 0 1 8 0 0 0 0 6
0 0 4 0 2 3 0 8 0
7 0 0 9 0 0 0 2 0
9 2 5 0 0 0 0 4 0

Solution:

1 6 3 4 5 8 9 7 2
4 5 9 7 1 2 8 6 3
8 7 2 3 9 6 5 1 4
2 9 7 1 6 5 4 3 8
5 8 6 2 3 4 1 9 7
3 4 1 8 7 9 2 5 6
6 1 4 5 2 3 7 8 9
7 3 8 9 4 1 6 2 5
9 2 5 6 8 7 3 4 1
Flat Profile - Easy
From this flat profile we can see that most of the functions being called were for checks of rows and columns with the third most called function being placeNum(int,int). As the problem complexity was low, the program completed quickly with far less calls compared to the hard problem.
Flat profile:
Each sample counts as 0.01 seconds.
no time accumulated
 %   cumulative   self              self     total
time   seconds   seconds    calls  Ts/call  Ts/call  name
 0.00      0.00     0.00     4539     0.00     0.00  checkRow(int, int)
 0.00      0.00     0.00     1620     0.00     0.00  checkColumn(int, int)
 0.00      0.00     0.00     1120     0.00     0.00  placeNum(int, int)
 0.00      0.00     0.00      698     0.00     0.00  checkSquare(int, int, int)
 0.00      0.00     0.00      476     0.00     0.00  goBack(int&, int&)
 0.00      0.00     0.00        2     0.00     0.00  print(int (*) [9])
 0.00      0.00     0.00        1     0.00     0.00  _GLOBAL__sub_I_sudoku
 0.00      0.00     0.00        1     0.00     0.00  _GLOBAL__sub_I_temp
 0.00      0.00     0.00        1     0.00     0.00  solveSudoku()
 0.00      0.00     0.00        1     0.00     0.00  storePositions()
 0.00      0.00     0.00        1     0.00     0.00  __static_initialization_and_destruction_0(int, int)
 0.00      0.00     0.00        1     0.00     0.00  __static_initialization_and_destruction_0(int, int)
Granularity - Easy
The call graph gives us a further breakdown of the program and the number of calls that were made to the functions in order to solve the easy puzzle.
Call graph

granularity: each sample hit covers 4 byte(s) no time propagated

index % time    self  children    called     name
                0.00    0.00    4539/4539        placeNum(int, int) [7]
[5]      0.0    0.00    0.00    4539             checkRow(int, int) [5]
-----------------------------------------------
                0.00    0.00    1620/1620        placeNum(int, int) [7]
[6]      0.0    0.00    0.00    1620             checkColumn(int, int) [6]
-----------------------------------------------
                0.00    0.00    1120/1120        solveSudoku() [13]
[7]      0.0    0.00    0.00    1120             placeNum(int, int) [7]
                0.00    0.00    4539/4539        checkRow(int, int) [5]
                0.00    0.00    1620/1620        checkColumn(int, int) [6]
                0.00    0.00     698/698         checkSquare(int, int, int) [8]
-----------------------------------------------
                0.00    0.00     698/698         placeNum(int, int) [7]
[8]      0.0    0.00    0.00     698             checkSquare(int, int, int) [8]
-----------------------------------------------
                0.00    0.00     476/476         solveSudoku() [13]
[9]      0.0    0.00    0.00     476             goBack(int&, int&) [9]
-----------------------------------------------
                0.00    0.00       2/2           main [4]
[10]     0.0    0.00    0.00       2             print(int (*) [9]) [10]
-----------------------------------------------
                0.00    0.00       1/1           __do_global_ctors_aux [22]
[11]     0.0    0.00    0.00       1             _GLOBAL__sub_I_sudoku [11]
                0.00    0.00       1/1           __static_initialization_and_destruction_0(int, int) [15]
-----------------------------------------------
                0.00    0.00       1/1           __do_global_ctors_aux [22]
[12]     0.0    0.00    0.00       1             _GLOBAL__sub_I_temp [12]
                0.00    0.00       1/1           __static_initialization_and_destruction_0(int, int) [16]
-----------------------------------------------
                0.00    0.00       1/1           main [4]
[13]     0.0    0.00    0.00       1             solveSudoku() [13]
                0.00    0.00    1120/1120        placeNum(int, int) [7]
                0.00    0.00     476/476         goBack(int&, int&) [9]
-----------------------------------------------
                0.00    0.00       1/1           main [4]
[14]     0.0    0.00    0.00       1             storePositions() [14]
-----------------------------------------------
                0.00    0.00       1/1           _GLOBAL__sub_I_sudoku [11]
[15]     0.0    0.00    0.00       1             __static_initialization_and_destruction_0(int, int) [15]
-----------------------------------------------
                0.00    0.00       1/1           _GLOBAL__sub_I_temp [12]
[16]     0.0    0.00    0.00       1             __static_initialization_and_destruction_0(int, int) [16]
-----------------------------------------------

Index by function name

  [11] _GLOBAL__sub_I_sudoku  [13] solveSudoku()          [10] print(int (*) [9])
  [12] _GLOBAL__sub_I_temp    [14] storePositions()        [9] goBack(int&, int&)
   [6] checkColumn(int, int)  [15] __static_initialization_and_destruction_0(int, int) [5] checkRow(int, int)
   [8] checkSquare(int, int, int) [16] __static_initialization_and_destruction_0(int, int) [7] placeNum(int, int)
Hard Problem
command: ./Sudoku sample-puzzle-2-hard

Input:

0 0 0 0 0 0 0 0 0
0 0 0 0 0 3 0 8 5
0 0 1 0 2 0 0 0 0
0 0 0 5 0 7 0 0 0
0 0 4 0 0 0 1 0 0
0 9 0 0 0 0 0 0 0
5 0 0 0 0 0 0 7 3
0 0 2 0 1 0 0 0 0
0 0 0 0 4 0 0 0 9

Output:

9 8 7 6 5 4 3 2 1
2 4 6 1 7 3 9 8 5
3 5 1 9 2 8 7 4 6
1 2 8 5 3 7 6 9 4
6 3 4 8 9 2 1 5 7
7 9 5 4 6 1 8 3 2
5 1 9 2 8 6 4 7 3
4 7 2 3 1 9 5 6 8
8 6 3 7 4 5 2 1 9
Flat Profile - Hard
From this flat profile we can see how the number of calls exploded as the complexity of the puzzle was increased with more missing numbers without changing the size of the grid. If the grid size was increased with an equal amount of missing numbers then the program would take far longer to complete with exponentially higher number of calls. As the problem became more complex, the previously low called functions in the easy version, checkSquare and goBack had a sudden spike in usage.
Flat profile:

Each sample counts as 0.01 seconds.
  %   cumulative   self              self     total
 time   seconds   seconds    calls   s/call   s/call  name
 46.41     21.66    21.66 622577597     0.00     0.00  checkRow(int, int)
 19.43     30.73     9.07 223365661     0.00     0.00  checkColumn(int, int)
 15.31     37.88     7.14 157353814     0.00     0.00  placeNum(int, int)
 13.11     43.99     6.12 100608583     0.00     0.00  checkSquare(int, int, int)
  3.10     45.44     1.45 69175252      0.00     0.00  goBack(int&, int&)
  2.64     46.67     1.23        1      1.23    46.67  solveSudoku()
  0.00     46.67     0.00        2      0.00     0.00  print(int (*) [9])
  0.00     46.67     0.00        1      0.00     0.00  _GLOBAL__sub_I_sudoku
  0.00     46.67     0.00        1      0.00     0.00  _GLOBAL__sub_I_temp
  0.00     46.67     0.00        1      0.00     0.00  storePositions()
  0.00     46.67     0.00        1      0.00     0.00  __static_initialization_and_destruction_0(int, int)
  0.00     46.67     0.00        1      0.00     0.00  __static_initialization_and_destruction_0(int, int)
Granularity - Hard
The call graph gives us a more detailed look on where exactly most of the time was spent in solving the hard puzzle problem and which areas can be possible candidates for optimization.
Call graph

granularity: each sample hit covers 4 byte(s) for 0.02% of 46.67 seconds

index % time    self  children    called     name
                                                 <spontaneous>
[1]    100.0    0.00   46.67                         main [1]
                1.23   45.44       1/1               solveSudoku() [2]
                0.00    0.00       2/2               print(int (*) [9]) [11]
                0.00    0.00       1/1               storePositions() [14]
-----------------------------------------------
                1.23   45.44       1/1               main [1]
[2]    100.0    1.23   45.44       1                 solveSudoku() [2]
                7.14   36.85 157353814/157353814     placeNum(int, int) [3]
                1.45    0.00 69175252/69175252       goBack(int&, int&) [7]
-----------------------------------------------
                7.14   36.85 157353814/157353814     solveSudoku() [2]
[3]     94.3    7.14   36.85 157353814               placeNum(int, int) [3]
               21.66    0.00 622577597/622577597     checkRow(int, int) [4]
                9.07    0.00 223365661/223365661     checkColumn(int, int) [5]
                6.12    0.00 100608583/100608583     checkSquare(int, int, int) [6]
-----------------------------------------------
               21.66    0.00 622577597/622577597     placeNum(int, int) [3]
[4]     46.4   21.66    0.00 622577597               checkRow(int, int) [4]
-----------------------------------------------
                9.07    0.00 223365661/223365661     placeNum(int, int) [3]
[5]     19.4    9.07    0.00 223365661               checkColumn(int, int) [5]
-----------------------------------------------
                6.12    0.00 100608583/100608583     placeNum(int, int) [3]
[6]     13.1    6.12    0.00 100608583               checkSquare(int, int, int) [6]
-----------------------------------------------
                1.45    0.00 69175252/69175252       solveSudoku() [2]
[7]      3.1    1.45    0.00 69175252                goBack(int&, int&) [7]
-----------------------------------------------
                0.00    0.00       2/2               main [1]
[11]     0.0    0.00    0.00       2                 print(int (*) [9]) [11]
-----------------------------------------------
                0.00    0.00       1/1               __do_global_ctors_aux [22]
[12]     0.0    0.00    0.00       1                _GLOBAL__sub_I_sudoku [12]
                0.00    0.00       1/1              __static_initialization_and_destruction_0(int, int) [15]
-----------------------------------------------
                0.00    0.00       1/1              __do_global_ctors_aux [22]
[13]     0.0    0.00    0.00       1                _GLOBAL__sub_I_temp [13]
                0.00    0.00       1/1              __static_initialization_and_destruction_0(int, int) [16]
-----------------------------------------------
                0.00    0.00       1/1              main [1]
[14]     0.0    0.00    0.00       1                storePositions() [14]
-----------------------------------------------
                0.00    0.00       1/1              _GLOBAL__sub_I_sudoku [12]
[15]     0.0    0.00    0.00       1                __static_initialization_and_destruction_0(int, int) [15]
-----------------------------------------------
                0.00    0.00       1/1             _GLOBAL__sub_I_temp [13]
[16]     0.0    0.00    0.00       1               __static_initialization_and_destruction_0(int, int) [16]
-----------------------------------------------

Index by function name

  [12] _GLOBAL__sub_I_sudoku   [2] solveSudoku()          [11] print(int (*) [9])
  [13] _GLOBAL__sub_I_temp    [14] storePositions()        [7] goBack(int&, int&)
   [5] checkColumn(int, int)  [15] __static_initialization_and_destruction_0(int, int) [4] checkRow(int, int)
   [6] checkSquare(int, int, int) [16] __static_initialization_and_destruction_0(int, int) [3] placeNum(int, int)
Analysis
The program was quite fast and had a really short run time for solving the given problem on a standard 9x9 block. This project was found on GitHub. It is GNU C++ compiler compatible and both the flat profile and call graph were generated on matrix successfully.
For the easy problem, the run time was quick as the inputted grid had more filled cells compared to the hard problem where most of the cells were set to 0. This increased the complexity scope and which is why the program took 46.67 seconds to complete.
From the hard puzzle call graph we can see that the function which could be prime candidates for optimization are the checkRow and checkColumn functions in which the program spends most of its time. Because of the type of mathematical problem set, this Sudoku solver can be an excellent application for a parallelization project.
Ray Tracing
Ray tracing is a rendering technique for generating an image by tracing the path of light as pixels in an image plane and simulating the effects of its encounters with virtual objects. The technique is capable of producing a very high degree of visual realism, usually higher than that of typical scan line rendering methods,but at a grater computational cost.(Wikipedia [1]).
Source Code
Source code taken from this location.[2]
Compile using the following command -
g++ -O2 -std=c++0x -pg raytracer.cpp -o raytracer
Profile using the command
gprof -p -b ./raytracer gmon.out > raytracer.flt
Profile generated
Each sample counts as 0.01 seconds.
 %   cumulative   self              self     total
time   seconds   seconds    calls  us/call  us/call  name
81.82      0.36     0.36   307200     1.17     1.17  trace(Vec3<float> const&, Vec3<float> const&, std::vector<Sphere, std::allocator<Sphere> > const&, int const&)
18.18      0.44     0.08                             render(std::vector<Sphere, std::allocator<Sphere> > const&)
 0.00      0.44     0.00        4     0.00     0.00  void std::vector<Sphere, std::allocator<Sphere> >::_M_insert_aux<Sphere>(__gnu_cxx::__normal_iterator<Sphere*, std::vector<Sphere, std::allocator<Sphere> > >, Sphere&&)
 0.00      0.44     0.00        1     0.00     0.00  _GLOBAL__sub_I__Z3mixRKfS0_S0_
Where to parallelize the program?
From the above profile we can see that the trace function require faster computation time.
Finding the intersection of this ray with the sphere in the scene the algorithm takes a longer .Hence an area to parellelize the program will be here.
for (unsigned i = 0; i < spheres.size(); ++i) {
       float t0 = INFINITY, t1 = INFINITY;
       if (spheres[i].intersect(rayorig, raydir, t0, t1)) {
           if (t0 < 0) t0 = t1;
           if (t0 < tnear) {
               tnear = t0;
               sphere = &spheres[i];
           }
       }
   }
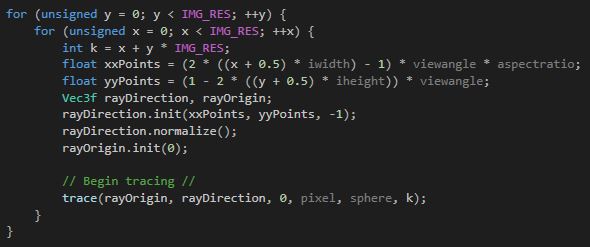
Another area that will be speed up the program would be the render function
      for (unsigned y = 0; y < IMG_RES; ++y) {
		for (unsigned x = 0; x < IMG_RES; ++x) {
			int k = x + y * IMG_RES;
			float xxPoints = (2 * ((x + 0.5) * iwidth) - 1) * viewangle * aspectratio;
			float yyPoints = (1 - 2 * ((y + 0.5) * iheight)) * viewangle;
			Vec3f rayDirection, rayOrigin;
			rayDirection.init(xxPoints, yyPoints, -1);
			rayDirection.normalize();
			rayOrigin.init(0);

			// Begin tracing //
			trace(rayOrigin, rayDirection, 0, pixel, sphere, k);
		}
	}
This function traces the rays for each pixel of the image, traces it and returns a color.
Assignment 2
For our parallelization example we decided on using Ray Tracing as it is the best candidate for optimization based on the code.
Parallelization
After converting a portion of the code to become more parallelized we decided to test the run times of the program at various resolutions. This rendered a picture at a certain quality and at each resolution the run time increased.
Changing the Render function
Instead of using regular C++ indexing in the render() function paralleled using Blocks and Thread indexing.
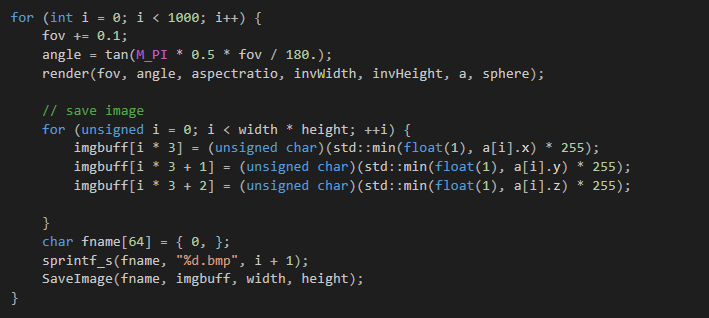
So in the C++ version of the code we had a nested for loop that iterates over the x and the y axis of the image depending on the resolution of the image set.
This was changed to thread based indexing when we changed the render function to the kernel.
Declaring Device pointer
We declared a device pointer to the sphere object and allocated memory for device object and lastly copied the data from host object to the device object.
Setting up the Grid
We allocated the grid of threads based on the image resolution we set the code to render and divide it by the number of threads per block
Launching the Kernel
Instead of calling the render function in the main we changed fucntion render() to a __global__ void render() kernel.
In the end we launch the kernel to render the image and copy the rendered data from device memory to the host memory.
Image resolution 512
Image resolution 1024
Image resolution 2048
Image resolution 4096
Analysis
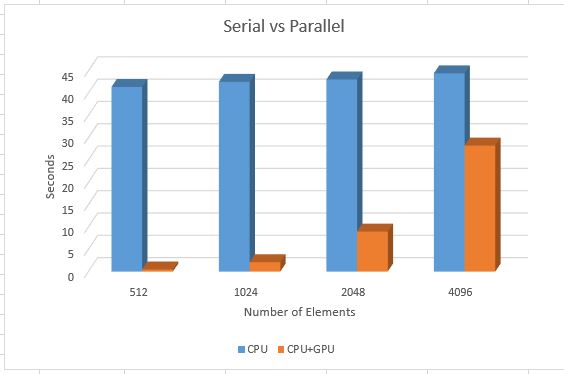
From this chart we can see the significant drop in run time when we switch from serial to parallel processing in ray tracing using CUDA as we double the resolution from 512. There is still room for improvement which will be implemented, and analyzed in assignment 3.
Assignment 3
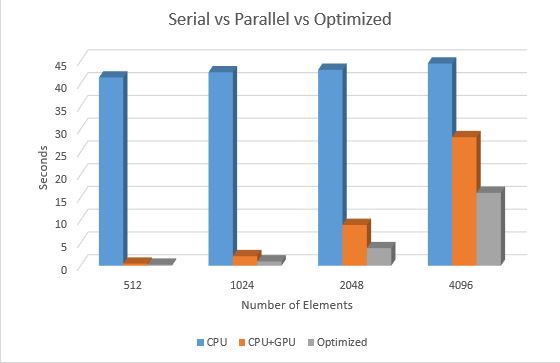
In this assignment we decided to enhance memory access to a vital data point which decreased the run time of the render kernel by almost half. This effect is shown in the graph below:
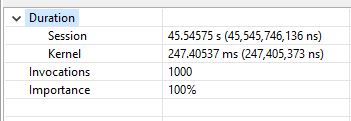
We can see the difference of run times in the kernel from the Nvidia Visual Profiler
Optimized Image Resolution Results at 512
Optimized Image Resolution Results at 1024
Optimized Image Resolution Results at 2048
Optimized Image Resolution Results at 4096
Although there are more ways to optimize the code by better using available GPU resources, like using more available bandwidth, using more cores depending on compute capability, having better memcpy efficiency. For simplicity we decided to reduce memory access times as it was the main area where the kernel was spending most of its time as indicated by the nvvp profiles we collected.
