Difference between revisions of "GPU610/Cosmosis"
(→Neil's Profiling Findings) |
m |
||
| Line 236: | Line 236: | ||
File:Dps915_neil_calls_calc.png|Self Calls | File:Dps915_neil_calls_calc.png|Self Calls | ||
</gallery> | </gallery> | ||
| + | |||
| + | ====Jesse's Profiling Findings==== | ||
| + | Normal 0 false false false EN-US X-NONE X-NONE MicrosoftInternetExplorer4 | ||
| + | |||
| + | Normal 0 false false false EN-US X-NONE X-NONE MicrosoftInternetExplorer4 | ||
| + | |||
| + | I found an iterated approximation of an N-Body project on GitHub at: https://github.com/jrupac/N-body-Simulation. The simulation uses the brute force algorithm with a run-time of O(n^2). It uses SDL to draw squares which represent each body. I have removed all SDL so it only does the calculations. It also has collision detection with other bodies. It still collides with the window sides even though I have removed the window. I also included a high resolution timer by Song Ho Ahn. The timer class can be found at: http://www.cnblogs.com/JohnShao/archive/2011/10/14/2211085.html | ||
| + | |||
| + | '''Testing Environment:''' | ||
| + | |||
| + | * Normal 0 false false false EN-US X-NONE X-NONE MicrosoftInternetExplorer4 Windows: i5 3570K @ 5Ghz | ||
| + | |||
| + | *Raw computations, no graphical visualization | ||
| + | |||
| + | *The velocity of the point is modified. Not a proper force. | ||
| + | |||
| + | *Brute force algoritim for calculation the forces O(N^2) | ||
| + | |||
| + | ====Profile: 512 Samples of 500-1500 Bodies==== | ||
| + | Normal 0 false false false EN-US X-NONE X-NONE MicrosoftInternetExplorer4 | ||
| + | |||
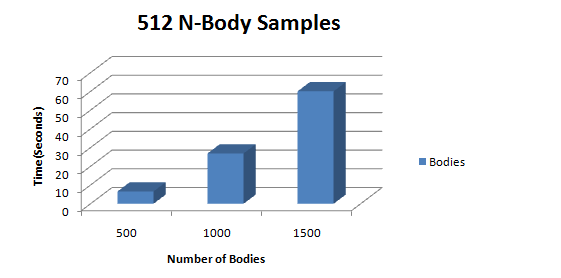
| + | I ran a series of N-Body simulations and sampled each run 512 times. The results are exactly as you would expect for an O(n^2) algorithm; a quadratic increase in time. | ||
| + | |||
| + | [[File:gpu610_jsantos13_samples.png|border]] | ||
| + | |||
| + | ====Analysis:==== | ||
| + | Using Visual Studio 10 profiler, it is clear that the update function is an expensive call path. | ||
| + | |||
| + | [[File:gpu610_jsantos13_vsprofile.png|border]] | ||
| + | |||
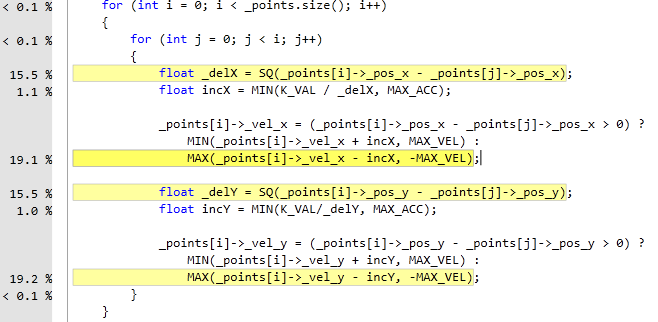
| + | Although the program is an iterated approximation of an N-Body simulation, it is slower than a more proper N-Body simulation. The calculations are incorrect and the majority of them are unnecessary. The update function uses a double for loop to calculate the forces for each particle amongst one another. This is of O(n^2) runtime. | ||
| + | |||
| + | [[File:gpu610_jsantos13_code.png|border]] | ||
| + | |||
| + | ====Summary:==== | ||
| + | You can see that the majority of the processing time is used on SQ(square) and MAX(which value is bigger) calculations. The point calculation can be done independently and therefore can be parallelized with CUDA. This program can be speed up even more if we utilize the Barnes-hut algorithm for calculating N-Bodies using quad trees and spatial partitions. | ||
=== Assignment 2 === | === Assignment 2 === | ||
=== Assignment 3 === | === Assignment 3 === | ||
Revision as of 17:48, 8 February 2013
GPU610/DPS915 | Student List | Group and Project Index | Student Resources | Glossary
Contents
- 1 Cosmosis
- 1.1 Team Members
- 1.2 Progress
Cosmosis
Team Members
- Clinton Bale, Some responsibility
- Alex Craig, Some responsibility
- Jesse Santos, Some responsibility
- Neil Guzman, Some responsibility
Progress
Assignment 1
For our assignment 1, we are looking into finding and N-body simulator. All of us in the group have agreed to find 1 each, and after profiling them, we will choose the most inefficient one to parallelize.
Alex's Profiling Findings
I have found a Java applet that uses a brute force method for an N-Body simulator. It also has an improved algorithm to speed up the simulation and allow for a lot more bodies to be added. I will profile and show some sample run results for both, and see which one may be more fitting to try and parallelize.
Example Profiles of Brute Force Algorithm
All of these profiles were ran for about 4 to 5 minutes each. It seems that when the body count is low (1000) the program spends most of its time in the addforces() function, which is a user defined function within one of the source files. However, when the body count gets higher, it seems that the program slows down so much from having to draw all of the bodies, it spends most of its time in the Java defined fillOval() function, rather than the addforces() function. I'm not entirely sure if we would be able to parrallelize that function, since it is in a library. It may be possible to simply define a function that does the same thing and put it in the program.
Example Profiles of Barnes Hut Algorithm
All of these profiles were ran for about 5 minutes each. The percentage of time the program spends in all of the functions is pretty consistent. Again, the Java defined fillOval() function is taking the longest amount of time. I'll have to look into adding that function into the main class. Although the updateForce() and insert() functions combined take over 25% of the execution time, so something can be done about that.
If someone knows how to add spoiler tags, it would be much appreciated if you could add them to my 2 groups of pictures.
Clinton's Profiling Findings
I decided to code my own N-Body simulator using the instructions and data found at cs.princeton.edu. I have created both a Windows and Linux version of the simulation, the Windows version supports drawing graphics to the screen while the Linux version does not. The implementation is coded in C++ and uses the "brute force" algorithm to calculate the bodies. While this implementation is "perfect", the run-time for it is O(n^2). I have also tried to implement a basic form of SSE (Streaming SIMD Extensions) which should increase the speed of the simulation. I will provide profiling for both SSE and non-SSE versions.
The profiling seen has been run with the following properties:
- Windows: i5 2500K @ 4.5Ghz
- Linux: Seneca Matrix
- Both drawing no graphics to the screen for unbiased results.
- Random position, velocity and mass for each body.
- Brute force algorithm for calculating the forces (O(n^2)).
Profile #1: 1000 Bodies CPU Usage
During this profile, the simulations are run for 240 seconds to determine which functions have the most CPU load. Inline functions are also disabled for this test so that we can properly determine where the bottlenecks of the code are.
Windows:
As expected, the main source of CPU load is coming from the function that does all the work computing the forces of the planets. This function takes 88.46% of the entire application's worth in computing power for four minutes. The hotspots for the AddForces function can be seen here:
This picture shows that the majority of the computing involved comes from the square root function and computing the gravitational constant. Both of which require heavy floating point math to complete.
Linux:
Linux shows very similar results for 1000 elements, most, if not all the cpu usuage has gone to the AddForces function. With just over 3.7 billion calls to the AddForces function, we can see the slowdown of the O(n2) run-time immediately.
Profile #2: 1000 Bodies Timing (SSE and non-SSE)
For this test, the simulations are run for 240 seconds to determine the amount of time it takes to calculate one “sample” which is one whole brute-force pass of all the bodies.
Windows (non-SSE):
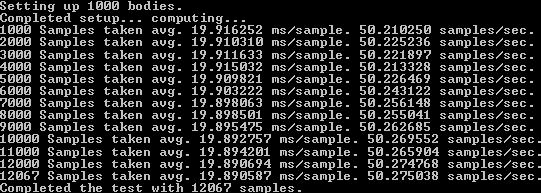
This screenshot is a picture of the simulation running in the console. I added some information to show exactly how much information is being processed per second. Above you can see that on average it takes about 19.89 m/s to process one sample (full brute-force calculation). A nice speed which gives us about 50 samples per second. During the entire four minute long test, my Windows machine was able to execute 12067 samples.
Linux (non-SSE):
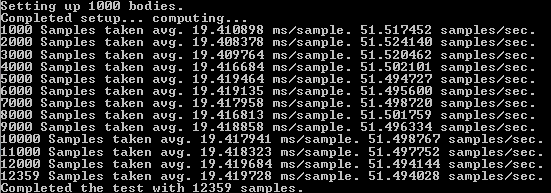
On Seneca's Matrix server, the results are surprisingly much slower, about half the speed of my Windows machine using full optimizations. You can see that in the time it took for my machine to run 12067 samples, Matrix only completed 6359.
Windows (SSE):
I rewrote some of the functions for calculating the forces on the bodies to use SSE code. This is the first time I have ever written SSE code and may not be properly optimized for what it's doing. The performance increases of my implementation is negligible, but I'm sure that If I had more knowledge in the SSE architecture the performance difference would be much more noticeable.
After the rewrite of my calculation functions, I only gained about a 2.5% increase in speed, which is definitely not worth it.
Linux (SSE):
To enable SSE on Linux, you can use the built in compiler parameters that g++ has to automatically generate SSE instructions for you:
-march=native -mfpmath=sse
Enabling this gave me a small performance boost of about 5 samples per second. Increasing my total sample count over four minutes to 7468 from 6359, that's a 15% increase in speed from just adding two compiler parameters, not bad.
Profile #3: 512 Samples 1000-5000 Bodies Comparison
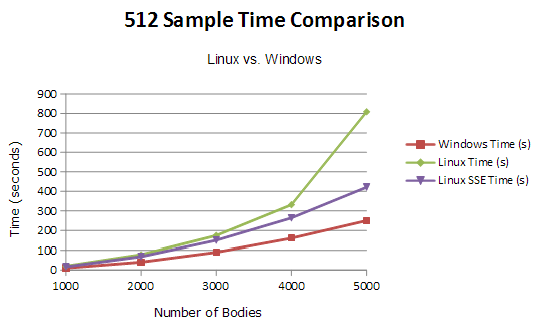
For this final profile, I sampled the time difference between Linux and Windows. I include The Linux SSE and non-SSE versions, but only the standard Windows implementation due to the fact that the speed increase is next to nothing with my SSE version. The following test was timing the amount of seconds it took to compute 512 brute-force samples of the N-Body simulation, lower the better.
Parallelizable?
For my 2D N-Body simulation, you can spot the section of code where parallelization would give massive speedups. Since processors do things in a serial order, the following double-for loop is the cause for most of the delay in the application:
If I was to parallelize this code using CUDA, I would put the ResetForce and AddForce function calls into their own thread on the GPU. Therefore, instead of computing all the forces sequentially, they all get computed at once.
Neil's Profiling Findings
The program I found is an n-body simulation using a brute force algorithm. It essentially does an n-body simulation of O(n^2) efficiency and displays the visual output onto the screen. For testing purposes-as well as for compatibility issues-I disabled the visual output and redirected the function call, vga_setmode, to text mode (0)).
Testing Environment:
- Operating System: Ubuntu 12.10, 32-bit
- Compiler: GNU C++, version 4:4.7.2-1ubuntu2
- Processor: Intel(c) Core(tm) i5 CPU M 480 @ 2.67GHz x 4
- Graphics Card: Intel(c) HD Graphics 2000
- Memory: 5.7GB
How to Setup (on Linux machines with admin priveleges only):
- Download source file: | n-body-simulation
- Install required libraries/utils:
sudo apt-get install g++
sudo apt-get install libsvgal-dev
- Compile and run:
g++ galaxy_0.1.cpp -lvga -pg
sudo ./a.out
Analysis:
The program contains 1 main function that takes up 90% of the execution time: Calculate_Gravity(). The reason being that the function has 3 for loops. 1 for loop to reinitialize the bodies' locations. The other 2 for loops are nested and is what does the main calculations of the simulation.
for (i=0; i<=NumP-1; i++) { xa[i]=0; ya[i]=0; za[i]=0; }
for (i=0; i<=NumP-1; i++)
{
    for (j=i+1; j<=NumP-1; j++)
    {
        // calculating statements
Another hot spot in the code was the function planet::Interact(...) because it had to do a lot of calculations for each body
for (i=0;i<= NumP-1;i++)
    if (P[i].exist) P[i].Interact(xa[i],ya[i],za[i],swx,swy,swz);
and then update the visual of each position.
if (ins)
{
    vga_setcolor(colr);
    vga_drawpixel (xpos,ypos);
    if (prj) Projection(7,sc);
}
Right now, the functions are running once at a time, making the program run slower. If both Calculate_Gravity() and planet::Interact(...)'s for loops were parallelized, there would be a significant speedup.
Using Amdahl's Law:
S1344 = 1 / ( 1 - 0.9982 + 0.9982 / 1344) = 393.28
A ~393 times speedup would make a function that took 24.16 seconds to execute, only 0.06 seconds.
Difficulties Met:
The main difficulty was trying to find and install the library that would let the code compile. The library that the program uses, svgalibs, is an old library meant for displaying images on linux machines. This means that the program itself would try and access the /dev/tty of the linux system-this is also why you needed admin privileges to run the program.
Another difficulty was the initial reading of the code and trying to understand it. After a couple more reading, it becomes easier to understand and it looks like it could be improved much more by changing the graphics used and the structure of the code.
If we end up choosing this, the difficulty might light in the fact that we have to update the technologies used (graphics library), restructure the code, and possibly change the algorithm to Barnes-hut.
Summary:
- Algorithm used: Brute force O(n^2), is way too ineffecient for high numbers of n
- Can be improved upto O(n log n) through use of Barnes-hut algorithm
- Main function to parallelize: Calculate_Gravity(), due to these for loops:
for (i=0; i<=NumP-1; i++) { xa[i]=0; ya[i]=0; za[i]=0; }
for (i=0; i<=NumP-1; i++)
{
    for (j=i+1; j<=NumP-1; j++)
    {
        // calculating statements
- Potential speedup, based on Amdahl's Law and with 1344 cores (GTX670): ~393 times
- This means going from 24.16 seconds of execution time to 0.06 seconds
Resources:
Flat Profiles for 100,500,1000,5000,10000 bodies
Jesse's Profiling Findings
Normal 0 false false false EN-US X-NONE X-NONE MicrosoftInternetExplorer4
Normal 0 false false false EN-US X-NONE X-NONE MicrosoftInternetExplorer4
I found an iterated approximation of an N-Body project on GitHub at: https://github.com/jrupac/N-body-Simulation. The simulation uses the brute force algorithm with a run-time of O(n^2). It uses SDL to draw squares which represent each body. I have removed all SDL so it only does the calculations. It also has collision detection with other bodies. It still collides with the window sides even though I have removed the window. I also included a high resolution timer by Song Ho Ahn. The timer class can be found at: http://www.cnblogs.com/JohnShao/archive/2011/10/14/2211085.html
Testing Environment:
- Normal 0 false false false EN-US X-NONE X-NONE MicrosoftInternetExplorer4 Windows: i5 3570K @ 5Ghz
- Raw computations, no graphical visualization
- The velocity of the point is modified. Not a proper force.
- Brute force algoritim for calculation the forces O(N^2)
Profile: 512 Samples of 500-1500 Bodies
Normal 0 false false false EN-US X-NONE X-NONE MicrosoftInternetExplorer4
I ran a series of N-Body simulations and sampled each run 512 times. The results are exactly as you would expect for an O(n^2) algorithm; a quadratic increase in time.
Analysis:
Using Visual Studio 10 profiler, it is clear that the update function is an expensive call path.
Although the program is an iterated approximation of an N-Body simulation, it is slower than a more proper N-Body simulation. The calculations are incorrect and the majority of them are unnecessary. The update function uses a double for loop to calculate the forces for each particle amongst one another. This is of O(n^2) runtime.
Summary:
You can see that the majority of the processing time is used on SQ(square) and MAX(which value is bigger) calculations. The point calculation can be done independently and therefore can be parallelized with CUDA. This program can be speed up even more if we utilize the Barnes-hut algorithm for calculating N-Bodies using quad trees and spatial partitions.


