Difference between revisions of "How to Setup and configure Nagios"
(→5.1 Additional Details) |
(→5.1 Additional Details) |
||
| Line 787: | Line 787: | ||
ln -s /etc/init.d/check_mounted_disks /etc/rc/rc2.d/K50check_mounted_disks</code> | ln -s /etc/init.d/check_mounted_disks /etc/rc/rc2.d/K50check_mounted_disks</code> | ||
| + | |||
| + | When the check_mounted_disks is executed the following results are exhibited on the display monitor: | ||
| + | |||
| + | <code> | ||
| + | [root]@cdot-guru-4-1/]#.check_mounted_disks | ||
| + | "OK: All disks are mounted and persistent"</code> | ||
== 6.0 IRC Notification Bot Configuration (Server configuration) == | == 6.0 IRC Notification Bot Configuration (Server configuration) == | ||
Revision as of 13:20, 16 December 2010
- Version 0.7
Contents
- 1 1.0 About Nagios
- 2 2.0 Server Installation (using tarball)
- 3 3.0 Additional Server configuration
- 4 4.0 Server Installation (using yum utility)
- 5 5.0 Setting up the Remote Host (using yum utility)
- 6 5.1 Additional Details
- 7 6.0 IRC Notification Bot Configuration (Server configuration)
- 8 7.0 Client Installation
- 9 8.0 Demonstration
1.0 About Nagios
Nagios is a system and network monitoring application. It watches hosts and services that you specify, and provides critical notifications to administrators, when the system/network performance is being negatively impacted.
Nagios was originally designed to run under Linux, but it possessess the capability of being compatible with a host of other OSs as well.
Some of the many features of Nagios include:
- Monitoring of network services (SMTP, POP3, HTTP, NNTP, PING, etc.)
- Monitoring of host resources (processor load, disk usage, etc.)
- Simple plug-in design that allows users to easily develop their own service checks
- Parallelized service checks
- Ability to define network host hierarchy using "parent" hosts, allowing detection of and distinction between hosts that are down and those that are unreachable
- Contact notifications when service or host problems occur and get resolved (via email, pager, or user-defined method)
- Ability to define event handlers to be run during service or host events for proactive problem resolution
- Automatic log file rotation
- Support for implementing redundant monitoring hosts
- Optional web interface for viewing current network status, notification and problem history, log file, etc.
2.0 Server Installation (using tarball)
This guide will provide you with instructions on how to install Nagios from source (code) on Fedora 13 and have it monitoring your local and client machines.
2.1 Features available after instalation
- Nagios and the all plugins will be installed underneath /usr/local/nagios
- Nagios will be configured to monitor a few aspects of your local system (CPU load, disk usage, etc.)
- The Nagios web interface will be accessible at http://localhost/nagios/
- Monitor Nagios clients
2.2 Prerequisites
During portions of the installation you will need to have root access to your machine.
Note: root password is **********
Make sure you've installed the following packages on your Fedora 13 installation before continuing.
- Apache
- PHP
- GCC compiler
- GD development libraries
Note: you have to be root to install the following packages.
yum install httpd php
yum install gcc glibc glibc-common
yum install gd gd-devel
2.3 Create Account Information
1. While you still have root privilages from a previous step, create a new nagios user account and give it a password.
useradd -m nagios
passwd **********
2. Create a new nagcmd group for allowing external commands to be submitted through the web interface. Add both the nagios user and the apache user to the group.
groupadd nagcmd
usermod -a -G nagcmd nagios
usermod -a -G nagcmd apache
2.4 Download Nagios and the Plugins
1. Create a directory for storing the downloads.
mkdir ~/nagios/downloads
cd ~/nagios/downloads
Download the source code tarballs of both Nagios and the Nagios plugins (visit http://www.nagios.org/download/ for links to the latest versions).
wget http://prdownloads.sourceforge.net/sourceforge/nagios/nagios-3.2.3.tar.gz
wget http://prdownloads.sourceforge.net/sourceforge/nagiosplug/nagios-plugins-1.4.15.tar.gz
2.5 Compile and Install Nagios
1. Extract the Nagios source code tarball.
cd ~/nagios/downloads
tar xzf nagios-3.2.3.tar.gz
cd nagios-3.2.3
2. Run the Nagios configure script, passing the name of the group you created earlier, using the following command:
./configure --with-command-group=nagcmd
3. Compile the Nagios source code.
make all
4. Install binaries, init script, sample config files and set permissions on the external command directory.
Note: You have to be root to issue the following commands.
make install
make install-init
make install-config
make install-commandmode
Note: DO NOT start Nagios yet
2.6 Customize Configuration
Edit the /usr/local/nagios/etc/objects/contacts.cfg config file with your favorite editor and change the email address associated with the nagiosadmin contact definition to the address you'd like to use for receiving alerts.
vi /usr/local/nagios/etc/objects/contacts.cfg
define contact{

  contact_name    nagiosadmin                 ; Short name of user

  use             generic-contact             ; Inherit default values from generic-contact template(defined above)

  alias           Nagios Admin                ; Full name of user

  email           email@learn.senecac.on.ca   ; *****CHANGE THIS TO YOUR EMAIL ADDRESS *****

        }
2.7 Configure the Web Interface
1. Install the Nagios web config file in the Apache conf.d directory.
cd /home/nagios/downloads/nagios-3.2.3
Note: you have to be root to issue the following command.
make install-webconf
2. Create a nagiosadmin account for logging into the Nagios web interface.
htpasswd -c /usr/local/nagios/etc/htpasswd.users nagiosadmin
Type the password: **********
3. Restart Apache to make the new settings take effect.
service httpd restart
2.8 Compile and Install the Nagios Plugins
1. Extract the Nagios plugins source code tarball.
cd ~/downloads
tar xzf nagios-plugins-1.4.15.tar.gz
cd nagios-plugins-1.4.15
2. Compile and install the plugins.
./configure --with-nagios-user=nagios --with-nagios-group=nagios
make
Note: you have to be root to issue make install command.
make install
2.9 Start Nagios
1. Add Nagios to the list of system services and have it automatically start when the system boots.
chkconfig --add nagios
chkconfig nagios on
2. Verify the sample Nagios configuration files.
/usr/local/nagios/bin/nagios -v /usr/local/nagios/etc/nagios.cfg
You have to have no warnings or errors:

Total Warnings: 0
Total Errors: 0
3. If there are no errors, start Nagios. If you got errors, please check nagios.cfg file in step 2, and try it again.
service nagios start
2.10 Modify SELinux Settings
Fedora ships with SELinux (Security Enhanced Linux) installed and in Enforcing mode by default. This can result in "Internal Server Error" messages when you attempt to access the Nagios CGIs.
1. See if SELinux is in Enforcing mode.
getenforce
2. Put SELinux into Permissive mode.
setenforce 0
3. To make this change permanent, you'll have to modify the settings in /etc/selinux/config and reboot. Instead of disabling SELinux or setting it to permissive mode, you can use the following command to run the CGIs under SELinux enforcing/targeted mode:
chcon -R -t httpd_sys_content_t /usr/local/nagios/sbin/
chcon -R -t httpd_sys_content_t /usr/local/nagios/share/
2.11 Login to the Web Interface
You should now be able to access the Nagios web interface at the URL below. You'll be prompted for the username (nagiosadmin) and password you specified earlier. For a password that you configured please refere to the section 2.7, step 2.
Click on the "Service Detail" navigational bar link to see details of what's being monitored on your local machine. It will take a few minutes for Nagios to check all the services associated with your machine, as the checks are spread out over time.
2.12 Open Port 5666 on Firewall
Make sure your machine's firewall rules are configured to allow access to the web server if you want to access the Nagios interface remotely.
1. Create a rule for iptables.
iptables -I INPUT -p tcp -m tcp ---dport 5666 -j ACCEPT
2. Save the new iptables rule so it will survive machine reboots.
service iptables save
2.13 You're Done
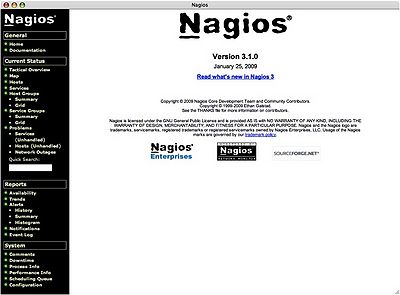
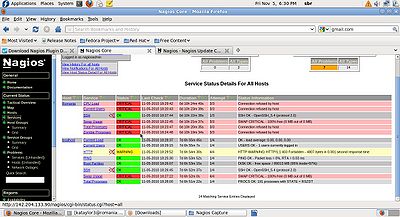
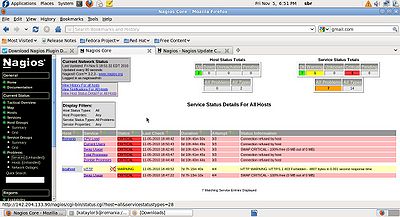
Congratulations! You sucessfully installed Nagios. Your journey into monitoring is just beginning. You have just completed the basic configuration of the Nagios Server. You'll no doubt want to monitor more than just your local machine, so keep reading and you will find how to configure the client machine with some modifications on Nagios server. If you did everything as per specifications, the following page will be displayed upon initial access of the Nagios Server GUI:
3.0 Additional Server configuration
3.1 Downlad and Install NRPE Plugin for Nagios Server
1. Create a Nagios_NRPE folder.
mkdir -p ~/Nagios/Nagios_NRPE
cd ~/Nagios/Nagios_NRPE
2. Save file to directory ~/Nagios
http://www.nagios.org/download/download.php
3. Extract the Files:
tar -xzf nrpe-2.12.tar.gz
cd nrpe-2.12
3.2 Compile and Configure NRPE
Note: you have to be root to issue make install command.
./configure
make all
make install-plugin
3.3 Test Connection to NRPE daemon on Remote Server
Make sure that the NRPE on your Nagios server can talk to the NRPE daemon on the remote server we want to monitor. Replace “<IP of Remote Server>” with the remote servers IP address.
/usr/local/nagios/libexec/check_nrpe -H 142.204.133.90 NRPE v2.12
3.4 Create NRPE Command Definition
Note: The command.cfg file does not exist in /usr/local/nagios/etc/ directory so
it has to be created, and the script block has to be added to the aformentioned file.
1. A command definition needs to be created in order for the check_nrpe plugin to be used by nagios.
vi /usr/local/nagios/etc/objects/commands.cfg
2. Add the following at the end of the file:
define command{

              command_name check_nrpe

              command_line $USER1$/check_nrpe -H $HOSTADDRESS$ -c $ARG1$

         }
3.5 Create host and service definitions
You'll need to create some object definitions in order to monitor the remote Linux/Unix machine. These definitions can be placed in their own file or added to an already exiting object configuration file.
First, create a new template for each different type of host you'll be monitoring. Let's create a new template for Linux boxes.
1. Create new linux-box-remote object template file:
vi /usr/local/nagios/etc/objects/linux-box-remote.cfg
Note: Information below is just an example of the template file.
define host{
          name                  linux-box-remote      ; Name of this template
          use                   generic-host          ; Inherit default values
          check_period          24x7
          check_interval        5
          retry_interval        1
          max_check_attempts    10
          check_command         check-host-alive
          notification_period   24x7
          notification_interval 30
          notification_options  d,r
          contact_groups        admins
          register              0                     ; DO NOT REGISTER THIS - ITS A TEMPLATE
          }

define host{
          use          linux-box-remote     ; Inherit default values from a template
          host_name    Centos5              ; The name we're giving to this server
          alias        Centos5              ; A longer name for the server
          address      142.204.133.90       ; IP address of the server
          }

define service{
          use                 generic-service
          host_name           Centos5
          service_description CPU Load
          check_command       check_nrpe!check_load
          }
define service{
          use                 generic-service
          host_name           Centos5
          service_description Current Users
          check_command       check_nrpe!check_users
          }
define service{
          use                 generic-service
          host_name           Centos5
          service_description /dev/hda1 Free Space
          check_command       check_nrpe!check_hda1
          }
define service{
          use                 generic-service
          host_name           Centos5
          service_description Total Processes
          check_command       check_nrpe!check_total_procs
          }
define service{
          use                 generic-service
          host_name           Centos5
          service_description Zombie Processes
          check_command       check_nrpe!check_zombie_procs
          }
2. Activate the linux-box-remote.cfg template:
vi /usr/local/nagios/etc/nagios.cfg
And add the following lines:
# Definitions for monitoring remote Linux machine
cfg_file=/usr/local/nagios/etc/objects/linux-box-remote.cfg
3. Verify Nagios Configuration Files:
If there are errors, fix them. If everything is fine, restart Nagios.
/usr/local/nagios/bin/nagios -v /usr/local/nagios/etc/nagios.cfg
You have to have no warnings or errors:
Total Warnings: 0

Total Errors: 0
4. Restart Nagios:
service nagios restart
4.0 Server Installation (using yum utility)
4.1 Required packages
Make sure you've installed the following packages on your Fedora 13 installation before continuing.
Note: You have to be root to install the following packages.
1. Install the following packages using yum install utility.
yum -y install httpd gcc glib glibc-common gd gd-devel
yum -y install nagios
yum -y install nagios-plugin-all
yum -y install nrpe
4.2 Create Account Information
1. While you still have root privileges from a previous step, create a new nagios user account and give it a password.
useradd -m nagios
passwd (your password is here)
2. Create a new nagcmd group for allowing external commands to be submitted through the web interface. Add both the nagios user and the apache user to the group.
groupadd nagcmd
usermod -a -G nagcmd nagios
usermod -a -G nagcmd apache
4.3 Configure the Web Interface
1. Create a nagiosadmin account for logging into the Nagios web interface.
htpasswd -c /etc/nagios/htpasswd.users nagiosadmin
Type the password: (your password is here)
Note: When you have installed all the required plugins,  using the “yum” utility, you will have to exhibit due diligence by
ensuring that  the “check_nrpe” plugin and check_nagios plugin are located in the /usr/lib64/nagios/plugins directory. If the
check_nrpe plugin is not present you will have to either copy it from a compatible machine that already contains the appropriate
or required plugin(s),or try uninstalling the previous installation of the nagios plugins and proceed to re-installing the plugins,
using yum install.
4.4 Nagios Configuration File
Note: Here is view of what your configuration files should look like, in order to have successfully installed and configured version of
 Nagios. The following lines were either added or modified for the nagios.cfg file on the Nagios monitoring host.
1. Open nagios.cfg and edit it with your favourite editor.
vi /etc/nagios/nagios.cfg
#Definitions for monitoring the local (Linux) host

  cfg_file=/etc/nagios/objects/localhost.cfg

#Definitions for monitoring a Remote (Linux) machine

  cfg_file=/etc/nagios/objects/linux-remote.cfg

#Definitions for monitoring second Remote (Linux) machine

  cfg_file=/etc/nagios/objects/linux-romania.cfg
2. Open nrpe.cfg and edit it with your favourite editor.
vi /etc/nagios/nrpe.cfg
Note: In the nrpe.cfg the following lines can be modified to meet the current system needs
#Allowed_hosts=127.0.0.1 is typically altered on the Remote host ONLY changes in IP address that allows a host to access the nrpe daemon system depends on an entities/organizations network requirements.
Note: The following examples use hardcoded command arguments
command[check_users]=/usr/lib64/nagios/plugins/check_users -w 5 -c 10
command[check_load]=/usr/lib64/nagios/plugins/check_load -w 15,10,5 -c 30,25,20
command[check_hda1]=/usr/lib64/nagios/plugins/check_disk -w 20% -c 10% -p /dev/hda1
command[check_zombie_procs]=/usr/lib64/nagios/plugins/check_procs -w 5 -c 10 -s Z
command[check_total_procs]=/usr/lib64/nagios/plugins/check_procs -w 700 -c 900
Note: If you're running the NRPE daemon as a standalone daemon you'll need to restart it (using the command service nrpe restart).
4.5 Create a command definition
Note: You'll need to create a command definition in one of your Nagios object configuration files in order to use the
check_nrpe plugin. Open the sample commands.cfg file for editing...
vi /usr/local/nagios/etc/commands.cfg
and add the following definition to the file:
define command{
command_name check_nrpe
command_line /usr/lib64/nagios/plugins/check_nrpe -H $HOSTADDRESS$ -c $ARG1$
}
You are now ready to start adding services that should be monitored on the remote machine to the Nagios configuration...
4.6 Edit localhost.cfg file
Note: The localhost .cfg file can be created from one of the templates.cfg files located in the /etc/nagios/objects
directory, here is a  brief view of how your localhost.cfg file should appear
# Define a host for the local machine

define host{

            use                     linux-server     ; Name of host template$

                                                     ; This host definition $

                                                     ; in (or inherited by) $

            host_name               localhost

            alias                   chile   #Example machine in this scenario

            check_interval          5

            retry_interval          1

            max_check_attempts      10

            check_command           check-host-alive

            notification_period     24x7

            notification_interval   24x7

            notification_options    d,r

            contact_groups          admins

            address                 127.0.0.1

}
4.7 Contacts Configuration File
1. Edit contacts.cfg file is pretty straight forward and easy to decipher.
vi /usr/local/nagios/etc/objects/contacts.cfg
#CONTACTS################################################################

# Just one contact defined by default - the Nagios admin (that's you)

# This contact definition inherits a lot of default values from the 'generic-contact'

# template which is defined elsewhere.

define contact{

               contact_name    nagiosadmin                  ; Short name of user

               use             generic-contact              ; Inherit default values from generic-contact template(defined above)

               alias           Nagios Admin                 ; Full name of user

               email           email@learn.senecac.on.ca    ; ß CHANGE THIS TO YOUR EMAIL ADDRESS ******

        }
4.8 ScriptAlias NAGIOS.CFG
Note: ScriptAlias directory path will differ based on what version of OS (Operating System) you are running on your machine.
1. Edit nagios.cfg file located in apache (httpd) config files directory.
vi /etc/httpd/conf.d/nagios.cfg
Note: The current machine has Fedora 13, however, for a machine running Fedora 12 it may differ eg. ScriptAlias /nagios
/cgi-bin “/usr/lib64/nagios/cgi-bin/”

It's important that these directory paths exist and contain the appropriate content.
ScriptAlias /nagios/cgi-bin/ "/usr/local/sbin/"
<Directory "/usr/local/sbin">
# SSLRequireSSL
Options ExecCGI Indexes
AllowOverride None
Order allow,deny
Allow from all
# Order deny,allow
# Deny from all
# Allow from 127.0.0.1
AuthName "Nagios Access"
AuthType Basic
AuthUserFile /etc/nagios/htpasswd.users
Require valid-user
</Directory>
Alias /nagios "/usr/share/nagios/html"
<Directory "/usr/share/nagios/html">
# SSLRequireSSL
Options Indexes
AllowOverride None
Order allow,deny
Allow from all
# Order deny,allow
# Deny from all
# Allow from 127.0.0.1
AuthName "Nagios Access"
AuthType Basic
AuthUserFile /etc/nagios/htpasswd.users
Require valid-user
</Directory>
4.9 Note: This section highlights a brief snippet of two critical detailed steps REQUIRED for the installation and successful configuration of a Remote host (on an ARM machine) Cdot-gur-4-1 (Utilize the installation steps (5.0) that follow this section)
Using the 'yum utility' install the nrpe daemon/ nrpe addon & required plugins
The nrpe.d directory is located in /etc/nagios/nrpe.d
The nagios plugins are located in directory path /usr/lib/nagios/plugins
1. Ensure that the required plugins are located in current directory paths.
Open nrpe.cfg and edit it with your favourite editor.
vi /etc/nagios/nrpe.cfg
allowed_hosts=<IP Address to that of the monitoring hosts>
comment out the line:
#allowed_hosts=127.0.0.1
2. Change ownership on the plugins directory to reflect ownership to nagios.
chown nagios.nagios /usr/lib64/nagios/plugins
5.0 Setting up the Remote Host (using yum utility)
Note: This section will show how to setup the remote host with the nrpe daemon/nrpe addon & required plugins.
1. To install the nrpe daemon and nagios plugins run the following commands.
yum -y install nrpe
yum -y install Nagios-plugins-all
2. Open nrpe.cfg and edit it with your favourite editor.
vi /etc/nagios/nrpe.cfg
Add an allowed_hosts IP Address to nrpe.cfg file eg. 142.204.133.123 (chile’s IP Address), but for future configurations HongKong's IP Address will be used:
Allowed_hosts=142.204.133.123
3. Test the nrpe daemon locally using the command:
netstat -at | grep nrpe
Note: The output of the command should look something like this:

 tcp 0 0 *:nrpe *:* LISTEN
4. Add a firewall rule to the INPUT chain - CAVEAT: The ARM machines do not utilize iptables, so the line below may not be required.
iptables -I INPUT -p tcp -m tcp --dport 5666 -j ACCEPT
5. Save the firewall settings so it survives reboot
service iptables save
Note: Files locations after install:

/etc/nagios/ -> contains the nrpe.cfg

/etc/nrpe.d -> contains the daemon

/usr/lib64/nagios/plugins -> contains all plugins added during install

/usr/sbin/nrpe -> contains the nrpe execution file

/usr/share/docs/nrpe-2.12 -> contains the related README, Changelog files and .pdf etc
6. Check to make sure the NRPE daemon is functioning properly. To accomplish this, run the check_nrpe plugin that was installed for testing purposes. The directory make be different depending OS.
/usr/local/nagios/libexec/check_nrpe -H localhost <ip of the Remote host>
Or
/usr/lib64/naigos/plugins/check_nrpe -H localhost <ip of the Remote host>
7. Some of these commands can be executed on the Remote host for testing daemon functionality
/usr/local/nagios/libexec/check_nrpe -H localhost -c check_users
/usr/local/nagios/libexec/check_nrpe -H localhost -c check_load
/usr/local/nagios/libexec/check_nrpe -H localhost -c check_hda1
/usr/local/nagios/libexec/check_nrpe -H localhost -c check_total_procs
/usr/local/nagios/libexec/check_nrpe -H localhost -c check_zombie_procs
5.1 Additional Details
This section will discuss some additional initiatives that were implemented on the Nagios Remote host. Due to the inability to obtain
a plugin that is capable of monitoring mounted devices (on ARM machines) upon boot. A supplemental perl script was identified and utilized
for this purpose. The check_mounted_disks script was conveniently added to /etc/init.d directory, and few symlinks (soft links)
were linked to a few runlevels on the ARM system.
1. Symlinks were created using the command syntax.
      ln -s /etc/init.d/check_mounted_disks /etc/rc/rc2.d/S50check_mounted_disks

      ln -s /etc/init.d/check_mounted_disks /etc/rc/rc2.d/K50check_mounted_disks
When the check_mounted_disks is executed the following results are exhibited on the display monitor:
      [root]@cdot-guru-4-1/]#.check_mounted_disks
      "OK: All disks are mounted and persistent"
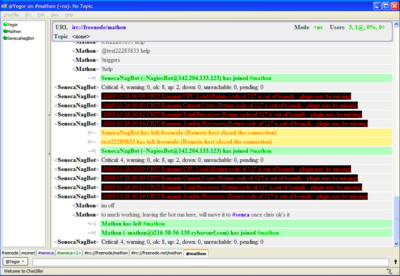
6.0 IRC Notification Bot Configuration (Server configuration)
Note: please keep in mind this was done on Fedora 13 with Nagios 3.2.3 and NagIRCBot 0.0.30.
1. Download the IRC bot.
wget http://www.vanheusden.com/nagircbot/nagircbot-0.0.30.tgz
2. Unzip the archive.
tar -xvzf nagircbot-0.0.30.tgz
3. Become the root user.
su –
4. Install edition packages.
yum install openssl-devel
yum nstall gcc
5. After unpacking the tarball, in the Makefile you must change the following line:
from:
LDFLAGS+=$(DEBUG) -lssl -lstdc++
to:
Note: only has to be done sometimes, when you getting an error about lcrypto
LDFLAGS+=$(DEBUG) -lssl -lstdc++ -lcrypto
6. When you change the make file from the step 3, issue make/make install.
make
make install
7. Once its installed you can start up nagircbot:
nagircbot -f /var/log/nagios/status.dat -s irc.freenode.net:6667 -c \#seneca-cdot -C -n test22283833 -u NagiosBot -U NagiosIRCBot -I 900
8. Lets examine the command from step 5, which will be the main command for starting nagircbot:
/var/log/nagios/status.dat |
Points to the log file it will read |
irc.freenode.net:6667 |
IRC server |
mathon |
Channel name |
The "-C" flag |
Allows it to send colored messages |
test22283833 |
IRCnickname |
ident/realname |
The ident and real name string for the bot |
The "-I" flag 900 |
How often to send a message to the channel in this case its 15min (900 seconds) |
9. Additional information about Nagios Bot.
Nagios bot options can be queried on the IRC channel. If you open private messages with the bot you can issue and control it by using the following commands:
help |
gets help |
resend |
resend the last known problems |
statistics |
returns the number of criticals/warnings/etc |
reload |
completely forced reload the nagios status |
check |
check if nagios is still running |
10.Congratulations! You just completed the IRC bot configuration.
7.0 Client Installation
7.1 Create Account Information on Client Machine
SSH to Iraq machine (142.204.133.98) and issue the following commands:
1. Become the root user.
su -
2. Create a new nagios user account and give it a password.
useradd -m nagios
passwd (your password is here)
3. Create a folder for Nagios plugins.
mkdir ~/downloads
cd ~/downloads
Note: For the next step make sure you are connected to the Internet to download nagios plugins.
4. Download the source code tarball of the NRPE addon (visit http://www.nagios.org/download/ for links to the latest versions).
wget http://osdn.dl.sourceforge.net/sourceforge/nagios/nrpe-2.8.tar.gz
5. Extract the NRPE source code tarball.
tar xzf nrpe-2.8.tar.gz
cd nrpe-2.8
6. Compile the NRPE add-on.
./configure
make all
7. Install the NRPE plug-in.
make install-plugin
7.2 Compile and Configure Nagios Plugins
Note: You need openssl-devel package installed to compile plugins with ssl support.

You have to be root to issue make install commands.
1. Become root user.
su -
2. Install openssl-devel package.
yum -y install openssl-devel
3. Instal Plugins:
./configure --with-nagios-user=nagios --with-nagios-group=nagios
make
make install
4. The permissions on the plugin directory and the plugins will need to be changed to nagios user.
chown nagios.nagios /usr/local/nagios
chown -R nagios.nagios /usr/local/nagios/libexec
5. Package xinted is needed.
yum install xinetd
6. Start xinetd service.
service xinetd start
7.3 Downlad and Install NRPE Daemon
1. Create a forlder ~/Nagios/Nagios_NRPE.
mkdir -p ~/Nagios/Nagios_NRPE
cd ~/Nagios/Nagios_NRPE
Save file to directory ~/Nagios
http://www.nagios.org/download/download.php
2. Extract the files:
tar -xzf nrpe-2.12.tar.gz
cd nrpe-2.12
7.4 Compile and Configure NRPE
1. Install NRPE:
Note: you have to be root to issue make install command.
./configure
General Options:
----------------------
NRPE port:      5666
NRPE user:      nagios
NRPE group:     nagios
Nagios user:    nagios
Nagios group:   nagios
make all
make install-plugin
make install-daemon
make install-daemon-config
make install-xinetd
7.5 Post NRPE Configuration
1. Edit Xinetd NRPE entry:
Add Nagios Monitoring server to the “only_from” directive.
vi /etc/xinetd.d/nrpe only_from = 127.0.0.1 <142.204.133.90 >
2. Edit services file entry and add entry for nrpe daemon.
vi /etc/services
nrpe 5666/tcp # NRPE
3. Restart Xinetd and set to start at boot:
chkconfig xinetd on
service xinetd restart
7.6 Test NRPE Daemon Install
1. Check NRPE daemon is running and listening on port 5666:
netstat -at |grep nrpe
2. Output should be:
tcp 0 0 *:nrpe *.* LISTEN
3. Check NRPE daemon is functioning:
/usr/local/nagios/libexec/check_nrpe -H localhost
4. Output should be NRPE version:
NRPE v2.12
7.7 Open Port 5666 on Firewall
Note: Make sure to open port 5666 on the firewall of the remote server so that the Nagios monitoring server can access the NRPE daemon.
1. Create a rule for iptables.
iptables -I INPUT -p tcp -m tcp ---dport 5666 -j ACCEPT
2. Save the new iptables rule so it will survive machine reboots.
service iptables save
7.8 Congratulations
Congratulations! You have successfully completed the configuration of the Nagios Server/Client setup.

