Difference between revisions of "GPU621/Intel Parallel Studio VTune Amplifier"
Ikondrakov (talk | contribs) (→How to use it) |
Ikondrakov (talk | contribs) (→How to use it) |
||
| Line 15: | Line 15: | ||
== Features & Functionalities == | == Features & Functionalities == | ||
| − | == How to | + | == How to configure and Start Analysis == |
Intel Parallel Studio VTune Profiler has a standalone version, Web Server Interface and a couple of IDE integrations, but for the sake of simplicity and relevance to the course material, we are going to use Visual Studio Integration of the Profiler. To begin, the IDE must be run with root privileges for the Profiler to have access to the hardware information and resources, otherwise, the analysis and collected data will be limited. | Intel Parallel Studio VTune Profiler has a standalone version, Web Server Interface and a couple of IDE integrations, but for the sake of simplicity and relevance to the course material, we are going to use Visual Studio Integration of the Profiler. To begin, the IDE must be run with root privileges for the Profiler to have access to the hardware information and resources, otherwise, the analysis and collected data will be limited. | ||
| Line 21: | Line 21: | ||
[[File:Menu.jpg]] | [[File:Menu.jpg]] | ||
| + | |||
| + | When Configure Analysis button needed to be pressed to get to the VTune Main Menu: | ||
| + | |||
| + | [[File:Main Menu.jpg]] | ||
== Demonstration == | == Demonstration == | ||
Revision as of 17:24, 8 December 2021
Contents
Group Members
Introduction
This page will demonstrate the purpose, features, and usage of the Intel Parallel Studio VTune Profiler. In short, it is a performance analyzing tool for 32-bit, 64-bit, and x86 architectures running Linux-based or Microsoft Windows operating systems. It supports both Intel and AMD hardware, but advanced hardware-based features and acceleration require an Intel-manufactured CPU. Furthermore, the application is specifically designed to help with optimization of application and system performance, High-performance computing configurations, and more by detecting performance bottlenecks through run-time environment profiling on serial and multi-threaded software.
Details
Intel Parallel Studio VTune Amplifier is available as a standalone application or as part of the Intel Parallel Studio bundle. The tool analyzes the run-time environment metrics of the target executable such as CPU utilization, Throttling, Thread usage, Memory usage, I/O, and other system-level resources to provide a developer with an extensive and precise report and suggestions for possible improvements. Additionally, the application measures the performance of a program, and each function separately and displays the report in an integrated Visual Studio user-friendly interface with comprehensive graphs and tables. Furthermore, the tool can perform an overview to help a developer identify any bottlenecks to resolve and suggest little tweaks such as increasing the grain size or the scope of the data when using the TBB library that Intel provides. Overall, this is a powerful and reliable tool for scalable parallelization.
Our team will point the usage and importance of the tool by demonstrating a little case study with the code implemented during the semester. Precisely, the Workshop 7 - Threading Building Blocks(parallel_scan) which is about a trivial Prefix Scan Problem. We will compare the performance and resource utilization of Serial, OpenMP and TBB versions each being analyzed by Intel Parallel Studio VTune Amplifier in Visual Studio.
Features & Functionalities
How to configure and Start Analysis
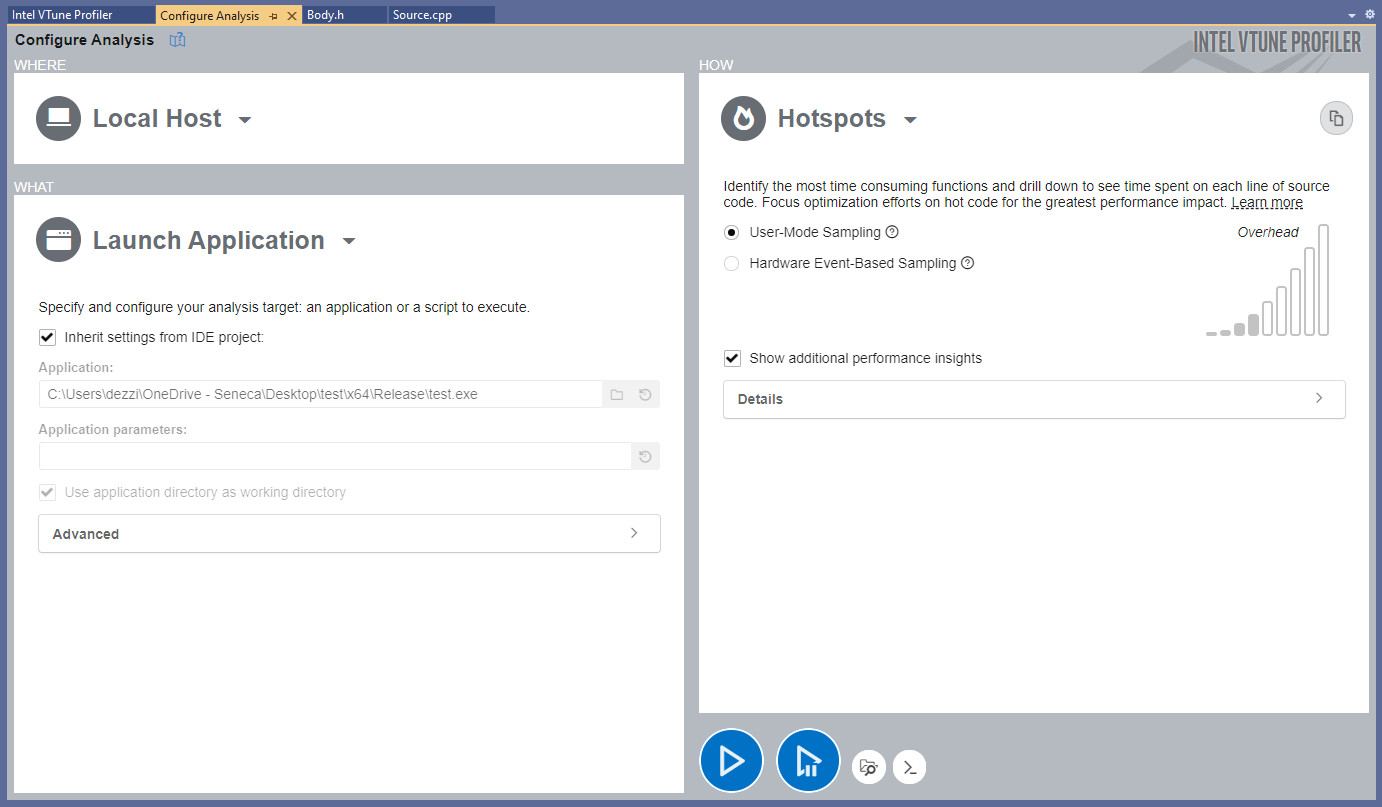
Intel Parallel Studio VTune Profiler has a standalone version, Web Server Interface and a couple of IDE integrations, but for the sake of simplicity and relevance to the course material, we are going to use Visual Studio Integration of the Profiler. To begin, the IDE must be run with root privileges for the Profiler to have access to the hardware information and resources, otherwise, the analysis and collected data will be limited.
To open Vtune press the button in the upper toolkit as shown below:
When Configure Analysis button needed to be pressed to get to the VTune Main Menu:

