Difference between revisions of "Intel Parallel Studio VTune Amplifier"
(→Performance Analysis) |
|||
| (9 intermediate revisions by 2 users not shown) | |||
| Line 51: | Line 51: | ||
== How to Use it? == | == How to Use it? == | ||
| − | [[ | + | Before you jump into running Intel's VTune Profiler you need to make sure you run visual studio as Administrator to give it access to your hardware information, otherwise it will not be able to optimize for your specific hardware and the data collected with be very limited. |
| + | |||
| + | Then to open Vtune press the menu as indicated below | ||
| + | |||
| + | [[File:Header.png]] | ||
| + | |||
| + | this will open this menu, | ||
| + | |||
| + | [[File:Benchmarking menu.png]] | ||
| + | |||
| + | allowing you to make changes to the application parameters in the centre box or just inherit the settings from Visual studio's settings, The Algorithm is currently set to HotSpot detection. | ||
| + | |||
| + | '''HotSpot detection settings include:''' | ||
| + | |||
| + | '''User-mode sampling:''' | ||
| + | includes only for this current program and is for testing code efficiency (regardless of other processes) | ||
| + | |||
| + | '''Hardware event based sampling:''' | ||
| + | includes all processes running on the current system. | ||
| + | |||
| + | pressing the dropdown menu on the Algorithm will show all the features available to VTune | ||
| + | |||
| + | [[File:Settings.png]] | ||
| + | |||
| + | Pressing the play button will start the benchmarking. | ||
| + | |||
== Performance Analysis == | == Performance Analysis == | ||
| + | |||
| + | Running the HotSpot analysis brings up this summary after the code finishes executing. | ||
| + | |||
| + | [[File:SummaryJ.png]] | ||
| + | |||
| + | This displays the time it took for the program to execute, what active thread took the longest, what task took the longest, how much your CPU was utilized, and (not pictured here) your run parameters and CPU info (what model CPU this test was performed on). | ||
| + | |||
| + | [[File:EfCPU.png]] | ||
| + | |||
| + | The CPU effective graph indicates how many threads the program used and it's poor,ok, and ideal performance segments can be adjusted to match the desired utilization in terms of max number of threads used at anytime (and anything over ideal would be considered over-utilization). | ||
| + | |||
| + | |||
| + | ---- | ||
| + | |||
| + | |||
| + | Pressing any of the tasks (or the bottom-up tab at the top) will bring up the bottom-up menu as shown below. | ||
| + | |||
| + | [[File:Bottom-up.png]] | ||
| + | |||
| + | This displays the actual times spent on each thread and if you selected a task when that task takes place. | ||
| + | |||
| + | The CPU time is also displayed here and the brown section indicates how much each (sample rate) section used the CPU in terms of % of total utilization of the program. | ||
| + | |||
| + | Pressing the highlighted button expands to show what % of the process uses the CPU in the ideal amount (as set on the summary screen) as shown below. | ||
| + | |||
| + | [[File:Bt-up-expand1.png]] | ||
| + | |||
| + | Pressing the highlighted button further expands the data to show in a more detailed fashion how the CPU usage is. As shown below. | ||
| + | |||
| + | [[File:Bt-up-expand2.png]] | ||
| + | |||
| + | == Microarchitecture Analysis== | ||
| + | |||
| + | This gives you an idea how efficiently the code is running on your hardware. | ||
| + | |||
| + | An interesting discovery made using this tool is that with Optimization enabled it actually utilizes the CPU less efficiently although it runs faster. | ||
| + | |||
| + | With | ||
| + | |||
| + | [[File:Micro.png]] | ||
| + | |||
| + | Without | ||
| + | |||
| + | [[File:Micro2.png]] | ||
| + | |||
| + | == History == | ||
| + | |||
| + | The result history can be seen on the menu on the right, this will allow you to compare previous results. | ||
| + | |||
| + | [[File:Result history.png]] | ||
== Sources == | == Sources == | ||
# [https://software.intel.com/content/www/us/en/develop/tools/vtune-profiler.html Intel VTune Profile] | # [https://software.intel.com/content/www/us/en/develop/tools/vtune-profiler.html Intel VTune Profile] | ||
# [https://software.intel.com/content/www/us/en/develop/documentation/vtune-help/top/launch/getting-started.html Installation and Features] | # [https://software.intel.com/content/www/us/en/develop/documentation/vtune-help/top/launch/getting-started.html Installation and Features] | ||
Latest revision as of 14:05, 30 November 2020
Contents
Group Members
Intel Parallel Studio VTune Profiler
The purpose of this project is to show how to use the Intel VTune Profiler with it's features that helps to analyze applications. The Intel VTune Amplifier has now been renamed to Intel Parallel Studio VTune Profiler. It is an intel bottleneck detector which analyzes and optimizes the software performance of a 32 and 64-bit x86 machine. It is a tool used to profile key data from serial and multithreaded applications that are executed on different platforms such as the CPU. The applications can be run on the VTune Profiler standalone version or the version installed with Intel Parallel Studio which then presents the analysis in the Intel VTune Profiler.
Features & Functionalities
Intel Parallel Studio Profiler can be installed as the standalone version, through the web server interface and as the integrated version in Microsoft Visual Studio or with the Eclipse IDE. The intel profiler helps analyze and diagnose:
- Single threaded performance
- Multithreaded applications
- Media & OpenCL Applications
- Memory & Storage Management
- Analyzes & Filter Data
- HPC & Cloud
- System Performance
- Environment
Standalone VTune Profiler Graphical Interface
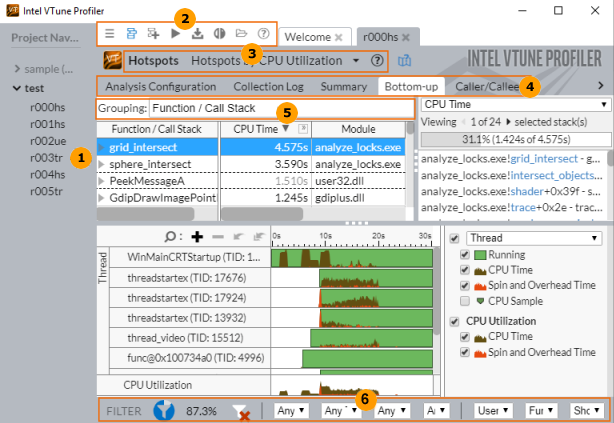
In this version click to create a new project and go to configure analysis. Then the features you will see will help to configure the analysis.
- Use the Project Navigator to manage your project and collect analysis results.
- Menu and Toolbar - configure and control performance analysis, define and view project properties.
- Analysis type and viewpoint - allows to view the correlation of the analysis result and a viewpoint used to display the collected data. Viewpoint is a pre-set configuration of windows/panes for an analysis result. There is also a drop down option to switch between viewpoints.
- Analysis Windows - these are different window tabs that show the analysis type configuration options and collected data provided by the selected viewpoint.
- Grouping - this is a drop-down menu to choose a granularity level for grouping data in the grid and the groupings are based on the hierarchy of the program.
- Filtering - two basic options for filtering the collected data that are per object and per time regions.
Web Server Interface
In this version the Intel VTune Profiler is used in a web server mode. The interface provides a collaborative multi-user environment and access to a common repository of collected performance results. The web server interface helps with running the tool by configuring and controlling the analysis on arbitrary target systems and viewing collected results. A desktop application is not required to run this version.
Microsoft Visual Studio Integration
By default VTune Profiler integrates into Visual Studio. For the installation wizard, you need to have the version of Visual Studio specified used for integration in the IDE. If there are several versions of Visual Studio then click the Customize link to use the version needed for integration in the installation wizard on the Choose Target page.
Eclipse and Intel System Studio IDE Integration
When Intel System Studio is installed the Intel VTune Profiler is integrated in the Eclipse IDE and with this there is access to the standalone interface of the profiler. When launching VTune Profiler from Intel System Studio, the environment variables are not required to be set as they are already set when launching.
How to Use it?
Before you jump into running Intel's VTune Profiler you need to make sure you run visual studio as Administrator to give it access to your hardware information, otherwise it will not be able to optimize for your specific hardware and the data collected with be very limited.
Then to open Vtune press the menu as indicated below
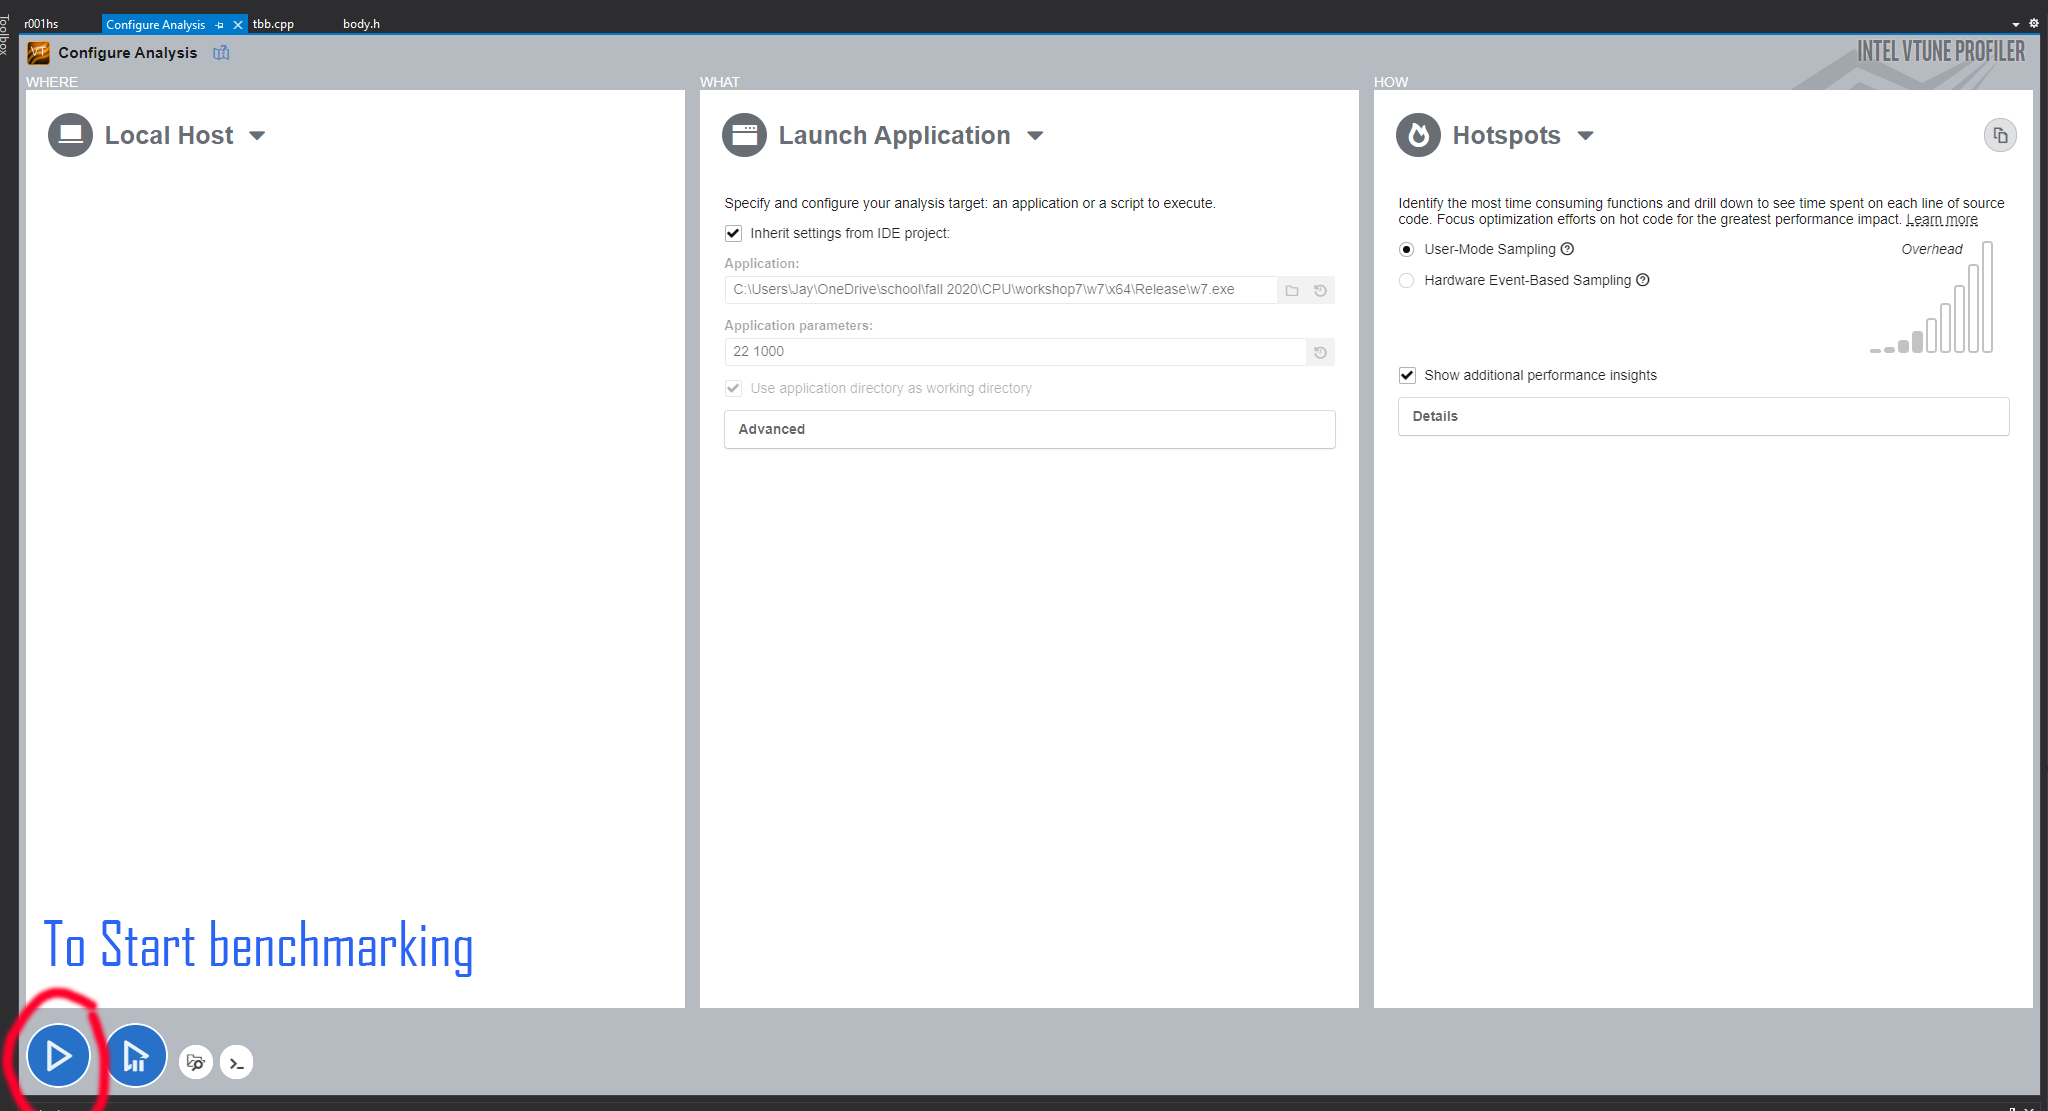
this will open this menu,
allowing you to make changes to the application parameters in the centre box or just inherit the settings from Visual studio's settings, The Algorithm is currently set to HotSpot detection.
HotSpot detection settings include:
User-mode sampling: includes only for this current program and is for testing code efficiency (regardless of other processes)
Hardware event based sampling: includes all processes running on the current system.
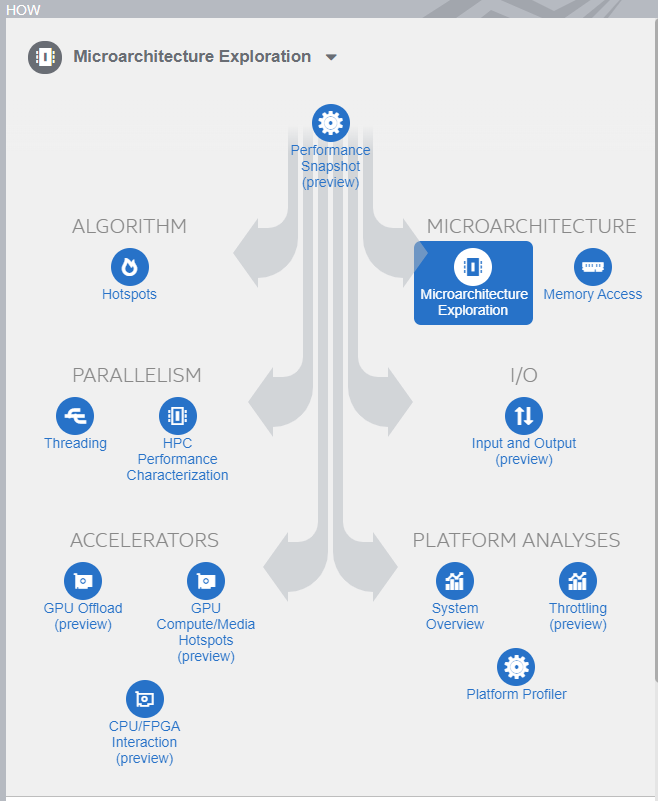
pressing the dropdown menu on the Algorithm will show all the features available to VTune
Pressing the play button will start the benchmarking.
Performance Analysis
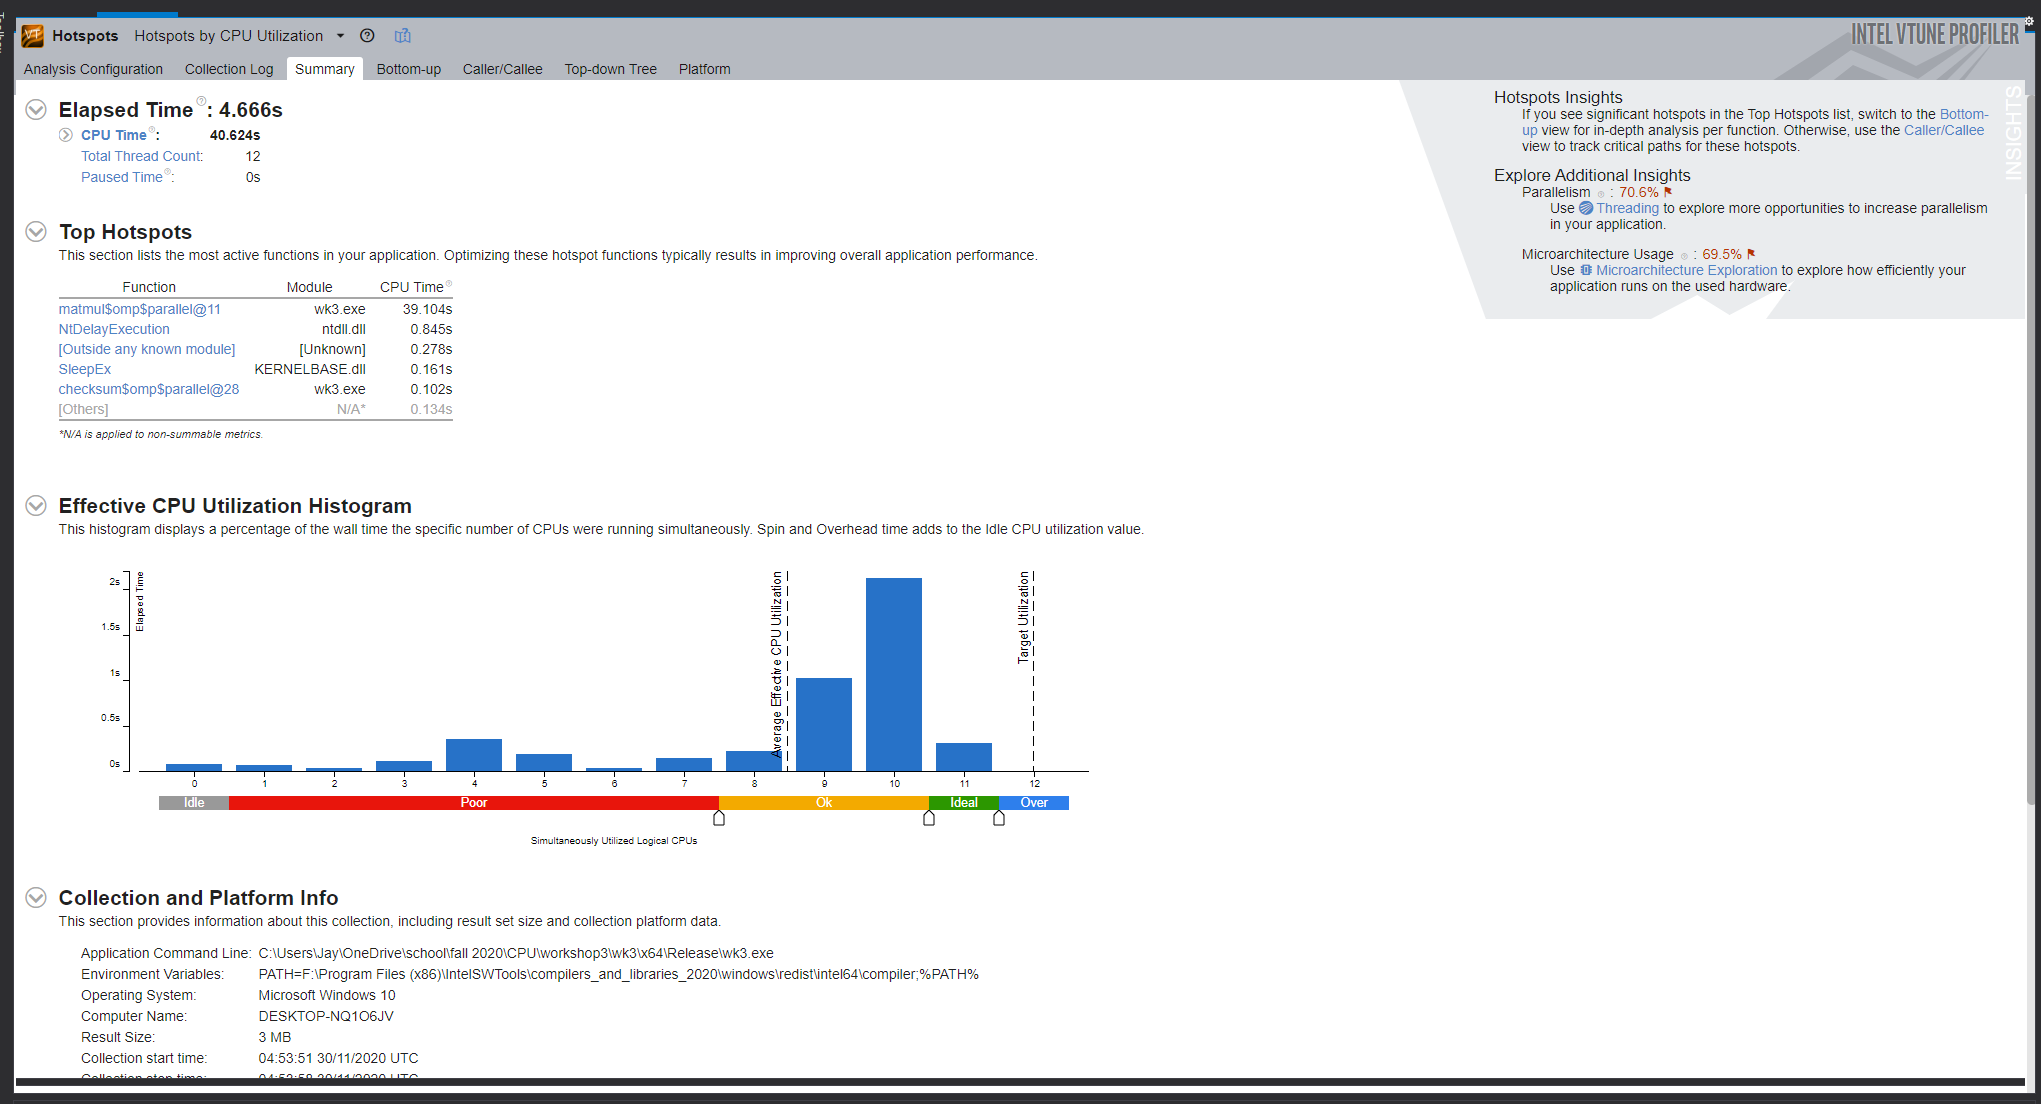
Running the HotSpot analysis brings up this summary after the code finishes executing.
This displays the time it took for the program to execute, what active thread took the longest, what task took the longest, how much your CPU was utilized, and (not pictured here) your run parameters and CPU info (what model CPU this test was performed on).
The CPU effective graph indicates how many threads the program used and it's poor,ok, and ideal performance segments can be adjusted to match the desired utilization in terms of max number of threads used at anytime (and anything over ideal would be considered over-utilization).
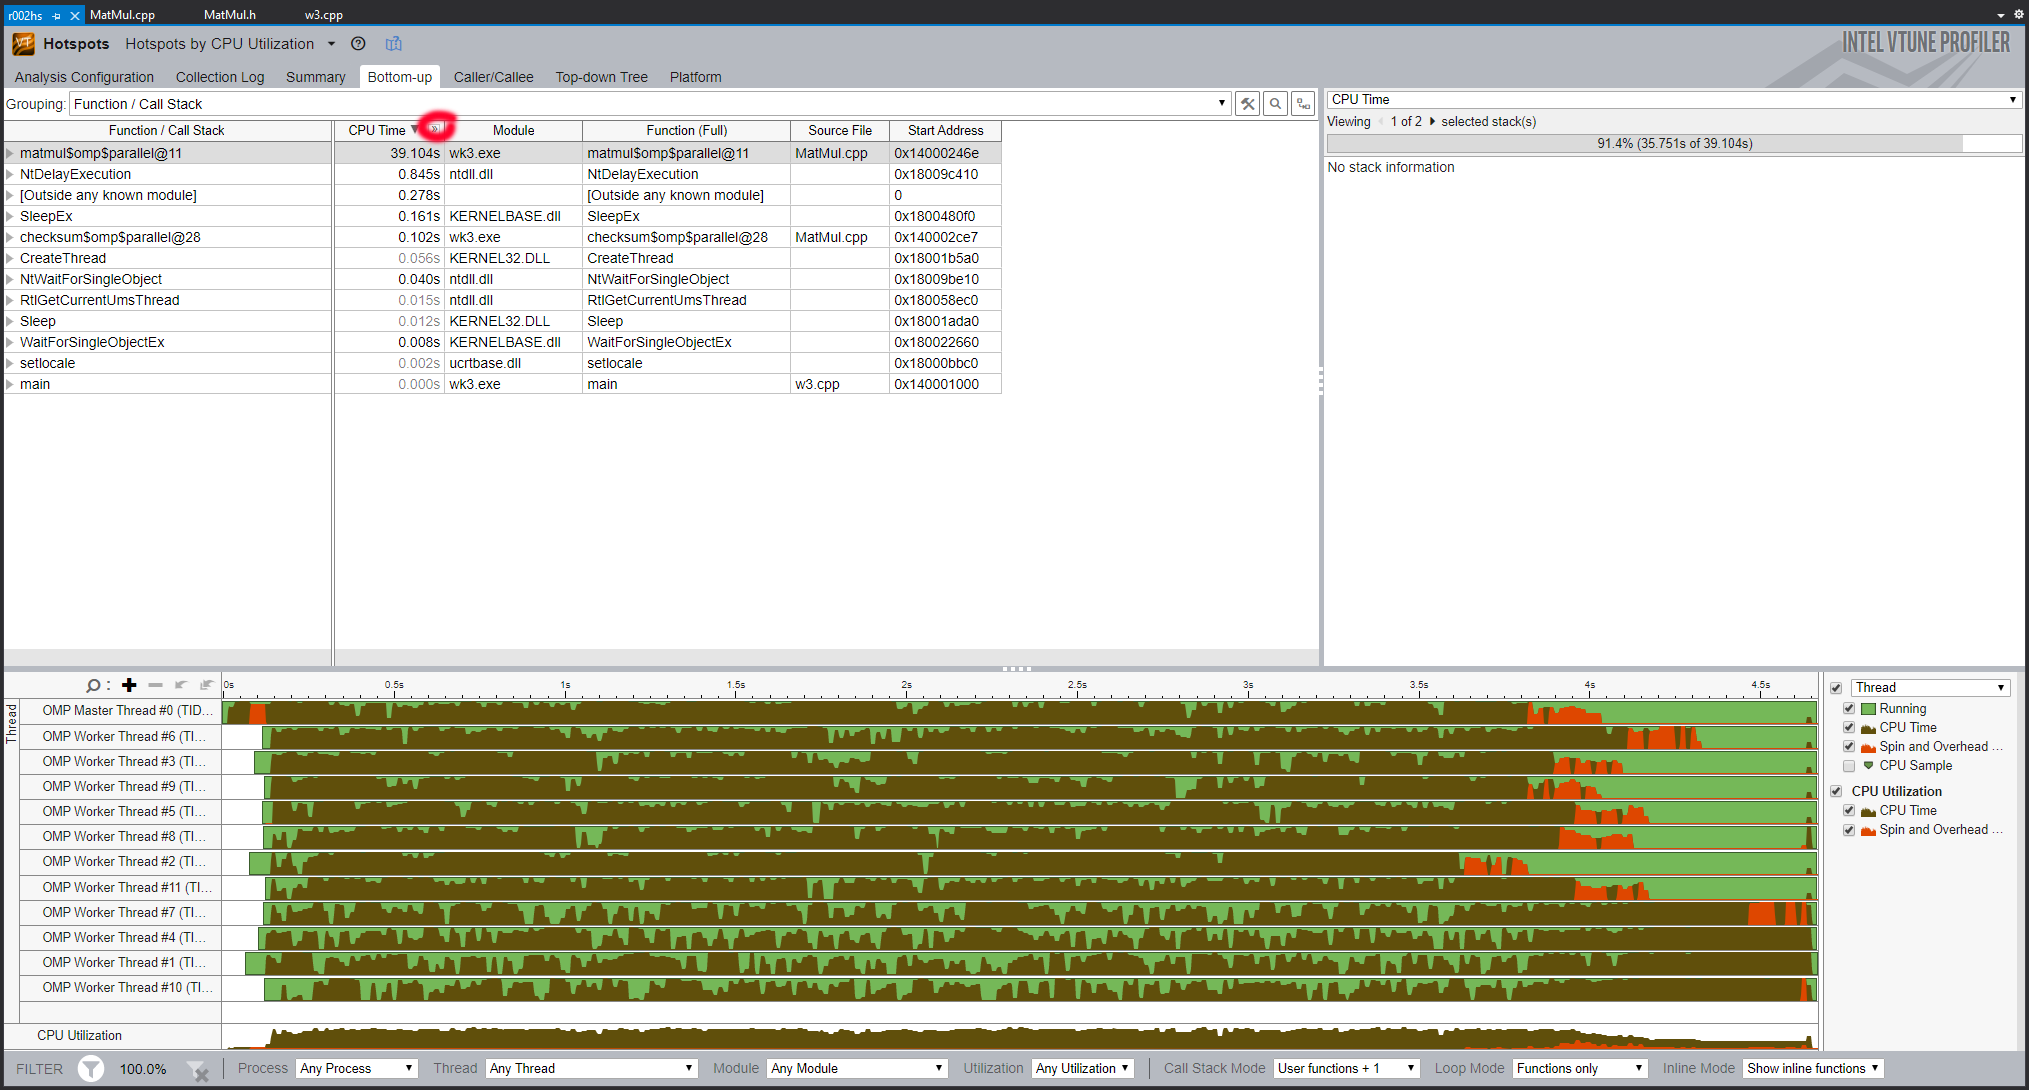
Pressing any of the tasks (or the bottom-up tab at the top) will bring up the bottom-up menu as shown below.
This displays the actual times spent on each thread and if you selected a task when that task takes place.
The CPU time is also displayed here and the brown section indicates how much each (sample rate) section used the CPU in terms of % of total utilization of the program.
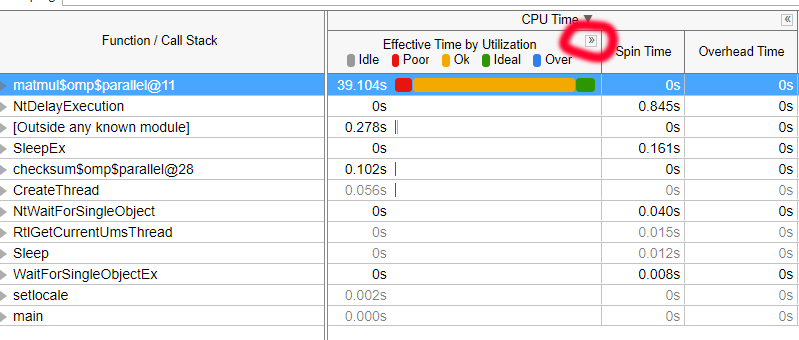
Pressing the highlighted button expands to show what % of the process uses the CPU in the ideal amount (as set on the summary screen) as shown below.
Pressing the highlighted button further expands the data to show in a more detailed fashion how the CPU usage is. As shown below.
Microarchitecture Analysis
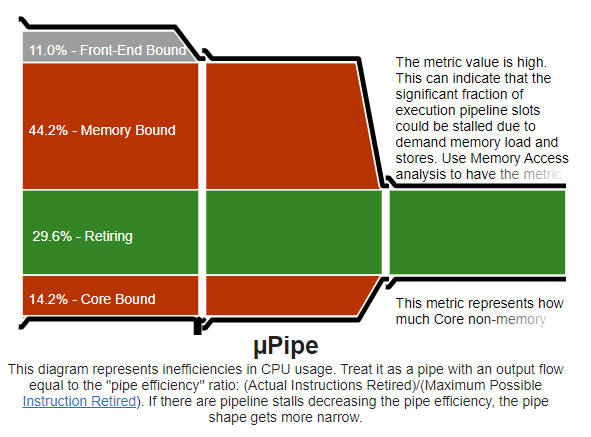
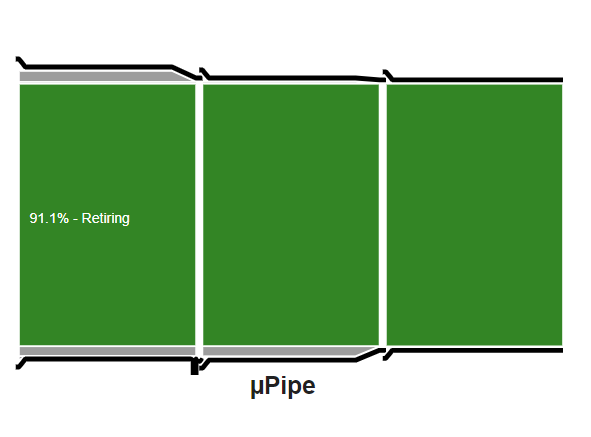
This gives you an idea how efficiently the code is running on your hardware.
An interesting discovery made using this tool is that with Optimization enabled it actually utilizes the CPU less efficiently although it runs faster.
With
Without
History
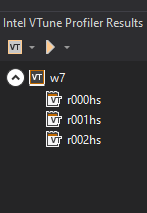
The result history can be seen on the menu on the right, this will allow you to compare previous results.
