Difference between revisions of "DPS921/Intel Parallel Studio Inspector"
| Line 241: | Line 241: | ||
[[File:TimelineResults.png|800px]] | [[File:TimelineResults.png|800px]] | ||
| + | |||
| + | = Presentation = | ||
| + | |||
| + | [[File:Presentation.ppt|800px]] | ||
= Reference = | = Reference = | ||
Revision as of 13:38, 29 November 2020
Contents
Group Members
Project Description
The scope of the project is to do determine how useful Intel Inspector is and how to use the debugging feature. The topics we are going to cover today is; what is Intel Parallel Studio Inspector, what are the pros and cons, and how to use Intel Parallel Studio Inspector. The goal of this is to educate ourselves and our classmate the importance of Intel Parallel Studio Inspector and how to use it.
What is Intel Parallel Studio Inspector
Intel Inspector is an easy-to-use memory and threading error debugger for C, C++, and Fortran applications that run on windows and Linux. It helps find and fix problems- such as memory leaks and deadlocks-before they hinder productivity and time-to-market. Inspector is a correctness checking program that helps you find and fix problem like memory leaks and deadlocks. There are two distinct side of the inspector coin design to target specific type of problem: threading error and memory error. Inspector is a correctness checking program that helps you find and fix problem like memory leaks and deadlocks. There are two distinct side of the inspector coin design to target specific type of problem: threading error and memory error.
Reliability: find deadlocks and memory errors that cause lockups & crashes
Security: Find memory and threading vulnerabilities used by hackers
Accuracy: Identify memory corruption and race conditions to eliminate erroneous results
Different Deadlock Analysis Level
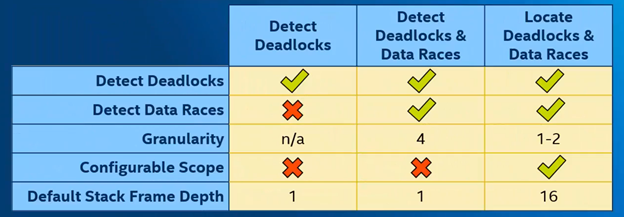
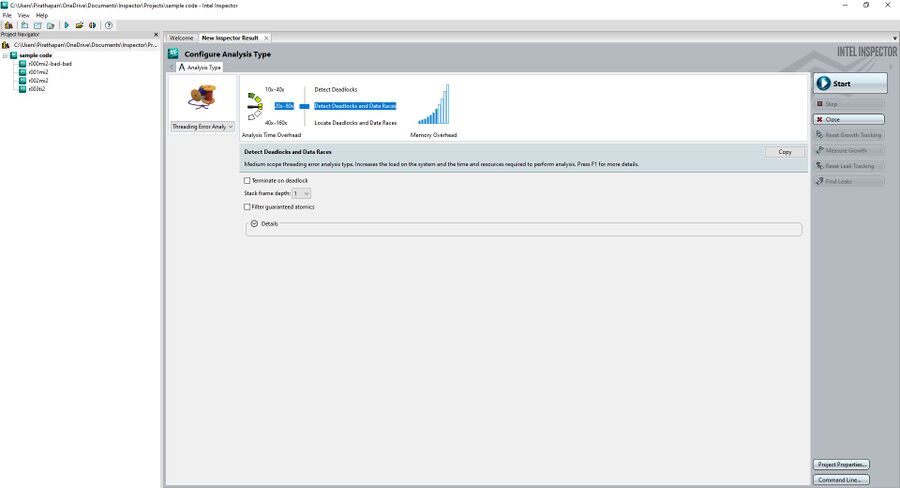
The threading and memory focus each level of analysis. Which progressive gets more details in cost of higher overhead. Each level are level 1: detects deadlock, level 2: detect deadlocks & data races, and level 3: locate deadlocks & data races.
Detect Deadlocks: when two or more threads are permanently stuck because no thread will give up its current lock until it can take the next one. But that lock is being held by another thread in the same position.
Detect deadlocks & data races: will do exactly what I explained earlier plus detect data races. Data races is when the outcome of an operation can change depending on what order the thread reached in.
Locate deadlocks & data races: is more detail with a smaller granularity deeper default stack frame depth and configurable scope.
Different Memory Leak Analysis Level
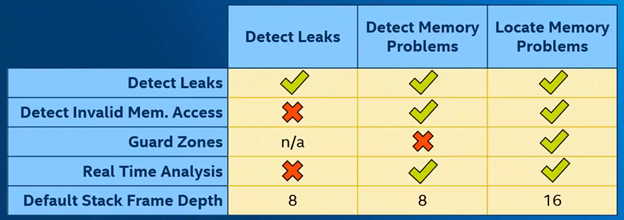
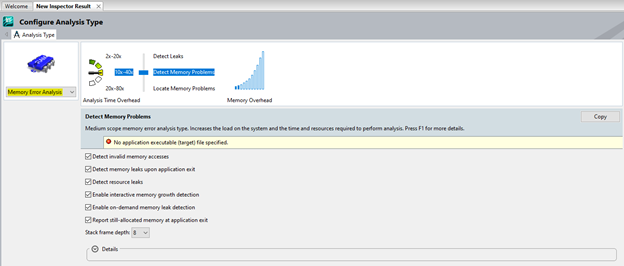
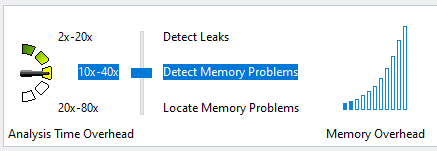
The three levels for memory error analysis are detect leaks, detect memory problems and locate memory problems.
Detect Leaks: just tracks whether the memory allocating gets deallocated.
Detect Memory Problems: Expands on detect leaks by also detecting bad interaction of memory such as invalid memory access, as well as enabling real time analysis.
Locate Memory Problems: Is similar to detect memory problems but more detailed. With a deeper default stack frame depth and guard zones which shows offsets of memory accesses of allocated blocks.
In the inspector the button “Reset Leak Tracking”, stops tracking all currently allocated memory for leaks, discarding associated tracking data without reporting it. The button “Find Leaks” creates a report on the leak status of all currently allocated memory, then stops tracking those blocks. The button “Reset Growth Tracking” discards all currently-tracked memory growth data. Memory currently allocated won’t count towards growth. The button “Measure Growth” creates a report on how much memory usage has grown since the last reset. Does not reset tracking information.
Pros vs Cons
Pros
- The pro of using intel inspector is to fix problems such as memory leaks and deadlocks
- Intel inspector is a dynamic memory and threading error checking instrument to inspect serial and multi-threaded programs
- It is specialized in memory and threading error
- It is much more targeted than other debugging tools
- It integrates with Visual Studio and has his own application
- It has a view windows of the error code on the display
- It can analyze an executable file
Cons
- Hard to navigate
- Takes time to get use to it
- Outdated UI
- Hard and confusing to configurating projects
- It doesn’t support OpenMP and TBB
- It can provide false positive and false negative
- Some version of the inspector is paid version, you have to pay for it
Sample Code for Intel Inspector
TBD
How to use Intel Parallel Studio Inspector
There are two ways to use the Intel Parallel Studio Inspector
Run Inspector directly from Visual Studio
This is the easiest and fastest way that requires no additional configuration.
Once you downloaded intel Inspector application, you need to restart your Visual Studio for the feature to work.
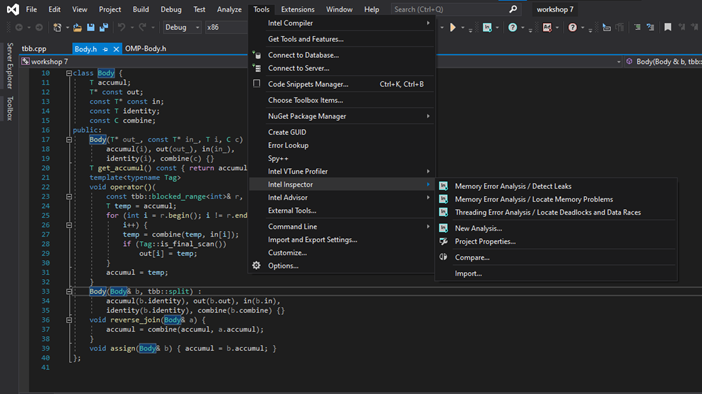
Inside Visual Studio, there are two ways of accessing the inspector debugger. The first way is to go to the tools drop down menu and locate “Intel Inspector”, then you should be able to click on what you want to debug.
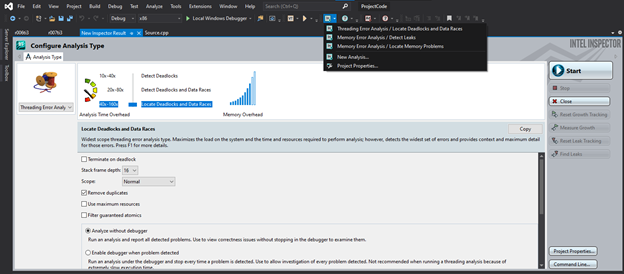
Second way is to locate the inspector icon, few directions right on tools. There will be a drop down menu that should lets you choice what choice of debugging you want to do or start a new analysis.
Run the application via Inspector
Before we start, I want to be able to show you how the Inspector UI looks like as a whole.
Working with intel inspector application requires passing it a compiled version of your program. Additionally, you may need to link some libraries (lib, dll, and etc.)
Configure a Project
Intel suggests using small data set sizes and load threads with small chunks of work.
This will reduce the run time and the speed of the analysis.
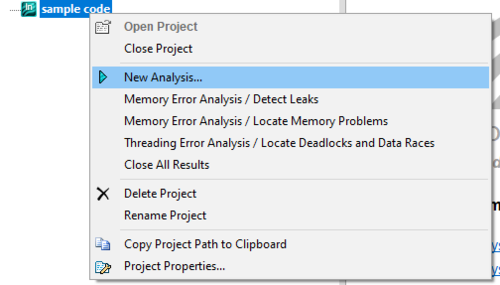
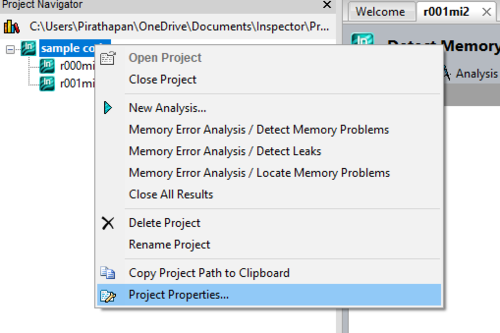
On the left side, right click on the project so that you get a drop-down menu and click “new analysis” to configure a project the way you want it.
Choose Analysis Type
Inspector allows you to choose between predefined types of analysis.
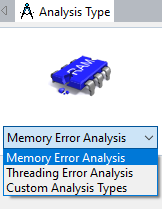
Choose the type of analysis using a drop down menu
Memory Error Analysis:
• Detect Leaks
• Detect Memory Problems
• Locate Memory Problems
Threading Error Analysis:
• Detect Deadlocks
• Detect Deadlocks and Data Races
• Locate Deadlocks and Data Races
Custom Analysis types: users can create their own types based on selected preset type.
In this screenshot, it show cases the different levels for memory error analysis.
Types at the top have smaller scope but faster in execution.
Types at the bottom have larger scope but they are considerably slower.
How it works
Inspector performs the analysis in multiple steps:
1. The program is executed
2. It identifies problems that may need to be resolved
3. Gathers problems
4. Converts symbol information into filenames and line numbers
5. Applies suppresion rules
6. Remove duplicates
7. Create problem sets
8. Opens a debugging session
Making it work
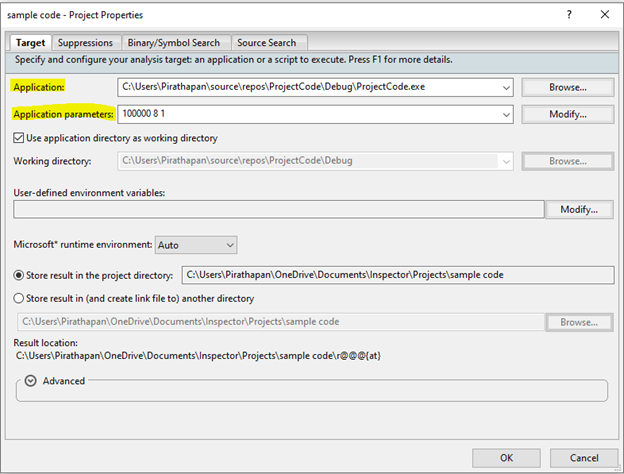
First you need an executable file. You get that building your solution on Visual Studio. Once you have your executable file, you import that to Intel Inspector by using “Project Properties” when you right click on the project located on the left side.
Once you are in the Project Properties section, you need to locate the executable file.
Application section is the executable file. Application section is the command argument, if the application has a command argument.
Interpreting Results
After the analysis completes, IPS XE Inspector will show you information on 2 pages:
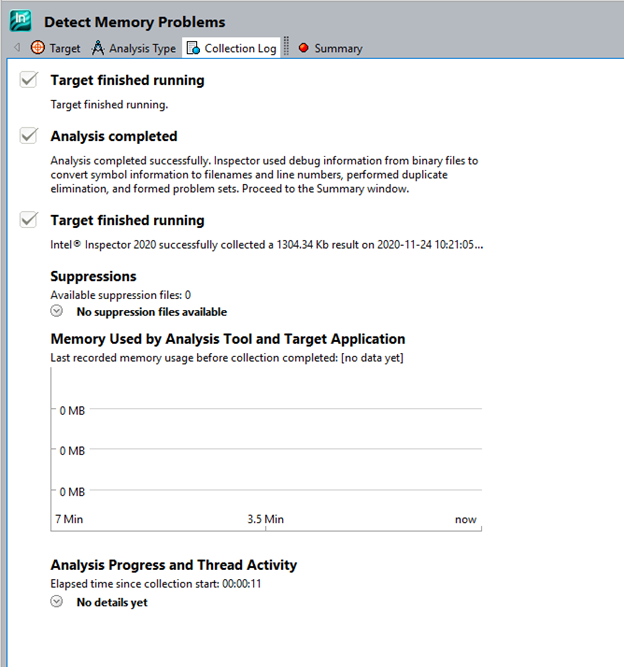
Collection Log
Gives a general information about the execution of the program. From there you can see execution time, number of threads, the caller of threads, if they were active or not.
Summary
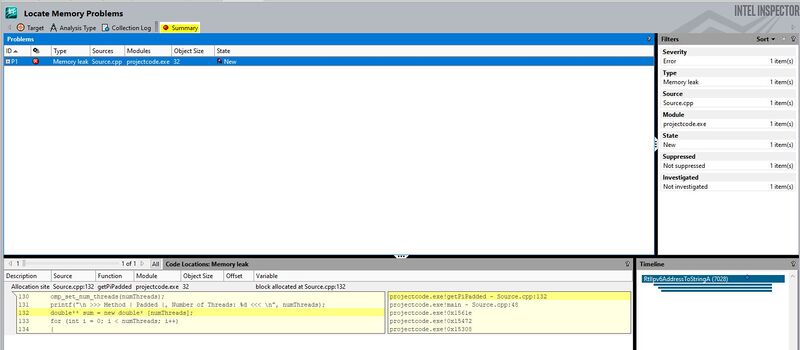
The summary window is divided into 4 parts:
1. Problems section
It shows problems (if any found) that we asked the inspector to look for. It provides you with a name of the problem, the file where the problem is located, the executable module which contains it, and the state of problem (which changes when do you a rescan).
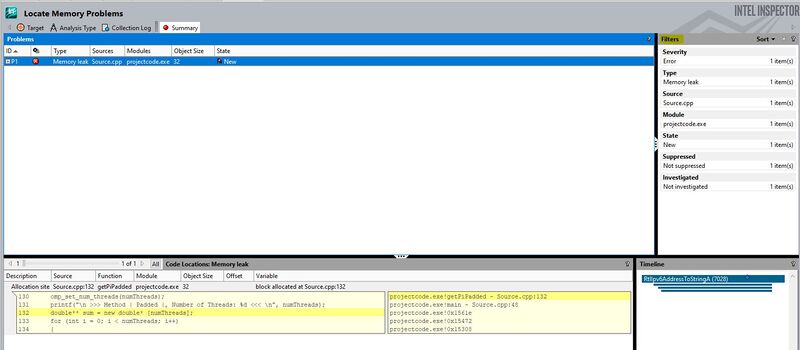
2. Filters (On the right side of the problems section)
Gives the summary of all problems (Sources file affect, total of problems by types, etc)
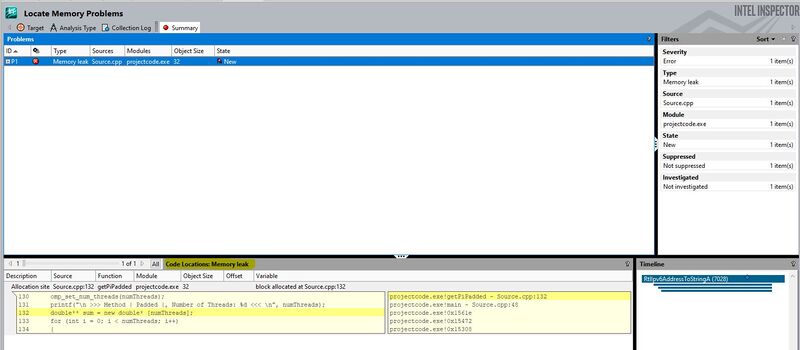
3. Code Locations
When we select a problem, code locations will show a preview of a source file and highlights and line on which the problems was detected.
Moreover, it shows the operation that is performed (Read, Write), including thread operations. Source files can be opened and edited directly from the Inspector by double clicking the problem
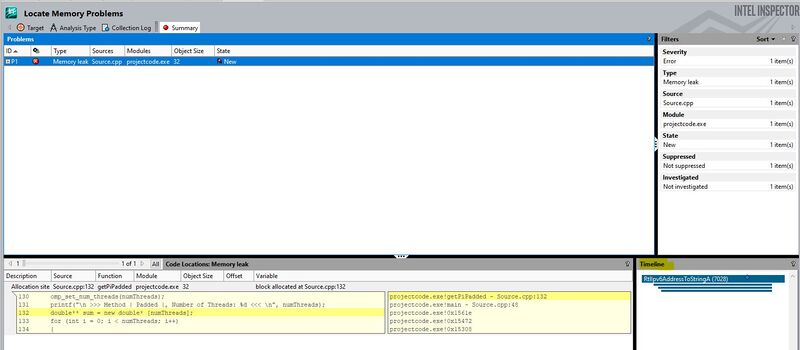
4. Timeline
Shows threads that involved at the certain step. There is a thread and timeline information for all code locations in one or all occurrences of the problem(s) highlighted in the Problems pane
Presentation
Reference
Analyze with Intel® Parallel Studio XE. (n.d.). Intel. Retrieved November 29, 2020, from https://software.intel.com/content/www/xl/es/develop/tools/parallel-studio-xe/analyze.html?countrylabel=Peru
corob-msft. (n.d.). Build and run a C++ console app project. Docs.Microsoft.com. Retrieved November 29, 2020, from https://docs.microsoft.com/en-us/cpp/build/vscpp-step-2-build?view=msvc-160
Get Started with Intel® Inspector -Linux* OS. (n.d.). Intel. Retrieved November 29, 2020, from https://software.intel.com/content/www/us/en/develop/documentation/get-started-with-inspector/top/linux.html
Introduction to Intel® Inspector. (n.d.). Tech.Decoded Powered by Intel® Software. Retrieved November 29, 2020, from https://techdecoded.intel.io/quickhits/introduction-to-intel-inspector/
Visual Studio* Integration. (n.d.). Intel. Retrieved November 29, 2020, from https://software.intel.com/content/www/us/en/develop/documentation/inspector-user-guide-windows/top/before-you-begin/visual-studio-integration.html
Progress
Update 1: Sunday November 8th 2020 - Created basic topic to research for Intel Parallel Studio Inspector
Update 2: Thursday November 26th 2020 - Added all the headings for the report
Update 3: Sunday November 29th 2020 - Adding all the information for the report
