Difference between revisions of "GPU621/Group 6"
Shawn comet (talk | contribs) (→Intel Parallel Studio Inspector) |
Shawn comet (talk | contribs) (→Intel Parallel Studio Inspector) |
||
| Line 9: | Line 9: | ||
Intel Inspector (successor of Intel Thread Checker) is a memory and thread checking and debugging | Intel Inspector (successor of Intel Thread Checker) is a memory and thread checking and debugging | ||
| − | tool to increase the reliability, security, and accuracy of C/C++ and Fortran applications. | + | tool to increase the reliability, security, and accuracy of C/C++ and Fortran applications. It assists programmers |
| + | by helping find both memory and threading errors that occur within programs. This can be very important, as memory errors | ||
| + | can be incredibly difficult to locate without a tool, and threading errors are often non-deterministic, which means that | ||
| + | even for the same input, they can show different behavior on different runs. | ||
| + | |||
| + | [[File:Deterministic_diagram.png]] | ||
'''It can be used with the following''' | '''It can be used with the following''' | ||
Revision as of 10:06, 27 November 2018
Group Members
Intel Parallel Studio Inspector
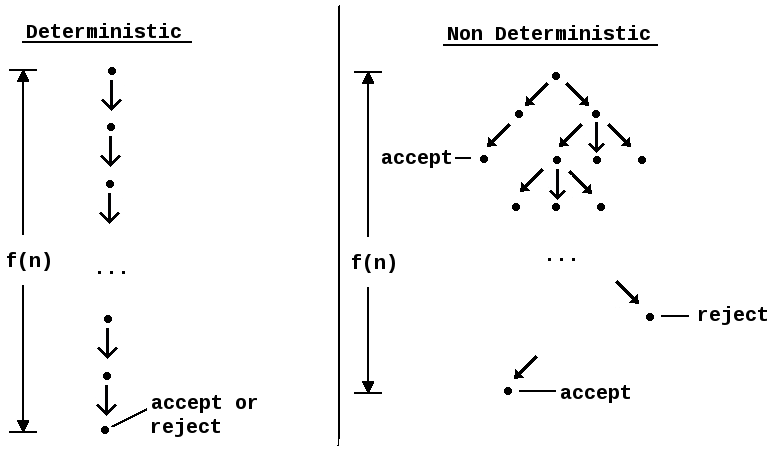
Intel Inspector (successor of Intel Thread Checker) is a memory and thread checking and debugging tool to increase the reliability, security, and accuracy of C/C++ and Fortran applications. It assists programmers by helping find both memory and threading errors that occur within programs. This can be very important, as memory errors can be incredibly difficult to locate without a tool, and threading errors are often non-deterministic, which means that even for the same input, they can show different behavior on different runs.
It can be used with the following
- OpenMP
- TBB (Thread Build Blocks)
- MPI (Message Passing Interface
Memory Errors
- Memory leaks
- Memory corruption
- Allocation and deallocation API mismatches
- Inconsistent memory API usage
- Illegal memory access
- Uninitialized memory read
Threading Errors
- Data races
- Heap races
- Stack races
- Deadlocks
New for 2019
- Find persistence errors like missing or redundant cache flushes. (Persistent memory is an emerging class of memory storage technology.)
- Detect deadlocks on std::shared_mutex (C++17 standard).
- Experience improved compatibility with some antiviruses.
- Use the latest operating systems and Microsoft Visual Studio*.
Levels of Analysis
- The first level of analysis has little overhead. Use it during development because it is fast.
- The second level (shown below) takes more time and detects more issues. It is often used before checking in a new feature.
- The third level is great for regression testing and finding bugs.

