Difference between revisions of "Solo Act"
(→Assignment 2) |
(→Assignment 2) |
||
| Line 46: | Line 46: | ||
| − | [[File:Kerneldecouple.png| | + | [[File:Kerneldecouple.png|450px]][[File:Outputgood.png|450px]] |
Revision as of 18:57, 13 April 2018
Contents
Solo Act
Team Members
- Nick Simas, All of the things.
Progress
Assignment 1
Profile
For assignment 1, I selected an open-source dungeonGenerator project from github.
https://github.com/DivineChili/BSP-Dungeon-Generator/
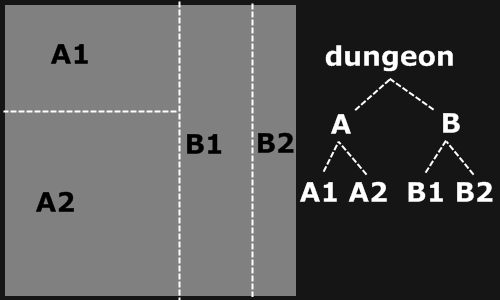
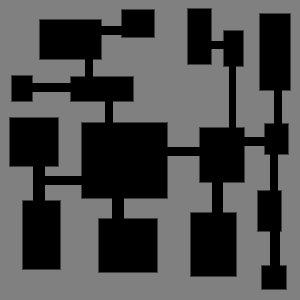
As you can see from the above images, the purpose of this program is to generate a map image for game content. The program achieves this by repetitively splitting a 2d space using a binary partition algorithm.
The project was written for windows, so I decided to initially profile with the built in Visual Studio profiler.
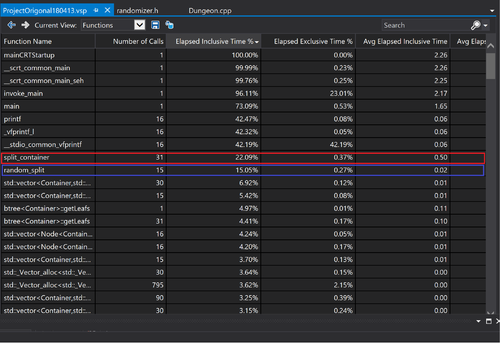
The above image shows the function inclusive time percentage. The results are 22% and 15% respectively. The only entries higher are Main and library components used for printing. This demonstrates that the majority of source code processing is occurring in these two functions. Both of them would thus are hotspots and may benefit from parallelization.
Assignment 2
Parallelize
One of the immediate problems I realized with this project was that the target functions were far too large. Parallelization would require possibly three or more kernels, which was beyond the scope of this assignment. Instead I decided to focus on the bsp tree portion of the code, and decouple this portion from actual dungeon generating logic.
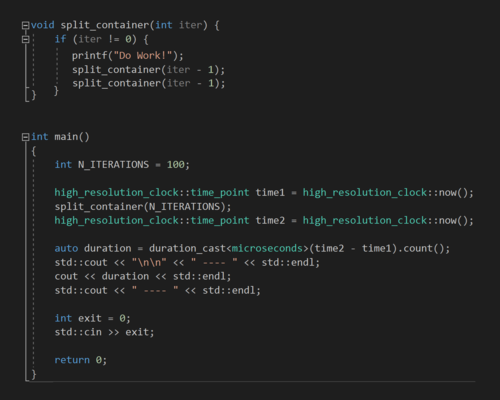
The decoupled source-code can be seen above, along with the timing logic in it's respective main function.
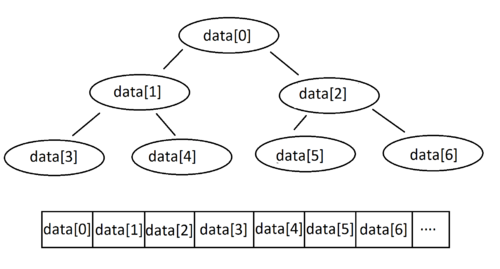
To parrellize a bsp tree required some analysis which can be seen above. The tree itself must be stored in memory according to some design. The way I decided to organize the leafs and nodes of the tree, in a linear context, can be seen below. The above image shows how the tree design corresponds to the linear arrangement in memory.
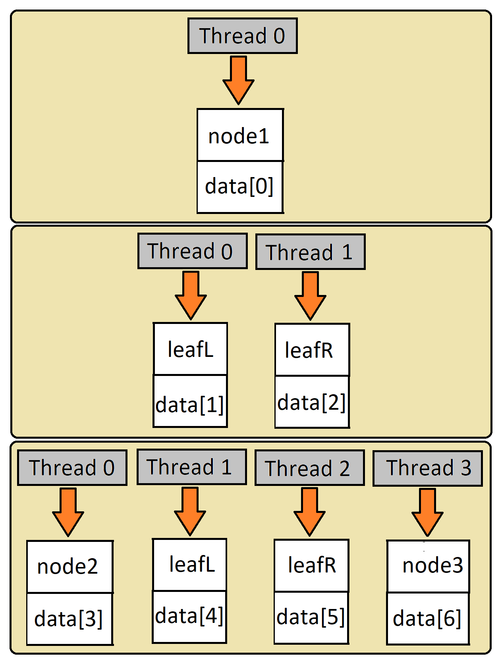
The image above reflects the design I chose with respect to the warps and thread behavior. Each warp processes a single 'round' of the tree, utilizing as many threads equivalent to the number of leaves in that 'round'.
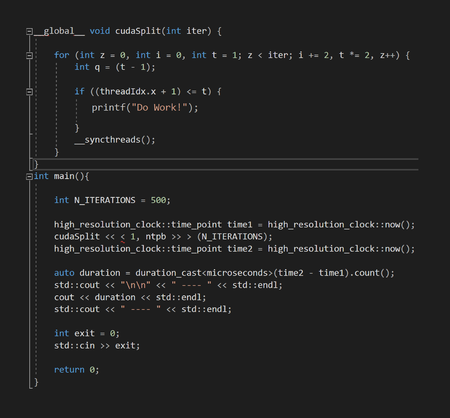
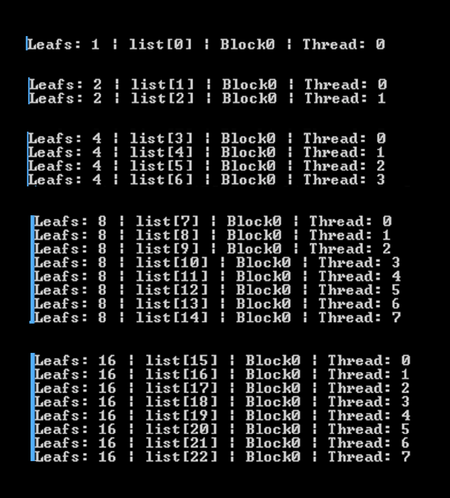
The above image shows the kernel (left) with the benchmarking logic in the main function. The image on the right shows an output example for the first five elements.
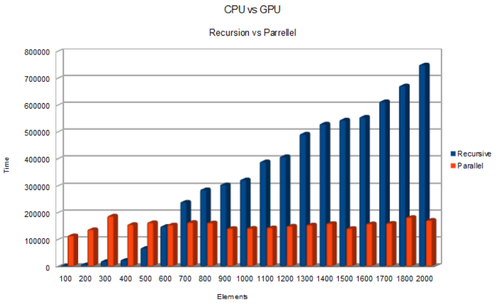
Finally, the graphs above show a comparison in performance between the first, decouple function and the previous kernel. As you can see, the original, recursive function performs faster up until the 600th element where they are equal. The parallel kernel subsequently outperforms the recursive function.
Assignment 3
Optimize
