Difference between revisions of "Team Lion F2017"
Jsbhamber2 (talk | contribs) |
Jsbhamber2 (talk | contribs) |
||
| (15 intermediate revisions by 2 users not shown) | |||
| Line 18: | Line 18: | ||
** Intel System Studio | ** Intel System Studio | ||
| + | Can be run on a local machine | ||
| + | ==Hotspots== | ||
| + | ===Basic hotspot analysis=== | ||
| + | |||
| + | We used our workshop 6 as an example to demonstrate this particular aspect of Intel Vtune Amplifer | ||
| + | |||
| + | [[File:Summary.PNG]] | ||
| + | |||
| + | |||
| + | [[File:Function_timmings.PNG]] | ||
| + | |||
| + | the image above shows the timings for each function | ||
| + | |||
| + | matmul_0 - represents serial version | ||
| + | |||
| + | matmul_1 - represents serial version with reverse logic | ||
| + | |||
| + | matmul_2 - uses cilk_for | ||
| + | |||
| + | matmul_3 - uses cilk_for and reducer hyperboject | ||
| + | |||
| + | matmul_4 - uses cilk_for, reducer and vectorization | ||
| + | |||
| + | |||
| + | ==Parallelism== | ||
| + | |||
| + | ===Concurrency=== | ||
| + | * Best for visualizing thread parallelism on available cores, finding areas with high or low concurrency, and identifying serial bottlenecks in your code | ||
| + | * Provides information on how many threads were running at each moment during application execution | ||
| + | * Includes threads which are currently running or ready to run and therefore are not waiting at a defined waiting or blocking API | ||
| + | * Also shows CPU time while the hotspot was executing and estimates its effectiveness either by CPU usage or by Threads Concurrency | ||
| + | |||
| + | ====Results of Concurrency tests on Workshop 6==== | ||
| + | |||
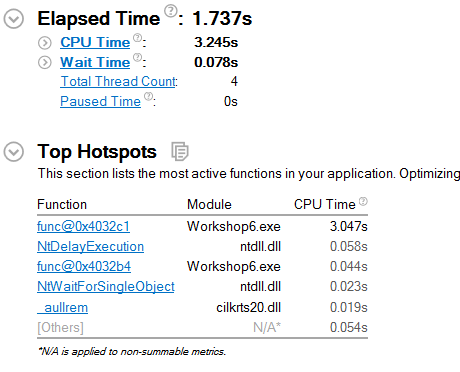
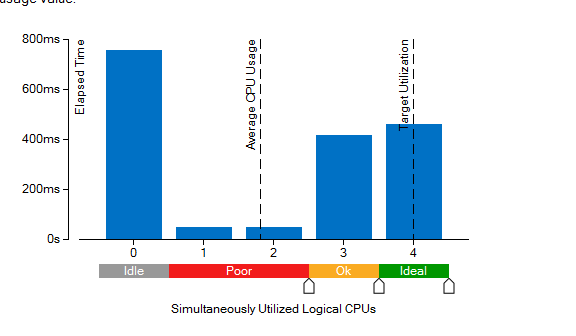
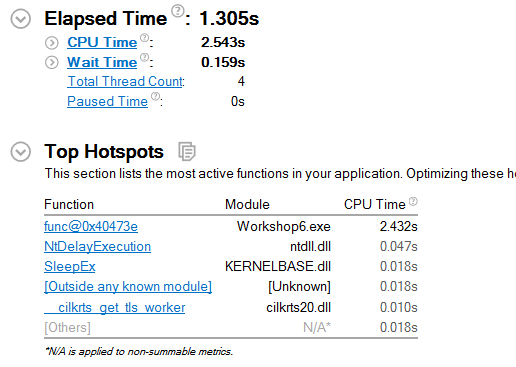
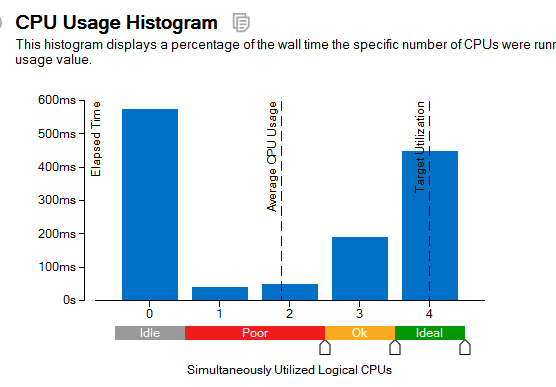
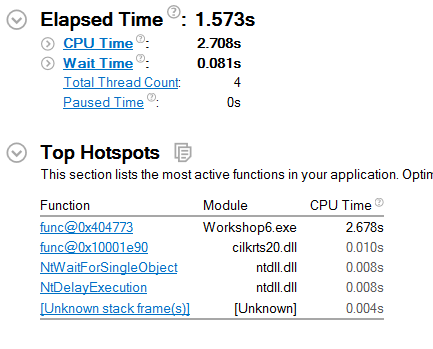
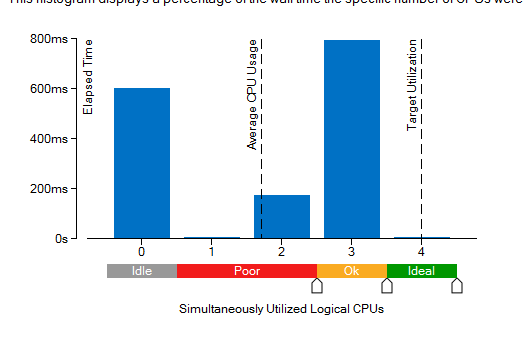
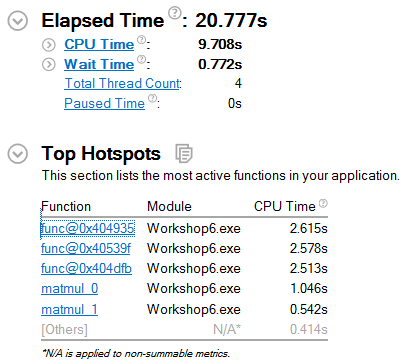
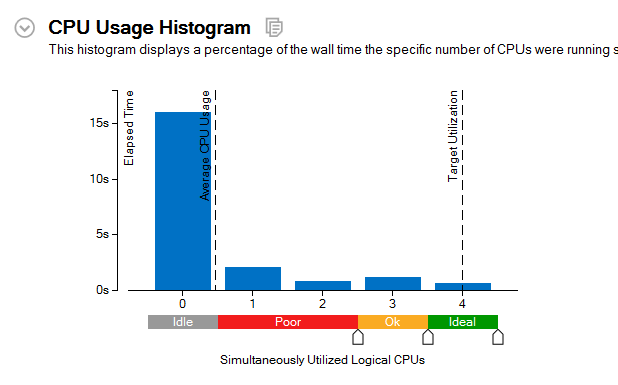
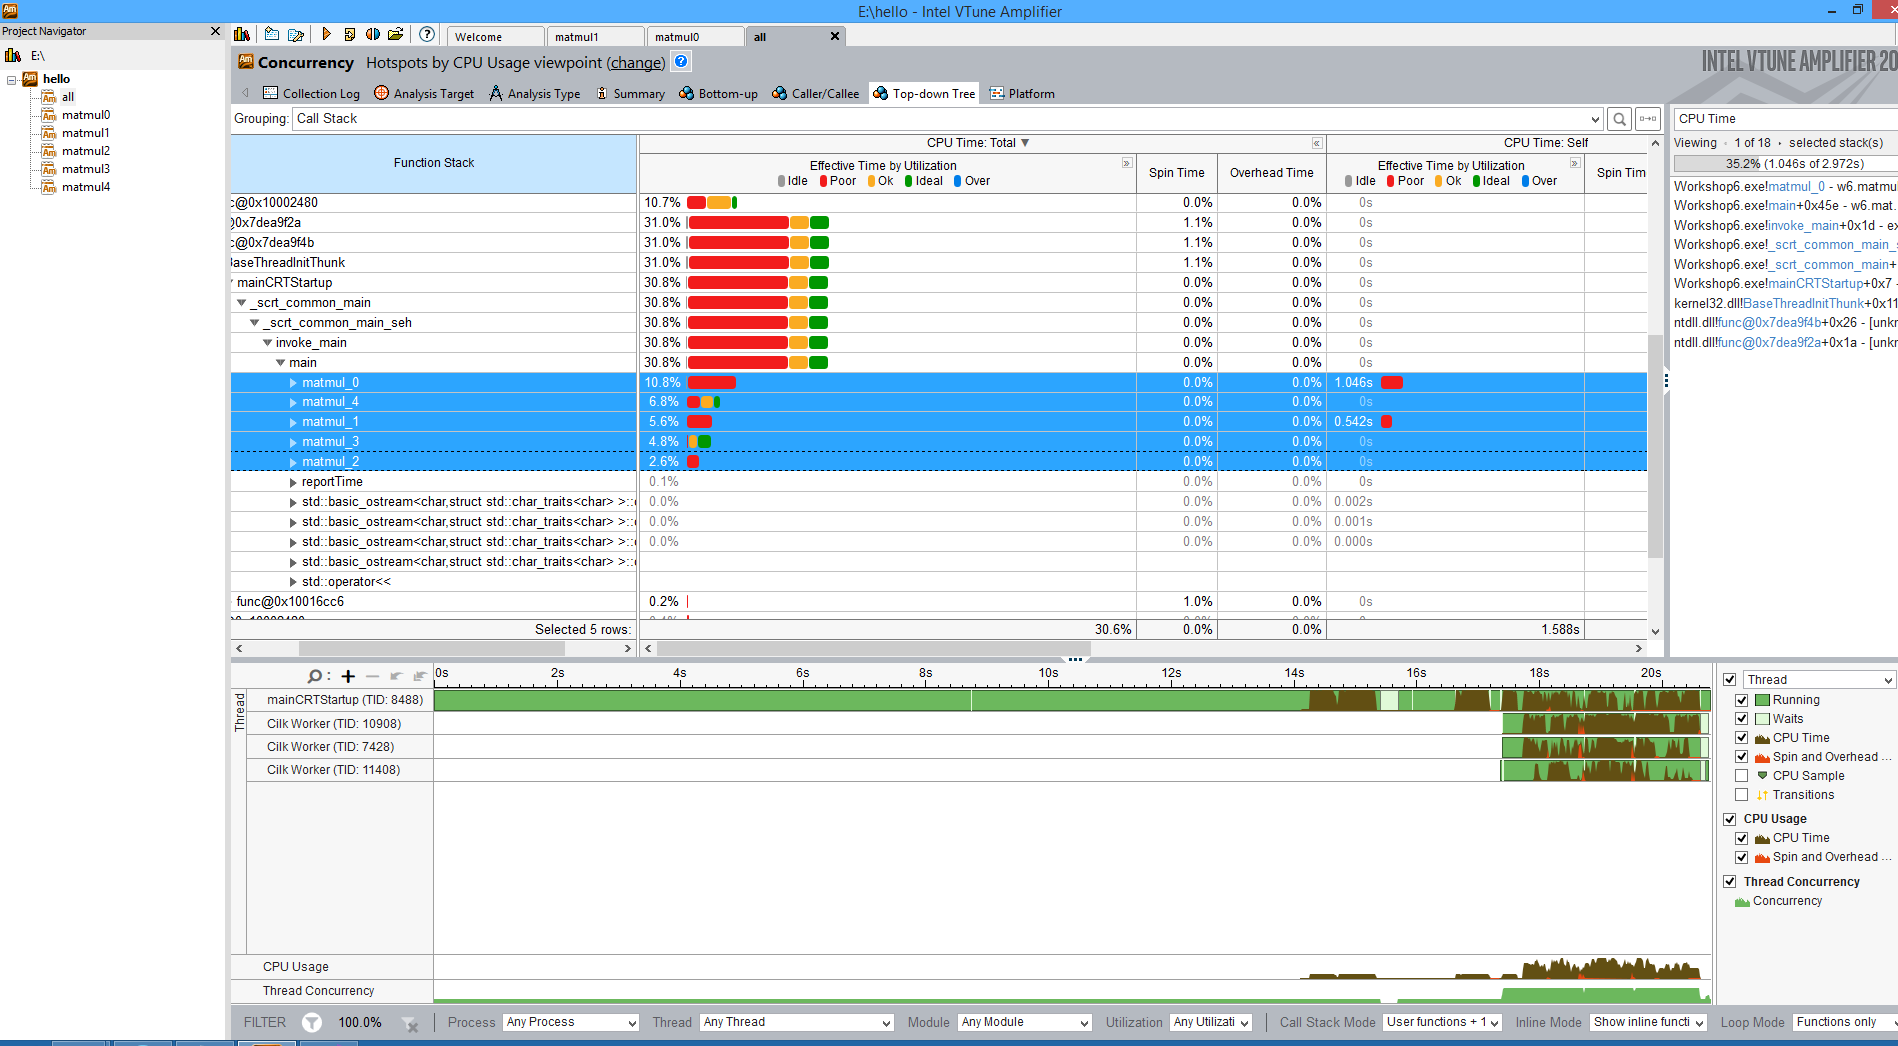
| + | I ran the Concurrency test on each of the functions in Workshop 6. I isolated each function by commenting out all others, then ran them 1 by 1. This was to get an idea of how they perform on their own. Finally I ran them all together to see how the program runs overall. | ||
| + | |||
| + | ====matmul_0 (Serial)==== | ||
| + | |||
| + | <pre> | ||
| + | double matmul_0(const double* a, const double* b, double* c, int n) { | ||
| + | for (int i = 0; i < n; i++) { | ||
| + | for (int j = 0; j < n; j++) { | ||
| + | double sum = 0.0; | ||
| + | for (int k = 0; k < n; k++) | ||
| + | sum += a[i * n + k] * b[k * n + j]; | ||
| + | c[i * n + j] = sum; | ||
| + | } | ||
| + | } | ||
| + | double diag = 0.0; | ||
| + | for (int i = 0; i < n; i++) | ||
| + | diag += c[i * n + i]; | ||
| + | return diag; | ||
| + | } | ||
| + | </pre> | ||
| + | |||
| + | [[File:Conc-01.png]] | ||
| + | [[File:Conc-02.png]] | ||
| + | |||
| + | ====matmul_1 (Serial with j-k loops reversed)==== | ||
| + | |||
| + | <pre> | ||
| + | double matmul_1(const double* a, const double* b, double* c, int n) { | ||
| + | |||
| + | for (int i = 0; i < n; i++) { | ||
| + | for (int k = 0; k < n; k++) { | ||
| + | double sum = 0.0; | ||
| + | for (int j = 0; j < n; j++) | ||
| + | sum += a[i * n + k] * b[k * n + j]; | ||
| + | c[i * n + k] = sum; | ||
| + | } | ||
| + | } | ||
| + | double diag = 0.0; | ||
| + | for (int i = 0; i < n; i++) | ||
| + | diag += c[i * n + i]; | ||
| + | return diag; | ||
| + | } | ||
| + | </pre> | ||
| + | |||
| + | [[File:Conc-11.png]] | ||
| + | [[File:Conc-12.png]] | ||
| + | |||
| + | ====matmul_2 (Cilk Plus with cilk_for)==== | ||
| + | |||
| + | <pre> | ||
| + | double matmul_2(const double* a, const double* b, double* c, int n) { | ||
| + | |||
| + | cilk_for (int i = 0; i < n; i++) { | ||
| + | cilk_for (int j = 0; j < n; j++) { | ||
| + | double sum = 0.0; | ||
| + | for(int k = 0; k < n; k++) { | ||
| + | sum += a[i * n + k] * b[k * n + j]; | ||
| + | } | ||
| + | c[i * n + j] = sum; | ||
| + | } | ||
| + | } | ||
| + | |||
| + | double diag = 0.0; | ||
| + | for (int i = 0; i < n; i++) | ||
| + | diag += c[i * n + i]; | ||
| + | return diag; | ||
| + | } | ||
| + | </pre> | ||
| + | |||
| + | [[File:Conc-21.png]] | ||
| + | [[File:Conc-22.png]] | ||
| + | |||
| + | ====matmul_3 (+array notation, reducer)==== | ||
| + | |||
| + | <pre> | ||
| + | double matmul_3(const double* a, const double* b, double* c, int n) { | ||
| + | |||
| + | cilk_for(int i = 0; i < n; i++) { | ||
| + | cilk_for(int j = 0; j < n; j++) { | ||
| + | double sum = 0.0; | ||
| + | for (int k = 0; k < n; k++) { | ||
| + | sum += a[i * n + k] * b[k * n + j]; | ||
| + | } | ||
| + | c[i * n + j] = sum; | ||
| + | } | ||
| + | } | ||
| + | |||
| + | cilk::reducer_opadd <double> diag(0.0); | ||
| + | cilk_for(int i = 0; i < n; i++) { | ||
| + | diag += c[i * n + i]; | ||
| + | } | ||
| + | return diag.get_value(); | ||
| + | } | ||
| + | </pre> | ||
| + | |||
| + | [[File:Conc-31.png]] | ||
| + | [[File:Conc-32.png]] | ||
| + | |||
| + | ====matmul_4 (+vectorization)==== | ||
| + | |||
| + | <pre> | ||
| + | double matmul_4(const double* a, const double* b, double* c, int n) { | ||
| + | |||
| + | cilk_for(int i = 0; i < n; i++) { | ||
| + | cilk_for(int j = 0; j < n; j++) { | ||
| + | double sum = 0.0; | ||
| + | #pragma simd | ||
| + | for (int k = 0; k < n; k++) { | ||
| + | sum += a[i * n + k] * b[k * n + j]; | ||
| + | } | ||
| + | c[i * n + j] = sum; | ||
| + | } | ||
| + | } | ||
| + | |||
| + | cilk::reducer_opadd <double> diag(0.0); | ||
| + | cilk_for(int i = 0; i < n; i++) { | ||
| + | diag += c[i * n + i]; | ||
| + | } | ||
| + | return diag.get_value(); | ||
| + | } | ||
| + | </pre> | ||
| + | |||
| + | [[File:Conc-41.png]] | ||
| + | [[File:Conc-42.png]] | ||
| + | |||
| + | ====Final test with all functions==== | ||
| + | |||
| + | |||
| + | [[File:Conc-51.png]] | ||
| + | [[File:Conc-52.png]] | ||
| + | |||
| + | [[File:Conc-53.png]] | ||
| + | |||
| + | ===Locks & Waits=== | ||
| + | |||
| + | * Best for locating causes of low concurrency, such as heavily used locks and large critical sections. | ||
| + | * Locks are when threads are waiting too long on synchronization objects. | ||
| + | * Uses user-mode sampling and tracing collection to identify processes. | ||
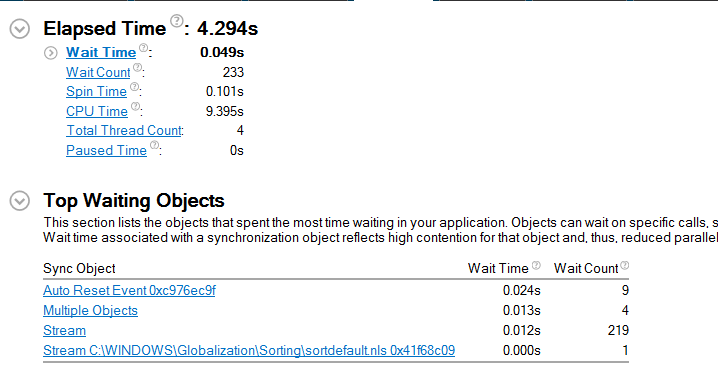
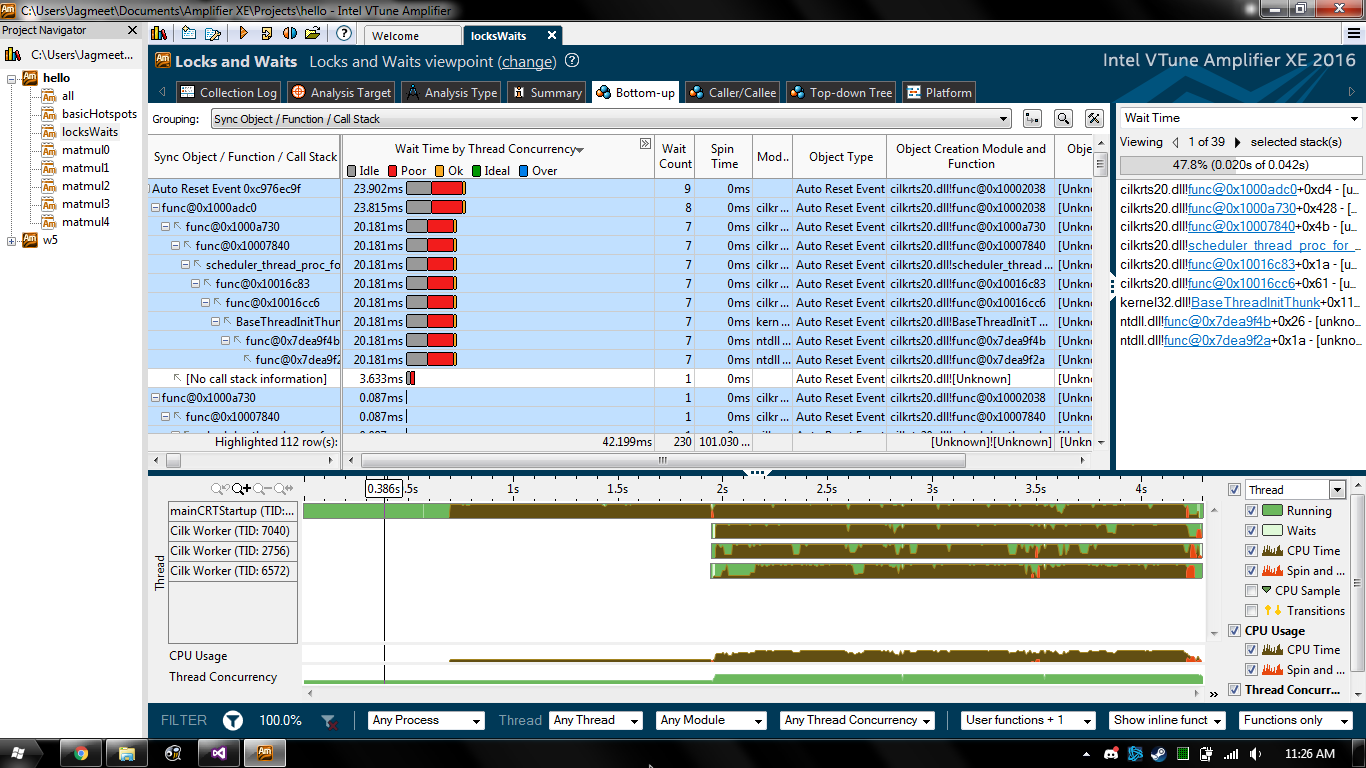
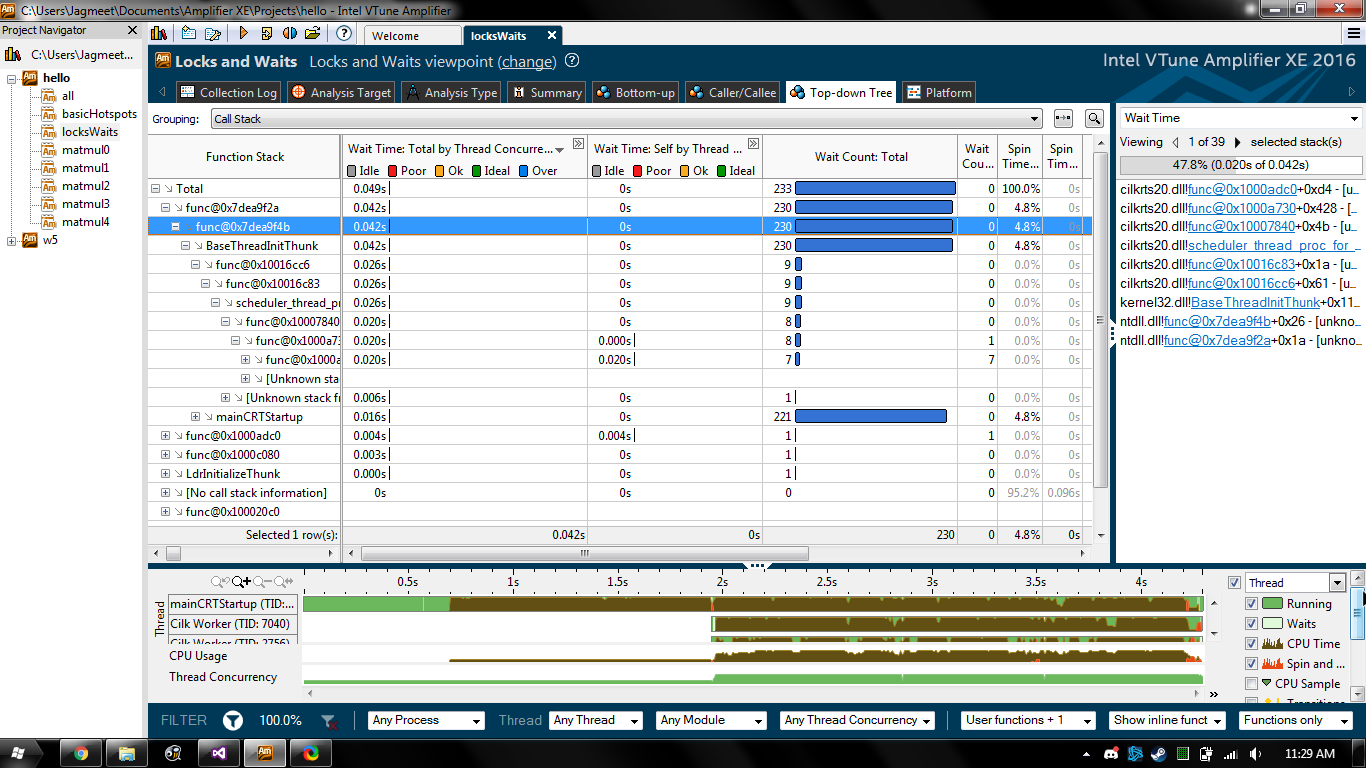
| + | * This analysis shows time spent waiting on synchronizations. | ||
| + | |||
| + | |||
| + | [[File:Lock1.png]] | ||
| + | |||
| + | [[File:Lock2.png]] | ||
| + | |||
| + | [[File:Lock3.png]] | ||
==references== | ==references== | ||
| − | https://en.wikipedia.org/wiki/VTune | + | https://en.wikipedia.org/wiki/VTune |
| + | |||
https://software.intel.com/en-us/get-started-with-vtune | https://software.intel.com/en-us/get-started-with-vtune | ||
| + | |||
| + | https://software.intel.com/en-us/vtune-amplifier-help-analysis-types | ||
| + | |||
| + | https://software.intel.com/en-us/vtune-amplifier-help-basic-hotspots-analysis | ||
| + | |||
| + | https://software.intel.com/en-us/vtune-amplifier-help-advanced-hotspots-analysis | ||
| + | |||
| + | https://software.intel.com/en-us/vtune-amplifier-help-concurrency-analysis | ||
| + | |||
| + | https://software.intel.com/en-us/vtune-amplifier-help-locks-and-waits-analysis | ||
| + | |||
| + | https://software.intel.com/en-us/vtuneampxe_hotspots_win_c | ||
| + | |||
| + | https://software.intel.com/en-us/vtuneampxe_locks_win_c | ||
Latest revision as of 11:53, 5 January 2018
Contents
Group Members
Intel Parallel Studio vTune Amplifier
What is VTune Amplifier?
- A tool created by Intel to provide performance analysis on software.
- Offers both a GUI and command-line version for both Windows and Linux
- GUI only for OSX
- Basic features available on both Intel and AMD processors, but advanced features only for Intel
How to use it?
- Available as a standalone unit or part of the following packages:
- Intel Parallel Studio XE Cluster Edition and Professional Edition
- Intel Media Server Studio Professional Edition
- Intel System Studio
Can be run on a local machine
Hotspots
Basic hotspot analysis
We used our workshop 6 as an example to demonstrate this particular aspect of Intel Vtune Amplifer
the image above shows the timings for each function
matmul_0 - represents serial version
matmul_1 - represents serial version with reverse logic
matmul_2 - uses cilk_for
matmul_3 - uses cilk_for and reducer hyperboject
matmul_4 - uses cilk_for, reducer and vectorization
Parallelism
Concurrency
- Best for visualizing thread parallelism on available cores, finding areas with high or low concurrency, and identifying serial bottlenecks in your code
- Provides information on how many threads were running at each moment during application execution
- Includes threads which are currently running or ready to run and therefore are not waiting at a defined waiting or blocking API
- Also shows CPU time while the hotspot was executing and estimates its effectiveness either by CPU usage or by Threads Concurrency
Results of Concurrency tests on Workshop 6
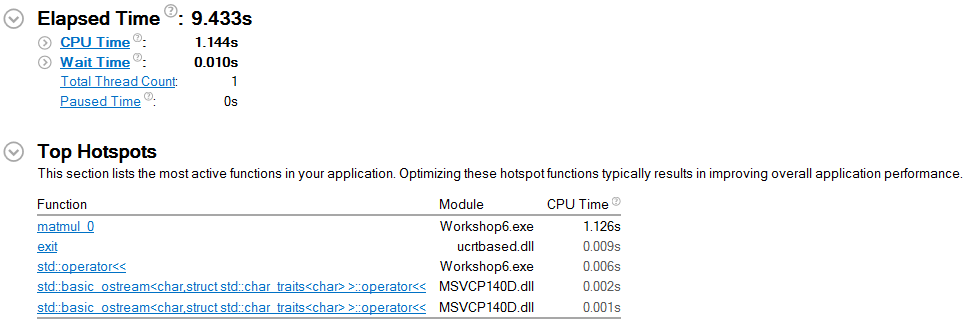
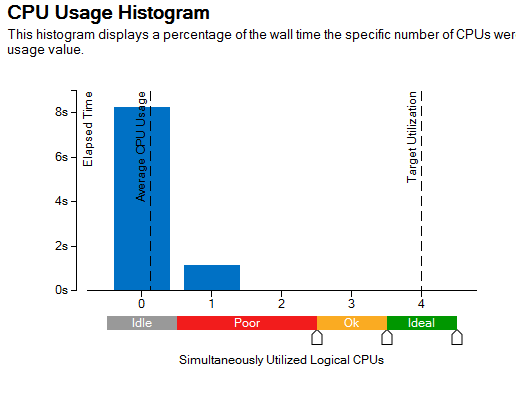
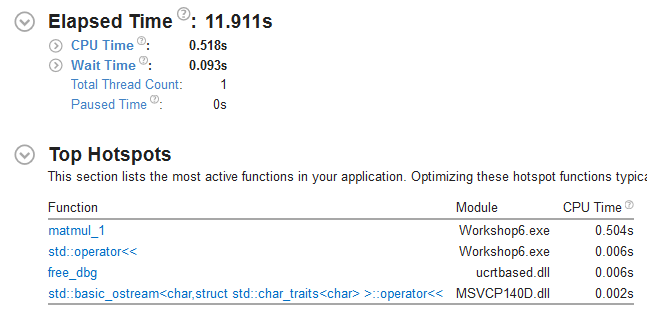
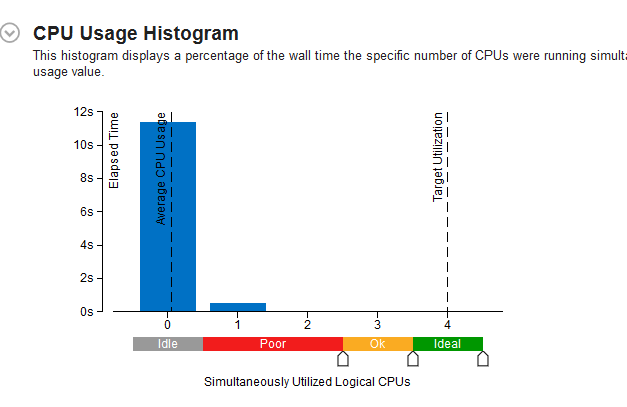
I ran the Concurrency test on each of the functions in Workshop 6. I isolated each function by commenting out all others, then ran them 1 by 1. This was to get an idea of how they perform on their own. Finally I ran them all together to see how the program runs overall.
matmul_0 (Serial)
double matmul_0(const double* a, const double* b, double* c, int n) {
	for (int i = 0; i < n; i++) {
		for (int j = 0; j < n; j++) {
			double sum = 0.0;
			for (int k = 0; k < n; k++)
				sum += a[i * n + k] * b[k * n + j];
			c[i * n + j] = sum;
		}
	}
	double diag = 0.0;
	for (int i = 0; i < n; i++)
		diag += c[i * n + i];
	return diag;
}
matmul_1 (Serial with j-k loops reversed)
double matmul_1(const double* a, const double* b, double* c, int n) {

	for (int i = 0; i < n; i++) {
		for (int k = 0; k < n; k++) {
			double sum = 0.0;
			for (int j = 0; j < n; j++)
				sum += a[i * n + k] * b[k * n + j];
			c[i * n + k] = sum;
		}
	}
	double diag = 0.0;
	for (int i = 0; i < n; i++)
		diag += c[i * n + i];
	return diag;
}
matmul_2 (Cilk Plus with cilk_for)
double matmul_2(const double* a, const double* b, double* c, int n) {

	cilk_for (int i = 0; i < n; i++) {
		cilk_for (int j = 0; j < n; j++) {
			double sum = 0.0;
			for(int k = 0; k < n; k++) {
				sum += a[i * n + k] * b[k * n + j];
			}
			c[i * n + j] = sum;
		}
	}

	double diag = 0.0;
	for (int i = 0; i < n; i++)
		diag += c[i * n + i];
	return diag;
}
matmul_3 (+array notation, reducer)
double matmul_3(const double* a, const double* b, double* c, int n) {

	cilk_for(int i = 0; i < n; i++) {
		cilk_for(int j = 0; j < n; j++) {
			double sum = 0.0;
			for (int k = 0; k < n; k++) {
				sum += a[i * n + k] * b[k * n + j];
			}
			c[i * n + j] = sum;
		}
	}

	cilk::reducer_opadd <double> diag(0.0);
	cilk_for(int i = 0; i < n; i++) {
		diag += c[i * n + i];
	}
	return diag.get_value();
}
matmul_4 (+vectorization)
double matmul_4(const double* a, const double* b, double* c, int n) {

	cilk_for(int i = 0; i < n; i++) {
		cilk_for(int j = 0; j < n; j++) {
			double sum = 0.0;
#pragma simd
			for (int k = 0; k < n; k++) {
				sum += a[i * n + k] * b[k * n + j];
			}
			c[i * n + j] = sum;
		}
	}

	cilk::reducer_opadd <double> diag(0.0);
	cilk_for(int i = 0; i < n; i++) {
		diag += c[i * n + i];
	}
	return diag.get_value();
}
Final test with all functions
Locks & Waits
- Best for locating causes of low concurrency, such as heavily used locks and large critical sections.
- Locks are when threads are waiting too long on synchronization objects.
- Uses user-mode sampling and tracing collection to identify processes.
- This analysis shows time spent waiting on synchronizations.
references
https://en.wikipedia.org/wiki/VTune
https://software.intel.com/en-us/get-started-with-vtune
https://software.intel.com/en-us/vtune-amplifier-help-analysis-types
https://software.intel.com/en-us/vtune-amplifier-help-basic-hotspots-analysis
https://software.intel.com/en-us/vtune-amplifier-help-advanced-hotspots-analysis
https://software.intel.com/en-us/vtune-amplifier-help-concurrency-analysis
https://software.intel.com/en-us/vtune-amplifier-help-locks-and-waits-analysis
