Difference between revisions of "Debugging Parallel Programs in Visual Studio / Team Debug"
Ashimazaki (talk | contribs) m (→Walkthrough) |
Ashimazaki (talk | contribs) m (→Walkthrough) |
||
| Line 357: | Line 357: | ||
If the option was on, the result is this. | If the option was on, the result is this. | ||
| − | + | ||
On a laptop coputer | On a laptop coputer | ||
Intel® Core™ i7-6500U Processor/ Performance - # of Cores 2 #of Threads 4 | Intel® Core™ i7-6500U Processor/ Performance - # of Cores 2 #of Threads 4 | ||
[https://ark.intel.com/products/88194/Intel-Core-i7-6500U-Processor-4M-Cache-up-to-3_10-GHz] | [https://ark.intel.com/products/88194/Intel-Core-i7-6500U-Processor-4M-Cache-up-to-3_10-GHz] | ||
| + | [[File:openResult.png|400px|center|openResult]] | ||
| − | |||
On one of school desktop computer | On one of school desktop computer | ||
Intel® Core™ i7-4790 Processor / Performance - # of Cores 4 #of Threads 8 | Intel® Core™ i7-4790 Processor / Performance - # of Cores 4 #of Threads 8 | ||
| − | [https://ark.intel.com/products/80806/Intel-Core-i7-4790-Processor-8M-Cache-up-to-4_00-GHz | + | [https://ark.intel.com/products/80806/Intel-Core-i7-4790-Processor-8M-Cache-up-to-4_00-GHz] |
| − | ] | + | [[File:8t.png|400px|center|openResult]] |
| + | |||
Abobe code consists of three part. | Abobe code consists of three part. | ||
| − | The first is a serial region, the second is an OpenMP parallel region, the third is an OpenMP parallel region | + | The first is a serial region, the second is an OpenMP parallel region, the third is an OpenMP parallel region that thread number specified by the code |
TO check each region, we put markers on the lines that print the number of the thread currently using. | TO check each region, we put markers on the lines that print the number of the thread currently using. | ||
Once click "start debugging", the debugger stops at the first breakpoint. You can chase the steps by using "Continue" button. | Once click "start debugging", the debugger stops at the first breakpoint. You can chase the steps by using "Continue" button. | ||
| Line 381: | Line 382: | ||
You can see "Stack Frame" name on the top screen is changed to main\omp\1 | You can see "Stack Frame" name on the top screen is changed to main\omp\1 | ||
| − | On the Threads window, you can see "main thread" and other new three thread which same as default usable thread number 4 (it is printed | + | On the Threads window, you can see "main thread" and other new three thread which same as default usable thread number 4 (it is printed in the serial region as "omp_get_max_threads()"). after hitting 4 times (you can see the count on the breakpoint Window), the step goes to the next region. |
[[File:open.png|1000px|center|open]] | [[File:open.png|1000px|center|open]] | ||
Revision as of 09:27, 21 December 2017
Group Members
Process and thread
Multiple Processes
Processes
Why would you have multiple projects in one solution? https://stackoverflow.com/questions/8678251/benefits-of-multiple-projects-and-one-solution
- Use of services
- Custom setup actions
- Working multiple languages
- Creating libraries used in different places
- Large programs could be made up of many smaller projects for better management
- Working with multiple applications that interact with each other
Configuration
https://msdn.microsoft.com/en-us/library/jj919165.aspx
By default breaking/stepping/stopping applies to all other processes, but can be changed.
Changing this option:
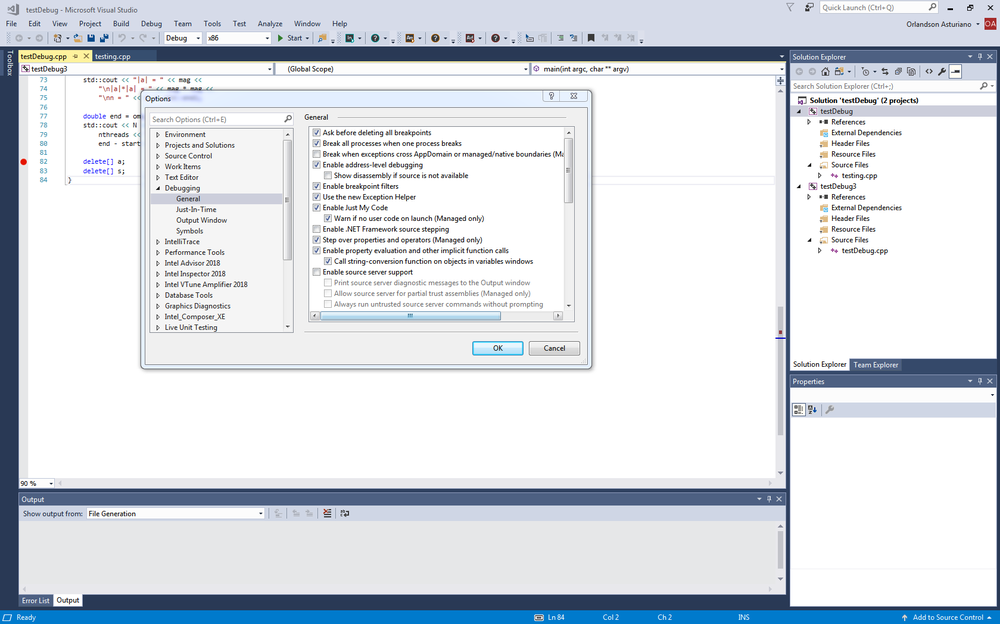
- 1. On debug menu, pick options and settings
- 2. Go to general page and toggle "Break all processes when one process breaks" checkbox
Multiple processes
If you have more than one project in a project solution, you can choose which projects the debugger starts.
To do this:
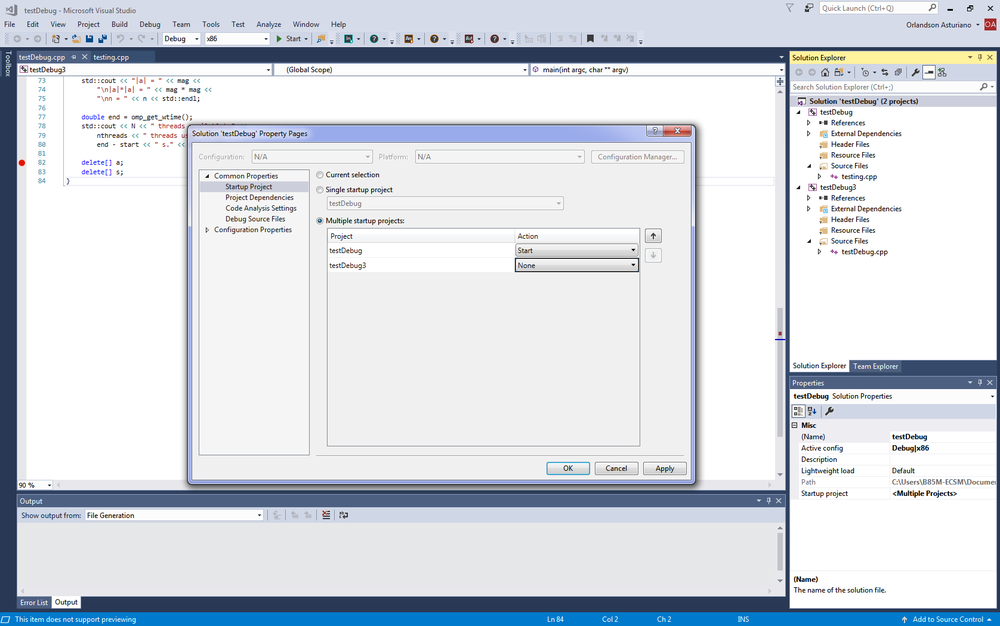
- 1. Right click your solution in solution explorer
- 2. Select Set Startup Projects
- 3. Then set the projects action to Start, Start without debugging or none
You could also attach a process outside of the debugger to the debugger, including processes on a remote device but your inspection ability is limited.
- 1. Choose the Debug menu ant click Attach to Process
- 2. Select the process you want to attach
You could also set process to automatically start in the debugger which is useful for services and custom setup actions.
- 1. Start regedit
- 2. Got to HKEY_LOCAL_MACHINE\Software\Microsoft\Windows NT\CurrentVersion\Image File Execution Options
- 3. Select the folder of the application you want to start in debugger
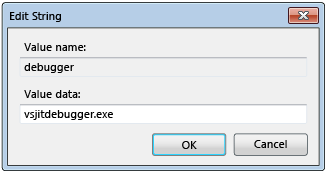
- 4. In the folder right click and choose New, String Value.
- 5. Set name of new value from New Value to debugger.
- 6. Right clikc the new value and choose Modify.
- 7. On the Edit String dialog box, type vsjitdebugger.exe in the Value data box.
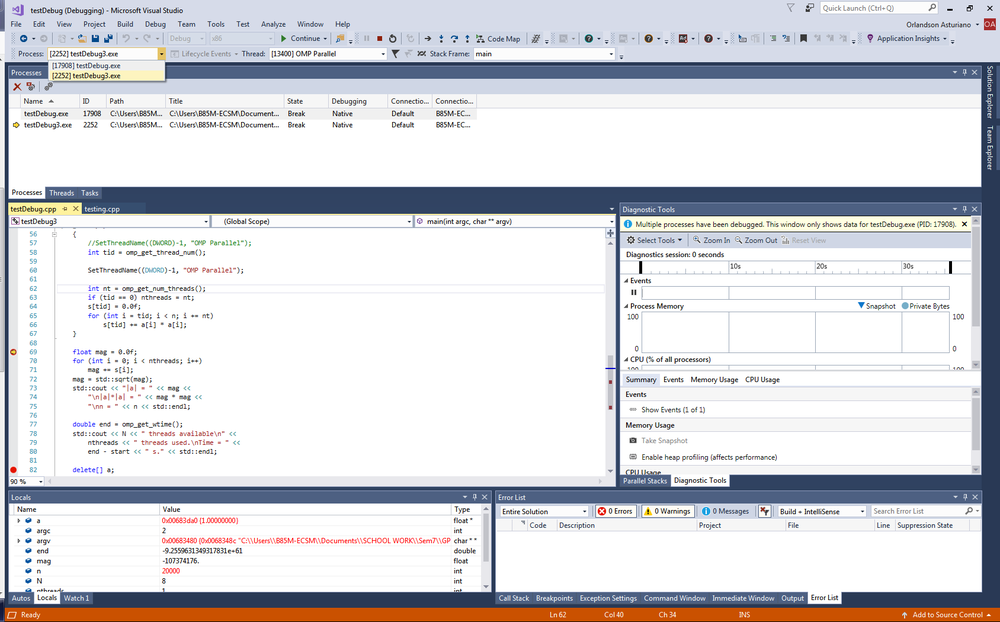
When you have multiple processes, only one process is active in the debugger, but in order to switch between processes you must also be in break mode.
When you switch to a process, all windows will show information for that process only.
When you stop debugging, if the current process was launched from the debugger it will terminate, however if you attached the debugger to the current process (attach to a process outside of Visual Studios), then the debugger will detach and leave that process running.
Thread
Multiple Threads
A process can have multiple threads.
difference
Multiple Processes doesn't share memory, while multiple Threads share memory. They can access the same data easily.
Thread enable the parallel programming but the parallel condition can have risks.
- Race Conditions - The results go wrong way by the order of thread work.
- Dead Lock - All thread wait for the other thread forever.
User Interface
Attach to Process dialog box
Processes window
The Process Window shows processes attached to the Visual Studio debugger
Setup:
1. When you start debug (F5), click on DEBUG > Windows > Processes.
2.
3. Terminate or Attach the process by using "Terminate Process" and "Attach to Process "icon.
How to Use:
Select threads
Threads window
The Thread Window shows Thread list with the detailed information in your application, You can filter thread list and see the particular information.
Setup:
1. When you start debug (F5), click on DEBUG > Windows > Threads.
2. You can filter by using flag and "Show Flag Threads Only" icon on the top of the Thread window.
3. You can show and hide the information columns by using "Columns" dropdown list on the top of the Thread window.
How to Use:
Turn on flags on the thread you want to see, and choose "Show Flag Threads Only" to filter them. Choose which information to show or hide from the "Columns" dropdown list. Sort the list by the information on the column by using "Group by" dropdown list if it is necessary.
Columns:
- flag column: you can mark a thread with red flags to pay attention or to filter them.
- active thread column: a yellow arrow indicates an active thread. An outline of an arrow indicates the thread where execution broke into the debugger.
- ID: the identification number for each thread. (It is DWORD: a typedef of 32bit integer)
- Managed ID: the managed identification numbers for managed threads.
- Category: categorizes threads as user interface threads, remote procedure call handlers, or worker threads and main threads
- Name: thread name if it has, otherwise shows <No Name>.
- Location: where the thread is running (function name that is associated with the thread, or the address).
- Priority: the priority of the scheduling of the thread that the system has assigned to each.
- Affinity Mask: determines which processors on which a thread can run In a multiprocessor system.
- Suspended Count: The number of times that the thread suspended.
- Process Name: the process to which each thread belongs.
Source window
The Source window displays source code
Setup:
1. When you start debug (F5), it shows up automatically
2. If you closed the window, you can open by clicking any related information on the other windows.
How to Use:
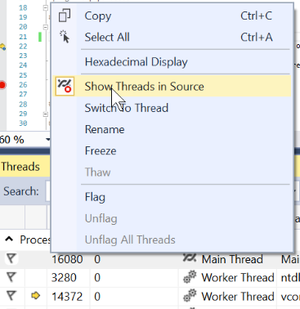
On the top of the window, Turn on an icon called "Show Threads in Source" that is off by default.
Or you can do on and off from right-click menu on the thread window.
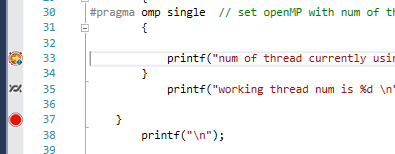
On the gutter, you can see thread icon where the threads are currently working. Also, you can check the detail of the threads with mouse over.
When the thread is single (at the beginning of the threading):
When the thread is multiple.
Debug Location toolbar
The Debug Location toolbar shows where the current line (pointed by a yellow arrow in the other windows) is located or enable to choose current line by the location.
Setup:
1. When you start debug (F5), click on View >Toolbars > Debug Location
How to Use:
See the location information (Process, Thread, Stack Frame) on the current line,
or pick a location that you want to make a current line.
Parallel Stacks window
The Parallel Stacks Window shows call stack information for all the threads in your application. You can focus on different threads and see the stack frames for them.
Setup:
1. When you start debug (F5), click on Debug > Windows > Parallel Stacks.
2. To be able to see more detailed debug info in the Parallel Stacks Window, go to Debug > Options, and under Debugging > General uncheck "Enable Just My Code", and under Debugging > Symbols put a checkmark on "Microsoft Symbol Servers". This will give more descriptive content for stack frames within the Parallel Stacks Window.
How to Use:
As you step to each breakpoint in your debug program, the Parallel Stacks Window will show all of the threads at that point in your program, and their call stacks.
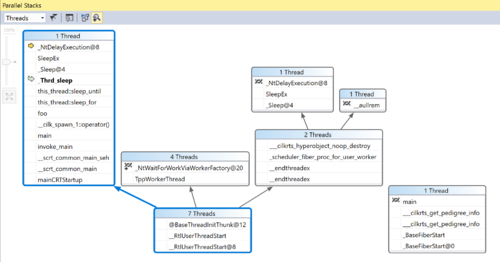
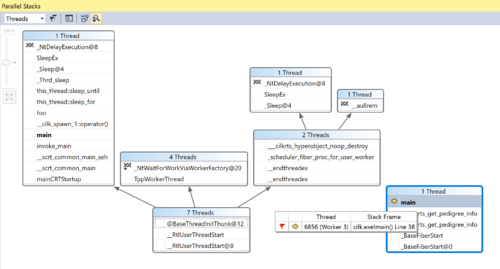
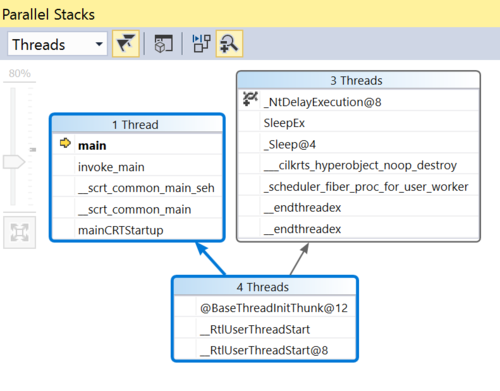
For example, at this breakpoint of a program, here are all of the threads, as per the Threads Window:
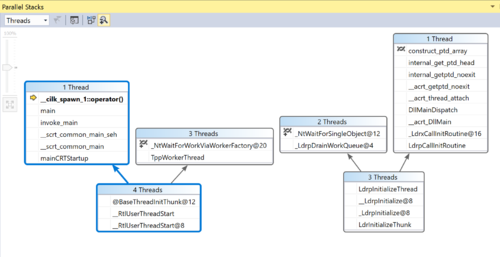
And this is the corresponding Parallel Stacks Window:
There are a total of 7 threads. The Active one is the one with the yellow arrow in the Threads View, which is "Main Thread", and correspondingly, this active thread will have blue-highlighted boxes in the Stacks View, which represents the whole stack for that thread. A stack consists of one or more stack frames, which are represented by each of the rows inside the boxes. The yellow arrow shows where the stack frame actually is, and we can see all of the previous stack calls for that thread. A box represents the call stack that is common for 1 or more threads, until they break off into their own individual stacks. So for the Main Thread's stack, we see that it originated in a call segment that 4 threads were part of, of which the Main Thread split off into its own segment on the left, and 3 other threads split off into another segment. The other 3 threads started in a different stack segment, as shown on the bottom right box, and got separated into two different segments.
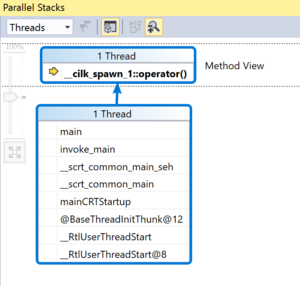
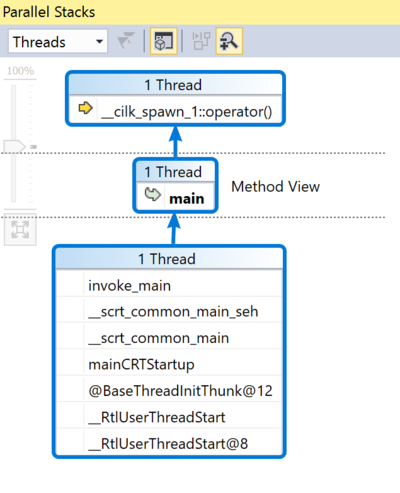
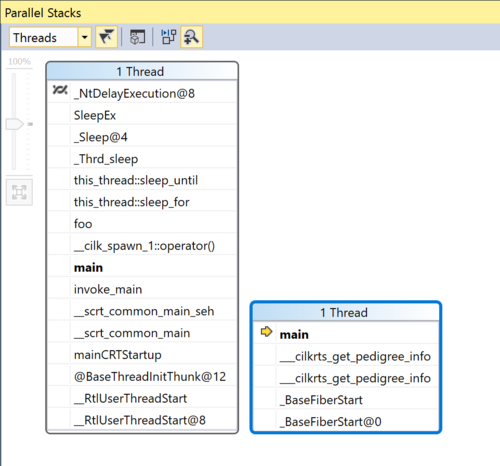
We can also see a Method View. By clicking on the "Toggle Method View" icon on the top of the Window, we will see the current highlighted thread stack in an organization that shows the call stack for only that thread, with a focus on the method that calls the current selected stack frame, as well as the method it calls. Here is the Method View for the current thread:
And if we double click on any of the other stack frames, it will be made the focus of the view, with the calling method below it and the called method above:
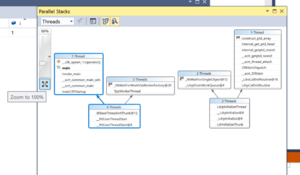
If our Window is too small that it doesn't fit the entire diagram in, we can click on the "Zoom to 100%" icon underneath the zoom bar so that the whole diagram fits inside the window:
Furthermore, if we had flagged certain threads, we can click on the Threads icon in the top of the window to see only the stacks for the flagged threads.
Features:
- Stack Frames
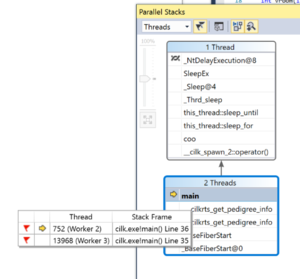
When we hover our mouse over any stack frame, we can see details about all the threads that are in the stack frame, and the corresponding code and line in the program.
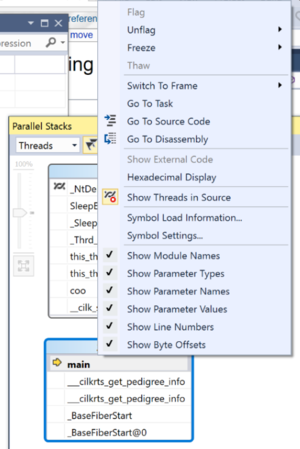
When we right click on a stack frame, we get a bunch of options:
The options are quite self-explanatory, of which some notable features include going to the source code for a stack frame, going to the Disassembly, flagging/unflagging a thread, or switching to that specific frame, where all of your views will focus on that frame.
Parallel Tasks window
Parallel Watch window
The Parallel Watch Window allows you to "watch" the values of an expression on multiple threads.
Setup:
1. When you start debugging (F5), click on Debug > Windows > Parallel Watch > and choose up to four Parallel Watch Windows, as you need.
2. Add in the column <Add Watch> any expressions you want to by typing it in, or right-clicking on the variable/method inside your code and clicking on "Add Parallel Watch".
How To Use:
The Parallel Watch Window is very simple to use. As you go through each breakpoint, the Window will show you the threads that are associated to the current stack frame, as well as the expression you have added to watch, and what the value is in that thread.
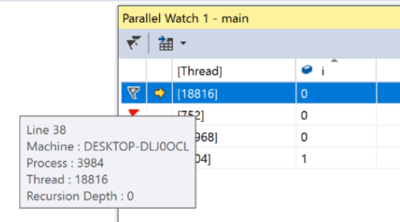
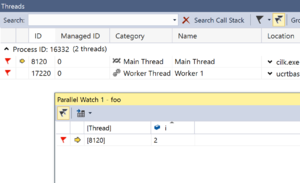
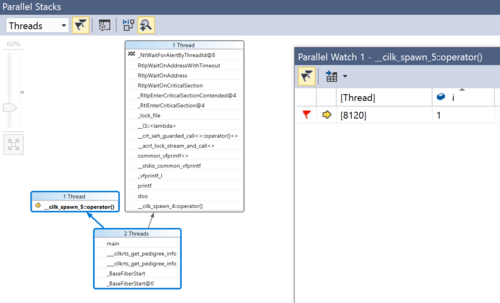
In the above Window, we can see that there are currently 4 different threads in the current stack frame, and the value for variable i in each of them. The yellow arrow points to the current active thread stack frame. You can choose to flag certain threads by clicking on the flag icon on the left, and you can choose to only watch flagged threads by clicking on the "Show Only Flagged" icon on the top left corner of the window.
If you hover your mouse over a row, you can see more information about that thread, such as the line in the code the stack frame is at and the process Id:
Features:
You can sort the threads according to an expression's value by clicking on the column header of the expression.
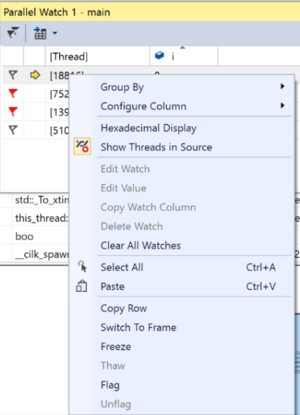
If you right-click on a row, you also have more functions, including grouping the threads by variable values, or even replacing a value of a variable right at that moment in the code.
On the top right corner, there is a box where you can put a Boolean expression on which the window will filter the threads. So in our example, if we put i == 1, it will only show the one thread that has i = 1.
GPU Threads window
Walkthrough
test environment: "visual studio 2015" with "Intel Parallel Studio XE 2016" with C++
Case A - Using the Thread Window and the Source Window
What can you see in the Thread window under OpenMP project? We will use the following program for the experiment.
// Thread.cpp

#include <iostream>
#include <omp.h>

using namespace std;

int main()
{
	printf("num of default usable thread is %d \n\n", omp_get_max_threads());

 			// serial ver
	 		printf("num of thread currently using is %d \n", omp_get_num_threads());

			printf("working thread num is %d \n", omp_get_thread_num());

		printf("\n");

#pragma omp parallel
	{
#pragma omp single  // set openMP ver
		{
			printf("num of thread currently using is %d \n", omp_get_num_threads());
		}
    	                printf("working thread num is %d \n", omp_get_thread_num());
	}
	    printf("\n");

#pragma omp parallel num_threads(8)
		{
#pragma omp single  // set openMP with num of threads ver
		{
			printf("num of thread currently using is %d \n", omp_get_num_threads());
		}
		        printf("working thread num is %d \n", omp_get_thread_num());
	}
		printf("\n");

	return 0;
}
To use OpenMP in visual studio, it is essential to turn on the OpenMP option. Debug> projectName option>C/C++>language>OpenMP support:YES
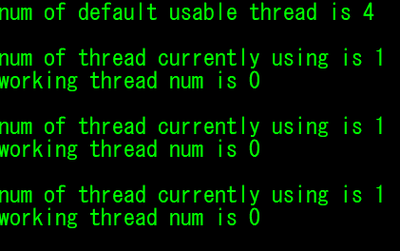
If the option was off, the result goes this. OpenMP doesn't work.
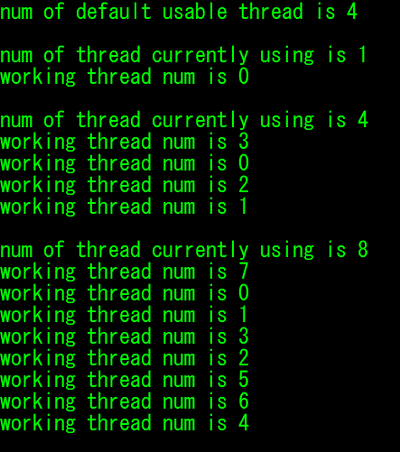
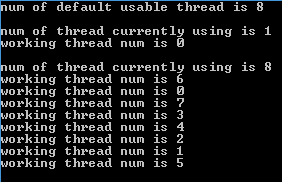
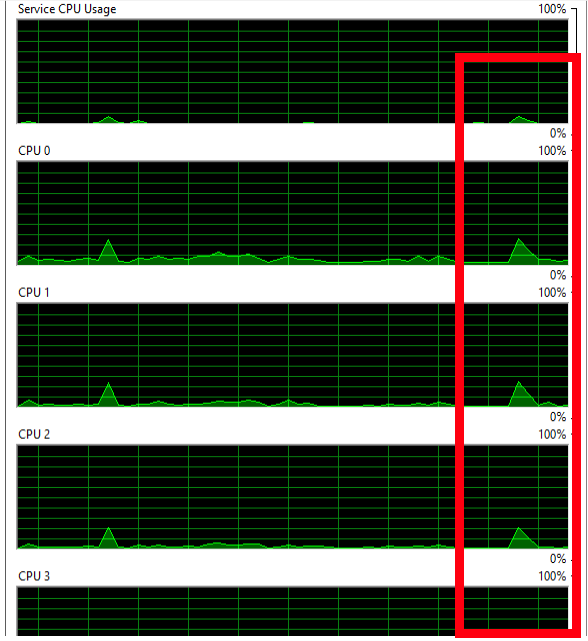
If the option was on, the result is this.
On a laptop coputer Intel® Core™ i7-6500U Processor/ Performance - # of Cores 2 #of Threads 4 [1]
On one of school desktop computer Intel® Core™ i7-4790 Processor / Performance - # of Cores 4 #of Threads 8 [2]
Abobe code consists of three part. The first is a serial region, the second is an OpenMP parallel region, the third is an OpenMP parallel region that thread number specified by the code TO check each region, we put markers on the lines that print the number of the thread currently using. Once click "start debugging", the debugger stops at the first breakpoint. You can chase the steps by using "Continue" button.
serial region
On the Threads window, you can see "main thread" line and some worker threads. The yellow arrow points only main thread. and go the next region. Apparently, ntdll.. threads are not used.
auto OpenMP parallel region
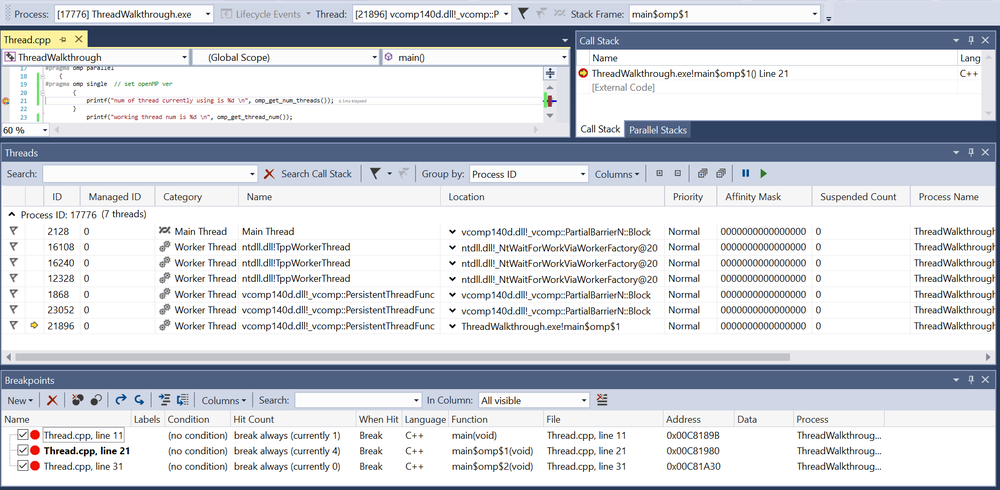
You can see "Stack Frame" name on the top screen is changed to main\omp\1 On the Threads window, you can see "main thread" and other new three thread which same as default usable thread number 4 (it is printed in the serial region as "omp_get_max_threads()"). after hitting 4 times (you can see the count on the breakpoint Window), the step goes to the next region.
OpenMP parallel region thread number specified (8)
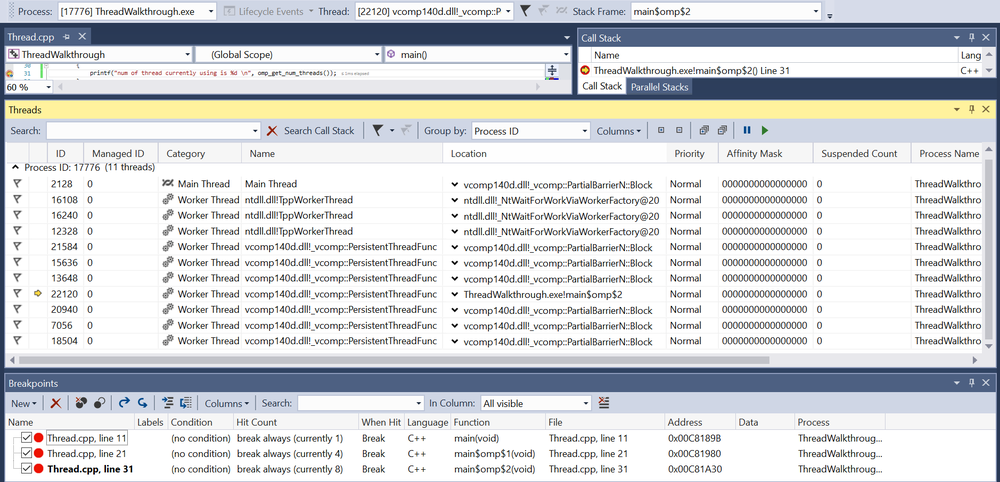
You can see "Stack Frame" name on the top screen is changed to main\omp\2 On the Threads window, you can see "main thread" and other new seven thread which same as the thread number decided inside of the code. after hitting 8 times, the debugging is terminated.
Case B - Using the Parallel Stacks and the Parallel Watch Window
We will use the following program, which uses cilk API for parallelization, to experiment with the Parallel Stacks and the Parallel Watch Window:
// cilkthreads.cpp

#include <iostream>
#include <cilk/cilk.h>
#include <cilk/cilk_api.h>
#include <thread>	// std::this_thread::sleep_for
#include <chrono>	// std::chrono::seconds

int foo(int i);
int boo(int i);
int coo(int i);
int doo(int i);
int zoo(int i);
int bla(int i);
int blo(int i);
int blu(int i);
int vroom(int i);
int beep(int i);
int screech(int i);
int woof(int i);
int meow(int i);
int oink(int i);
int zzz(int i);
int cough(int i);

int main() {
	int nwt = __cilkrts_get_nworkers();
	std::cout << "Number of workers is " << nwt << std::endl;

	int i = 1;

	cilk_spawn foo(i);
	cilk_spawn coo(i);
 	cilk_spawn boo(i);
	cilk_spawn doo(i);
	cilk_spawn zoo(i);

	foo(i);

	cilk_sync;

	return 0;
}

int foo(int i) {
	++i;
	int tid = __cilkrts_get_worker_number();
	std::this_thread::sleep_for(std::chrono::seconds(1));
	printf("Foo! from worker %d\n", tid);
	return i;
}

int boo(int i) {
	i += 5;
	int tid = __cilkrts_get_worker_number();
	std::this_thread::sleep_for(std::chrono::seconds(1));
	printf("Boo! from worker %d\n", tid);
	i = zzz(i);
	return i ;
}

int coo(int i) {
	i *= 10;
	int tid = __cilkrts_get_worker_number();
	std::this_thread::sleep_for(std::chrono::seconds(1));
	printf("Coo! from worker %d\n", tid);
	i = bla(i);
	return i;
}

int doo(int i) {
	i *= 100;
	int tid = __cilkrts_get_worker_number();
	std::this_thread::sleep_for(std::chrono::seconds(1));
	printf("Doo! from worker %d\n", tid);
	i = vroom(i);
	return i;
}

int zoo(int i) {
	--i;
	int tid = __cilkrts_get_worker_number();
	std::this_thread::sleep_for(std::chrono::seconds(1));
	printf("Zoo! from worker %d\n", tid);
	i = woof(i);
	i = meow(i);
	i = oink(i);
	return i;
}

int bla(int i) {
	i *= 3;
	int tid = __cilkrts_get_worker_number();
	printf("Bla bla! from worker %d\n", tid);
	i = blo(i);
	return i;
}

int blo(int i) {
	i += 4;
	int tid = __cilkrts_get_worker_number();
	printf("Blo Blo! from worker %d\n", tid);
	i = blu(i);
	return i;
}

int blu(int i) {
	i *= 7;
	int tid = __cilkrts_get_worker_number();
	printf("Blu Blu! from worker %d\n", tid);
 	return i;
}

int vroom(int i) {
	i += 5;
	int tid = __cilkrts_get_worker_number();
	printf("Vroom! from worker %d\n", tid);
	i = beep(i);
	return i;
}

int beep(int i) {
	i -= 2;
	int tid = __cilkrts_get_worker_number();
	printf("Beep beep! from worker %d\n", tid);
	i = screech(i);
	return i;
}

int screech(int i) {
	i -= 5;
 	int tid = __cilkrts_get_worker_number();
	printf("Screeeeeeeeechhhhhh! from worker %d\n", tid);
	return i;
}

int woof(int i) {
	i += 12;
	int tid = __cilkrts_get_worker_number();
	printf("Woof! from worker %d\n", tid);
	return i;
}

int meow(int i) {
	i *= 6;
	int tid = __cilkrts_get_worker_number();
	printf("Meow! from worker %d\n", tid);
	return i;
}

int oink(int i) {
	i++;
	int tid = __cilkrts_get_worker_number();
	printf("Oink! from worker %d\n", tid);
	return i;
}

int zzz(int i) {
	i -= 10;
	int tid = __cilkrts_get_worker_number();
	for (int i = 0; i < 10; i++) {
		cough(i);
	}
	printf("Zzzzzzzzz...... from worker %d\n", tid);
	return i;
}

int cough(int i) {
	i += 8;
	int tid = __cilkrts_get_worker_number();
	printf("cough! from worker %d\n", tid);
 	return i;
}
In the above code, the main program calls functions that may themselves call other functions. At each cilk_spawn keyword, we can expect a new child thread to call the function. However, if the functions have very short operations each, then the different spawns may not even be distributed to different child threads, since each function call may take very fast. That was originally the case, where all of the function calls were done by one thread. Therefore, the functions were adjusted to sleep for 1 second within the function itself. This way, the functions took long enough so that the program did spawn into multiple child threads.
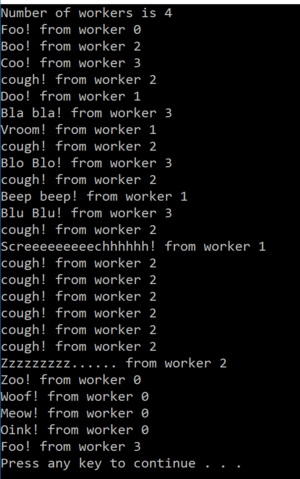
Here is the output of the program:
From the output, we can see that for this run, 4 different threads occupied the 6 function calls. In order of the function calls in the code, worker 0 took foo(), worker 3 took coo(), worker 2 took boo(), worker 1 took doo(), worker 0 took zoo(), and finally worker 3 took the remaining foo() function. Worker 0 in this case actually refers to the Main Thread.
The Parallel Stacks Window allows us to see the call stack information for all active threads at any point in our program.
Setup:
1. Put a breakpoint at all function calls, all function definitions, and cilk_sync.
Walkthrough:
First function call:
At our first function call at
cilk_spawn foo(i);
we can see in the Threads window the Main Thread, with a yellow arrow pointing at it :
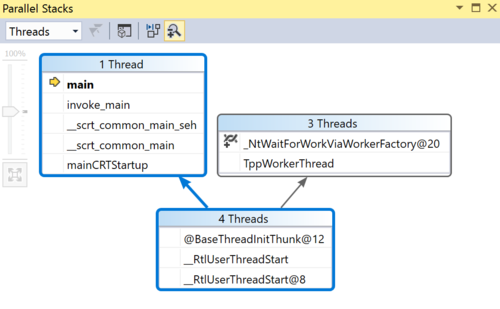
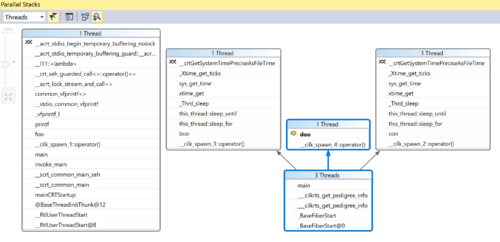
and the respective view for Parallel Stacks:
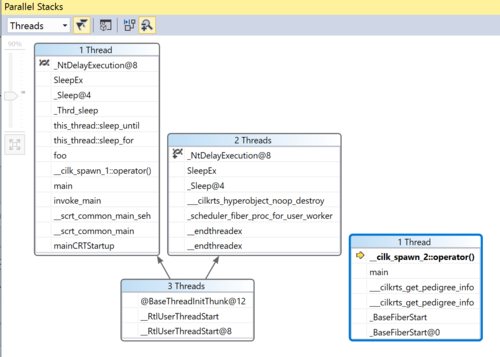
In the above, the blue-highlighted boxes refer to the call stack of the current thread, which is Main Thread, indicated by the yellow arrow. The program begins with 4 threads; 1 splits off into what is our Main Thread, and the other 3 split off elsewhere.
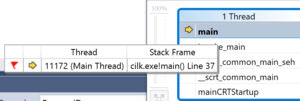
We can hover our mouse over any row in the boxes to get more info:
Hovering above "main" in the Main "1 Thread", we can see which line in the code the current stack frame is at.
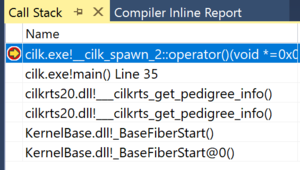
As we keep hitting F5, we go through each stack frame at the point of our breakpoints. Here, our foo(i) function was executed. We can see the sleep_for function that was executed, all within the Main thread:
At this point, another thread has begun. We can see "Worker 3" has started in the Threads window:
And if we double click on it, the focus will shift to its call stack in the Parallel Stacks window:
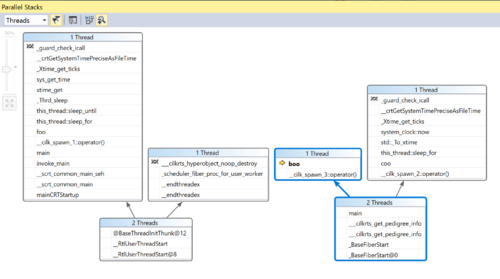
To clear out the other threads from the program which have nothing to do with our cilk spawned threads, we can flag the threads we want in the Threads window, and then click on the flags icon at the top of the Parallel Stacks Window, which will just show the call stacks of the flagged threads:
From this point forward, we will just view the call stacks for the threads which we are flagging, which are the Main Thread, and the 3 worker threads.
Second function call:
cilk_spawn coo(i)
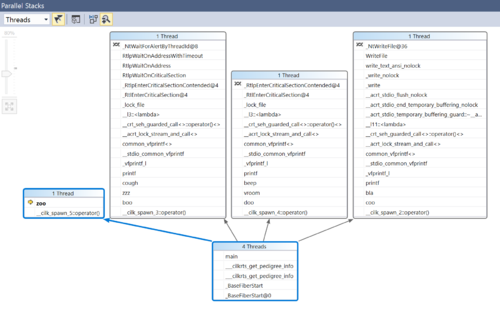
Now Worker 3 has taken the next spawned thread, which we can see the call stack highlighted in blue:
Also, the middle box indicates the 2 threads, Worker 1 and Worker 2, which seem to just be waiting for work. Main Thread on the left also seems to be just waiting.
Third function call:
cilk_spawn boo(i);
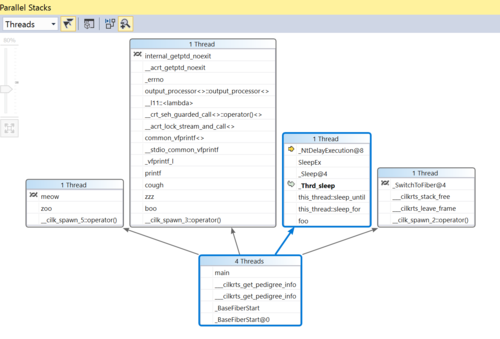
Now Worker 1 has taken charge of the next spawned thread, highlighted in blue:
Fourth function call:
cilk_spawn doo(i);
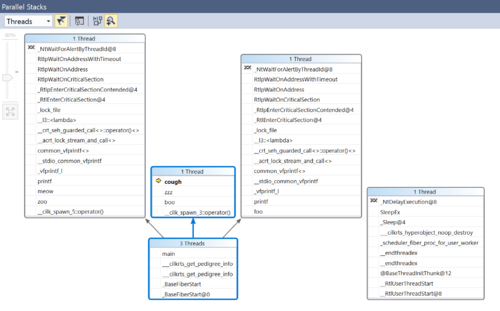
Finally, Worker 2 picks up the next spawned thread:
At this point, the Main thread, in function foo, has already printed its line.
Fifth function call:
cilk_spawn zoo(i);
Finally, the Main thread is available and picks up the next spawned thread, which is a call to zoo function.
As we had stepped to the breakpoint set at each function definitions, we saw that Worker 1's stack call had gone from boo(i), to zzz(i) to cough(i), Worker 2 had gone from doo(i) to vroom(i) to beep(i), and Worker 3's had gone from coo(i) to bla(i).
Sixth function call:
foo(i);
The next thread to free up was Worker 2, which snatched up the call to function foo() since it was available.
Worker 3 is free:
Now, Worker 3 has finished its work and is just waiting, as shown in the rightmost box:
Syncing up:
cilk_sync;
At this point, all spawned threads have synced up, as indicated in the right box, and the Main Thread continues, on the left side box.
The Parallel Stacks Window is a valuable tool in debugging multi-threaded applications as we can have a view of all threads at once and their call stacks in any given time. It allows us to see the delegation of work to different threads as they are made free and as they are indicated by the compiler to work.
Now we will use the Parallel Watch Window to view the variable i, and its value in the different threads as we go through the stack frames as determined by our breakpoints.
Setup:
1. After starting debug (F5), open a Parallel Watch Window, and add i into an <Add Watch> column.
2. Since we also want to see how variable i changes inside each of the functions, on top of the previous breakpoints we placed as in the above walkthrough, we will place more breakpoints, one at each of the return statements in each of the functions. That way we will be able to see the parameter value when it first entered the function, and how it leaves the function.
Walkthrough:
First Function Call:
cilk_spawn foo(i);
At this breakpoint, we can see Main Thread has taken up the spawned thread, and thread id is 8120.
In our Parallel Watch window, the thread is active, and we can see that the value of i is 1. When we hover our mouse over the value, we can see the previous value, which is a random int because that was the value before it was initialized.
Second Function Call:
cilk_spawn coo(i);
When we arrive at the breakpoint of the next function call, we can see thread 20168 in the Parallel Watch window. If we refer back to the Thread window, we can see that this is Worker 2.
The stack frame is based on the main method, so we see the Main Thread's i value, which is 1; meanwhile, Worker 2's i value hadn't been set yet at this point in the stack frame. But when we continue to the next breakpoint, which if we look at the Call Stack Window, we can see the cilk_spawn call being executed, the i value is set to 1.
As we step through each breakpoint, we see the same thing happen with the other worker threads once they pick up a function call, but although the i value gets set once they enter the functions of each of the different calls, when the stack frame goes back to the main method to get ready to call the next function, we don't see the i value as 1 for all threads, because the stack frame from the main method only sees the Main Thread's i set as 1, from the main method. The Parallel Watch only lets us see the pertinent threads for the current stack frame we are on. So we will only see all threads in the same window if we are on a stack frame that belongs from the main method. But as we step into a stack frame that is within one of the functions, we will see the thread that is handling that function, and the i value at that point. This window is not like the Parallel Stacks window where you can see all threads' positions simultaneously.
As we step to the breakpoint that is the return line for the foo(i) function, which Main Thread was working on, we can see the changed value for i:
Foo() had incremented i by 1.
Now let's say we don't care to see all threads based on all of the breakpoints we had put. Let's say we just want to focus on the Main Thread's work, as well as the thread that took the doo(i) function, which according to the Parallel Stacks Window, we can see Worker 1 took up. So in the Threads we will flag those two threads:
And then in our Parallel Watch Window, we will check on the Flag icon in the top corner, which will only watch the threads we have flagged:
Now, we can only focus on the i values for Main Thread and Worker 1. As we step through each breakpoint, the Parallel Watch Window will only show rows that have to do with any of our flagged threads.
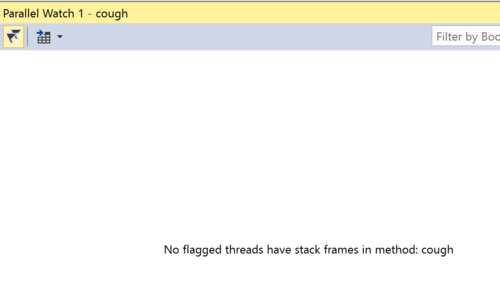
We can see that in this stack frame, which is in method cough(i), nothing shows because our two flagged threads don't have that stack frame.
Following Main Thread and Worker 1:
Finally, when we hit the breakpoint where zoo(i) gets called, we can see Main Thread picking up the work, and the value of i upon entering the function is set to 1.
The Parallel Stacks Window also shows just our flagged threads. The blue highlighted boxes are Main Thread's stack, and the right box is Worker 1' stack.
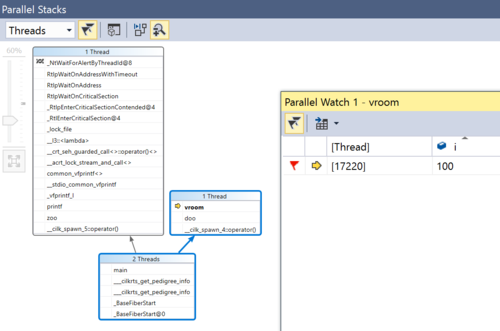
We keep stepping through the breakpoints. Next, we see Worker 1's next stack frame, which is the point where it calls vroom(i) from within doo(i).
At this point, the value of i is 100. At doo(), it had been multiplied by 100.
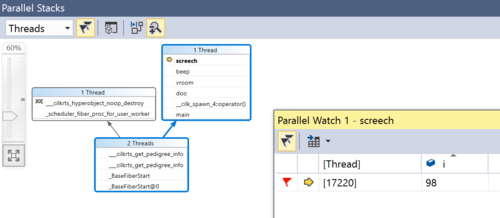
We keep pressing F5 and see as Main Thread calls woof, meow and oink from doo and see its i value changes, and Worker 1 calls beep, then screech, making the appropriate i changes.
The Parallel Watch Window is great for seeing variables' values in multiple threads, or seeing specific threads and the variables they deal with. This would be good for tracking how a variable changes in a particular thread, especially in very complex calculations where it's easy to lose track of each thread's work.
Case C
We will use the following 2 programs to debugg 2 processes.
Each of these programs will be a separate project.
There are two methods to debug multiple processes.
Start Multiple Projects
First we need to put both of there projects in the same solution.
To do this we must:
1.Right Click Project Solution
2.Go to "Add", then pick "Add Existing Project"
3.Navigate to the 2nd project's project file and open it
PIC
Next we will have to set the 2nd project to start up with the 1st project
To do this we must:
1.Right Click Project Solution
2.Select Set Startup Projects
3.On the Solution Propert Pages Window, Select Multiple startup projects
4.Select Start as the action for the 2nd Project
- Note:The Projects will execute in order shown
PIC
Now when we run the debugger, it will run both projects as a seperate process.
Attach debugger to background process
First we must run the 2nd project without the debugger (VS 2017 will not allow you to attach a running process that is using the debugger)
1.Select Tools and pick External Tools
2.Click add on the External Tools
3.Give it a name and set command to C:\Windows\System32\cmd.exe
4.Apply changes and then under tools, select your commandline tool
5.In the commandline, navigate to the 2nd project's debug folder
6.In the commandline, type the name of the 2nd project with the .exe extension
Now that your process is running, You can attach the debugger to it
To do this:
1.Select Debug and pick Attach to Process
2.In the Attach to Process window, select 2nd project's process and click attach
Now your debugger will run the 1st project with 2nd project as a seperate process
