Difference between revisions of "OpenMP Debugging in Visual Studio / Team Debug"
(→Case B - Using the Parallel Stacks Window) |
(→Case B - Using the Parallel Stacks Window) |
||
| Line 373: | Line 373: | ||
At our first breakpoint, at | At our first breakpoint, at | ||
cilk_spawn foo(); | cilk_spawn foo(); | ||
| − | we can see in the Threads window the Main Thread: | + | we can see in the Threads window the Main Thread, with a yellow arrow pointing at it : |
[[File:Stacks-step1-threads.PNG|500px|center|Step 1 - threads]] | [[File:Stacks-step1-threads.PNG|500px|center|Step 1 - threads]] | ||
and the respective view for Parallel Stacks: | and the respective view for Parallel Stacks: | ||
[[File:Stacks-step1.PNG|500px|center|Step 1 - stacks]] | [[File:Stacks-step1.PNG|500px|center|Step 1 - stacks]] | ||
| + | |||
| + | In the above, the blue-highlighted boxes refer to the call stack of the current thread, which is Main Thread, indicated by the yellow arrow. The program begins with 4 threads; 1 splits off into what is our Main Thread, and the other 3 split off elsewhere.<br/> | ||
| + | We can hover our mouse over any row in the boxes to get more info: | ||
| + | [[File:Stacks-step1-hover.PNG|300px|center|Step 1 - stacks]] | ||
| + | Hovering above "main" in the Main "1 Thread", we can see which line in the code the current stack frame is at. | ||
| + | |||
| + | As we keep hitting F5, we go through each stack frame as determined by our breakpoints. Here, our foo() function was executed. We can see the sleep_for function that was executed, all within the Main thread: | ||
| + | [[File:Stacks-step1b.PNG|500px|center|Step 1b - stacks]] | ||
| + | |||
| + | At this point, another thread has begun. We can see "Worker 3" has started in the Threads window: | ||
| + | [[File:Stacks-step1b-threads.PNG|500px|center|Step 1b - Worker 3]] | ||
| + | |||
| + | And if we double click on it, the focus will shift to its call stack in the Parallel Stacks window: | ||
| + | [[File:Stacks-step1b-worker3.PNG|500px|center|Step 1b - Worker 3]] | ||
==Case C== | ==Case C== | ||
Revision as of 18:12, 5 December 2017
Group Members
please feel free to change the contents' depth!!!
test1
test
Processes(Rough)
Processes Why would you have multiple projects in one solution? https://stackoverflow.com/questions/8678251/benefits-of-multiple-projects-and-one-solution
- services
- custom setup actions
- working multiple languages
- creating libraries used in different places
- large programs could be made up of many smaller projects for better management
- working with multiple applications that interact with each other
Configuration
https://msdn.microsoft.com/en-us/library/jj919165.aspx
By default breaking/stepping/stopping applies to all other processes, but can be changed if you needed.
In order to add a new process you need to find the .pdb files.
The debugger needs access to these files of the processes
.pdb file holds the debugging and project state info that’s created on compile
Multiple processes
Each project is an individual process
If you have more than one project in a project solution, you can choose which projects the debugger starts
You could also attach a process outside of the debugger to the debugger, including processes on a remote device but your inspection ability is limited
You could also set process to automatically start in the debugger – useful for services and custom setup actions
When you have multiple processes, only one process is active in the debugger, but in order to switch between processes, you must be in break mode
When you switch to a process, all windows will show information for that process only
When you stop debugging, if the current process was launched from the debugger it will terminate, however if you attached the debugger to the current process (attach to a process outside of vs2017), the debugger will detach and leave that process running
Background
How can we debug the parallel program? bra bra bra... Our test environment is "visual studio 2015" and "Intel Parallel Studio XE 2016"
User Interface
Attach to Process dialog box
Processes window
-shortcut
-how to open
-description/How to use
-info you can see
-what is attach
-what is detach
Threads window
-shortcut
-how to open
-description/how to use
-info you can see
Source window
Debug Location toolbar
Parallel Stacks window
The Parallel Stacks Window shows call stack information for all the threads in your application. You can focus on different threads and see the stack frames for them.
Setup:
1. When you start debug (F5), click on Debug > Windows > Parallel Stacks.
2. To be able to see more detailed debug info in the Parallel Stacks Window, go to Debug > Options, and under Debugging > General uncheck "Enable Just My Code", and under Debugging > Symbols put a checkmark on "Microsoft Symbol Servers".
Parallel Tasks window
Parallel Watch window
GPU Threads window
Walkthrough
Case A
How to use Process window and thread window under multiple OpenMP project
1. set OpenMP
2. create multiple subprojects in one project
3. set up multiple start up
4. how debug windows shows the status of multiple projects
5. how you can use each tool to find helpful info
project1: test1.cpp
#include <iostream>
using namespace std;

int main() {

#pragma omp parallel
	{
#pragma omp for

	for (int i = 0; i < 10; i++)

	     cout << " now i at test1= " << i << endl;
	}
}
Project2: test2.cpp
#include <iostream>
using namespace std;

int main() {

#pragma omp parallel
	{
#pragma omp for

	for (int j = 0; j < 10; j++)

	     cout << " now j at test2= " << j << endl;
	}
}
Case B - Using the Parallel Stacks Window
We will use the following program to experiment with the Parallel Stacks Window:
// cilk threads

#include <iostream>
#include <cilk/cilk.h>
#include <cilk/cilk_api.h>
#include <thread>	// std::this_thread::sleep_for
#include <chrono>	// std::chrono::seconds

void foo();
void boo();
void coo();
void doo();
void zoo();
void bla();
void blo();
void blu();
void vroom();
void beep();
void screech();
void woof();
void meow();
void oink();
void zzz();
void cough();

int main() {
	int i = 12;

	int nwt = __cilkrts_get_nworkers();
	std::cout << "Number of workers is " << nwt << std::endl;


	int a = 1;

	cilk_spawn foo();
	cilk_spawn coo();
	cilk_spawn boo();
	cilk_spawn doo();
	cilk_spawn zoo();

	foo();

	cilk_sync;


	#pragma cilk grainsize = 3
	cilk_for(int i = 0; i < 10; i++) {
		bla();
	}

	return 0;
}

void foo() {
	int tid = __cilkrts_get_worker_number();
	std::this_thread::sleep_for(std::chrono::seconds(1));

	printf("Foo! from worker %d\n", tid);

	return;
}

void boo() {
	int tid = __cilkrts_get_worker_number();
	std::this_thread::sleep_for(std::chrono::seconds(1));

	printf("Boo! from worker %d\n", tid);

	zzz();
	return;
}

void coo() {
	int tid = __cilkrts_get_worker_number();
	std::this_thread::sleep_for(std::chrono::seconds(1));

	printf("Coo! from worker %d\n", tid);

	bla();
	return;
}

void doo() {
	int tid = __cilkrts_get_worker_number();
	std::this_thread::sleep_for(std::chrono::seconds(1));

	printf("Doo! from worker %d\n", tid);

	vroom();
	return;
}

void zoo() {
	int tid = __cilkrts_get_worker_number();
	std::this_thread::sleep_for(std::chrono::seconds(1));

	printf("Zoo! from worker %d\n", tid);

	woof();
	meow();
	oink();
	return;
}

void bla() {
	int tid = __cilkrts_get_worker_number();

	printf("Bla bla! from worker %d\n", tid);

	blo();
	return;
}

void blo() {
	int tid = __cilkrts_get_worker_number();

	printf("Blo Blo! from worker %d\n", tid);

	blu();
	return;
}

void blu() {
	int tid = __cilkrts_get_worker_number();

	printf("Blu Blu! from worker %d\n", tid);

	return;
}

void vroom() {
	int tid = __cilkrts_get_worker_number();

	printf("Vroom! from worker %d\n", tid);

	beep();
	return;
}

void beep() {
	int tid = __cilkrts_get_worker_number();

	printf("Beep beep! from worker %d\n", tid);

	screech();
	return;
}

void screech() {
	int tid = __cilkrts_get_worker_number();

	printf("Screeeeeeeeechhhhhh! from worker %d\n", tid);

	return;
}

void woof() {
	int tid = __cilkrts_get_worker_number();

	printf("Woof! from worker %d\n", tid);

	return;
}

void meow() {
	int tid = __cilkrts_get_worker_number();

	printf("Meow! from worker %d\n", tid);

	return;
}

void oink() {
	int tid = __cilkrts_get_worker_number();
	printf("Oink! from worker %d\n", tid);
	return;
}

void zzz() {
	int tid = __cilkrts_get_worker_number();
	for (int i = 0; i < 10; i++) {
		cough();
	}
	printf("Zzzzzzzzz...... from worker %d\n", tid);

	return;
}

void cough() {
	int tid = __cilkrts_get_worker_number();

	printf("cough! from worker %d\n", tid);

	return;
}
In the above code, the main program calls functions that may themselves call other functions. At each cilk_spawn keyword, we can expect a new child thread to call the function. However, if the function have very short operations each, then the different spawns may not even be distributed to different child threads, since each function call may take very fast. That was originally the case, where all of the function calls were done by one thread. Therefore, the functions were adjusted to sleep for 1 second within the function itself. This way, the functions took long enough so that the program did spawn into multiple child threads. The Parallel Stacks window allows us to see the call stack information for all active threads at any point in our program.
Setup:
1. Put a breakpoint at all function calls, all function definitions, cilk_sync, and cilk_for.
Walkthrough:
Step 1)
At our first breakpoint, at
cilk_spawn foo();
we can see in the Threads window the Main Thread, with a yellow arrow pointing at it :
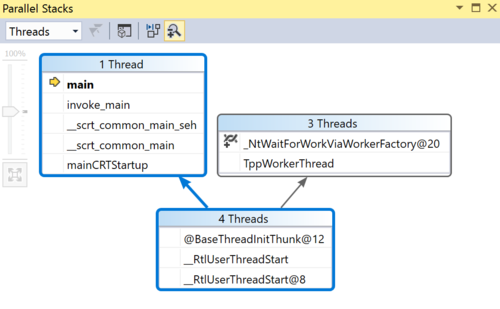
and the respective view for Parallel Stacks:
In the above, the blue-highlighted boxes refer to the call stack of the current thread, which is Main Thread, indicated by the yellow arrow. The program begins with 4 threads; 1 splits off into what is our Main Thread, and the other 3 split off elsewhere.
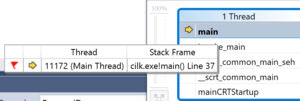
We can hover our mouse over any row in the boxes to get more info:
Hovering above "main" in the Main "1 Thread", we can see which line in the code the current stack frame is at.
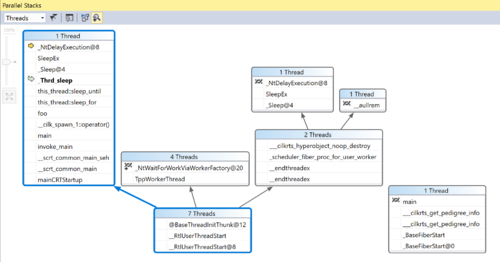
As we keep hitting F5, we go through each stack frame as determined by our breakpoints. Here, our foo() function was executed. We can see the sleep_for function that was executed, all within the Main thread:
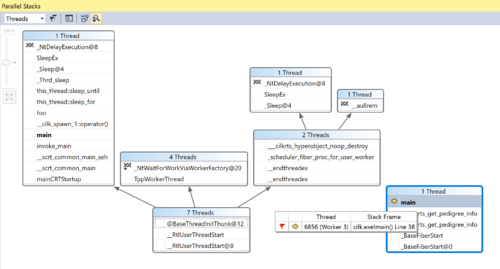
At this point, another thread has begun. We can see "Worker 3" has started in the Threads window:
And if we double click on it, the focus will shift to its call stack in the Parallel Stacks window:


