Difference between revisions of "GPU621/Striking"
(→Progress) |
(→Progress) |
||
| (13 intermediate revisions by the same user not shown) | |||
| Line 3: | Line 3: | ||
== Group Members == | == Group Members == | ||
| − | #Eunju Han [mailto:ejhan4@myseneca.ca?subject=GPU621%20from%20CDOT%20Wiki] Research | + | #Eunju Han [mailto:ejhan4@myseneca.ca?subject=GPU621%20from%20CDOT%20Wiki] Research and Demo. |
| − | #Lei(Eric) Zhang [mailto:lzhang216@myseneca.ca?subject=GPU621%20from%20CDOT%20Wiki] ( | + | #<nowiki>Lei(Eric) Zhang</nowiki> [mailto:lzhang216@myseneca.ca?subject=GPU621%20from%20CDOT%20Wiki] Research etc. ('''He dropped the course.''') |
== Progress == | == Progress == | ||
| Line 24: | Line 24: | ||
*[https://software.intel.com/en-us/forums/debug-solutions/topic/515990 Intel Parallel Debugger Extension has been deprecated?] | *[https://software.intel.com/en-us/forums/debug-solutions/topic/515990 Intel Parallel Debugger Extension has been deprecated?] | ||
| − | '''Nov 14th - | + | While I studied this Intel Parallel Debugger Extension, I needed to learn more about Parallel Studio version. |
| + | |||
| + | Links about Intel® Parallel Studio XE 2017 | ||
| + | |||
| + | #[https://software.intel.com/en-us/intel-parallel-studio-xe link1 Intel® Parallel Studio XE 2017] | ||
| + | #[http://www.adeptscience.co.uk/products/cpp/intel-parallel-studio-xe link2 Intel® Parallel Studio XE 2017] | ||
| + | #[https://software.intel.com/en-us/articles/intel-parallel-studio-xe-release-notes link Intel® Parallel Studio XE Release Notes] | ||
| + | |||
| + | ---- | ||
| + | '''Nov 14th - 17th:''' | ||
*Links about Debug Multithreaded Applications in Visual Studio | *Links about Debug Multithreaded Applications in Visual Studio | ||
| Line 47: | Line 56: | ||
---- | ---- | ||
| + | '''Nov 18th - 23th:''' | ||
'''Sample code to use debugging''' | '''Sample code to use debugging''' | ||
| Line 53: | Line 63: | ||
The debugging example below is used for five odd numbers to be sorted. This is the easiest way to figured out how the threads work together with the simple data. | The debugging example below is used for five odd numbers to be sorted. This is the easiest way to figured out how the threads work together with the simple data. | ||
| + | <table border="0" width="800"> | ||
| + | <tr> | ||
| + | <td width="360" align="top"> | ||
*How to start debugging | *How to start debugging | ||
| + | |||
The following sequence may guides you start to debug on the visual Studio. | The following sequence may guides you start to debug on the visual Studio. | ||
# put breakpoints where you want to take a look by hitting the key F9 in the line or left-click at the front of a line | # put breakpoints where you want to take a look by hitting the key F9 in the line or left-click at the front of a line | ||
# Run the program in Debug mode by hitting the green button (or key F5) | # Run the program in Debug mode by hitting the green button (or key F5) | ||
| − | # Go to the menu Debug -> Windows to open the windows you need | + | # Go to the menu Debug -> Windows to open the windows you need ( see the image on your right) |
# Choose the windows that you need (e.g. Memory, Threads, Parallel Stacks, Local or Auto and so on.) | # Choose the windows that you need (e.g. Memory, Threads, Parallel Stacks, Local or Auto and so on.) | ||
| − | # Hit the function keys to run a program | + | # Hit the function keys to run a program: |
## F10 to run codes line by line (Step Over) | ## F10 to run codes line by line (Step Over) | ||
## F11 to go into a subroutine (Step Into) | ## F11 to go into a subroutine (Step Into) | ||
| Line 65: | Line 79: | ||
## F9 to put/remove breakpoints in a line | ## F9 to put/remove breakpoints in a line | ||
| + | |||
| + | |||
| + | |||
| + | |||
| + | |||
| + | </td> | ||
| + | <td width="440"> | ||
| + | To open windows you need for debugging on Visual Studio, You must run a program in debug mode first. Otherwise, there is no menu to open the windows. | ||
| + | [[File:debug_windows.png|440px|thumb|left|Menu Debug > Windows on VS 2015]] | ||
| + | </td> | ||
| + | </tr> | ||
| + | </table> | ||
*Sample code results | *Sample code results | ||
**Data flow of parallel_qsort | **Data flow of parallel_qsort | ||
<table border="0" width="800"> | <table border="0" width="800"> | ||
| − | <tr align="left"><td>[[File:dataflow.png| | + | <tr align="left"><td>[[File:dataflow.png|220px|thumb|left|Quick sorting dataflow]]</td> |
| − | <td> | + | <td> |
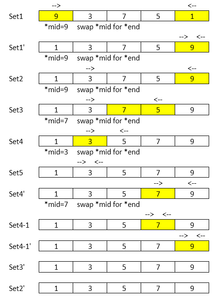
| + | Fist set of this quick sorting is that main thread worked for first half of all elements which starts *begin 9 to *end 1. The *mid value was 9 so it swapped *mid for *end. Since mid moved to end, the second half of all elements was the end to the end which only end value are to be sorted; the actual process will be skipped so no value is changed. | ||
| + | |||
| + | Next set of this is that second element(its value 3) to the last element (its value 9). The *mid value was 9 and swapping it for the *end which was same as before. | ||
| + | |||
| + | For the set 4-1 step, two Threads are working for this; Worker3 and Worker2 for two level parallel_qsort function calling and two level spawning call to parallel_qsort; values are already sorted so there was no swapping. | ||
| − | |||
| − | + | As you see the rest of the major steps indicated in the data flows diagram. | |
</td></tr> | </td></tr> | ||
| Line 98: | Line 128: | ||
---- | ---- | ||
| + | * Tip for Parallel program debugging | ||
| + | The followings will be a great approach to improve your debugging experience. | ||
| + | First of all, doing debugging yourself is the best, not just see the videos or friend's working how to do debugging. | ||
| − | + | # Understanding a program is important; using a serial program version, follow codes line by line to understand the program. (Parallel programming usually starts from a serial version.) | |
| − | + | # Use the simple data for the first time to keep track of data flow in a memory and then increase data volume for the program. | |
| − | # | + | # When you missed the step you want to take a look in run-time debug mode, it will be better to start from the beginning in debug mode as data situation have already changed, and threads invocation also has been passed. |
| − | # | + | # To open windows you need for debugging on Visual Studio, You must run a program in debug mode first. Otherwise, there is no menu to open the windows. |
| − | # | ||
Latest revision as of 13:52, 8 December 2016
Striking
Our project: Debugging Threads in Intel Parallel Studio
Group Members
Progress
Oct 17th:
- Picked topic
- Picked presentation date.
Oct 20th:
- Created Wiki page
Nov 6th - 13th:
- There are great resources about Intel Parallel Debugger Extension for Microsoft Visual Studio like below.
- Debugging Threads in Intel Parallel Studio - [Dr. Dobbs Article]
- Intel® Parallel Debugger Extension, Added Aug 2, 2012 - [[3]]
- Intel Parallel Composer Parallel Debugger Extension Tutorial - [Mittie Sylvian's Video]
However, Intel Parallel Debugger Extension has been deprecated from the version Intel Composer XE 2013 at the end of 2012. I have noticed this from the Intel User Forum.
While I studied this Intel Parallel Debugger Extension, I needed to learn more about Parallel Studio version.
Links about Intel® Parallel Studio XE 2017
- link1 Intel® Parallel Studio XE 2017
- link2 Intel® Parallel Studio XE 2017
- link Intel® Parallel Studio XE Release Notes
Nov 14th - 17th:
- Links about Debug Multithreaded Applications in Visual Studio
- How to: Use the Threads Window
- How to: Use the Parallel Watch Window
- Using the Parallel Stacks Window
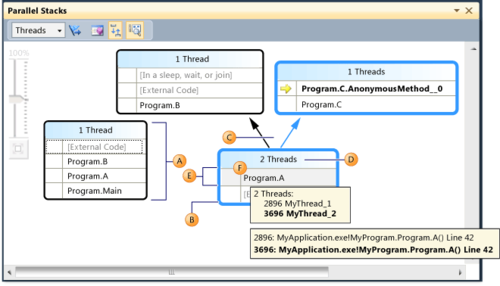
- Main features descriptions in Parallel Stacks window
| Callout Letter | Element Name | Description |
| A | Call Stack Segment or Node | Contains a series of method contexts for one or more threads. |
| B | Blue Highlight | Present the call path of the current thread. |
| C | Arrow lines | Connect nodes to make up the entire call path for the thread(s). |
| D | Tooltip on Node Header | Shows the ID and user-defined name of each thread whose call path shares this node. |
| E | Method Context | Represents one or more stack frames in the same method. |
Nov 18th - 23th:
Sample code to use debugging
- Sample code can be downloaded from here Intel(R) Cilk(TM) quick sort
The debugging example below is used for five odd numbers to be sorted. This is the easiest way to figured out how the threads work together with the simple data.
The following sequence may guides you start to debug on the visual Studio.
|
To open windows you need for debugging on Visual Studio, You must run a program in debug mode first. Otherwise, there is no menu to open the windows. |
- Sample code results
- Data flow of parallel_qsort
|
Fist set of this quick sorting is that main thread worked for first half of all elements which starts *begin 9 to *end 1. The *mid value was 9 so it swapped *mid for *end. Since mid moved to end, the second half of all elements was the end to the end which only end value are to be sorted; the actual process will be skipped so no value is changed. Next set of this is that second element(its value 3) to the last element (its value 9). The *mid value was 9 and swapping it for the *end which was same as before. For the set 4-1 step, two Threads are working for this; Worker3 and Worker2 for two level parallel_qsort function calling and two level spawning call to parallel_qsort; values are already sorted so there was no swapping.
|
- Parallel Stacks
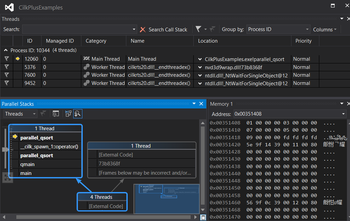
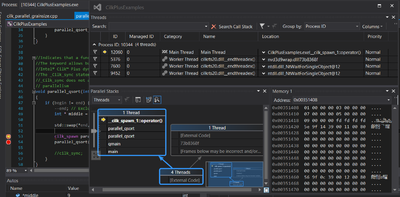
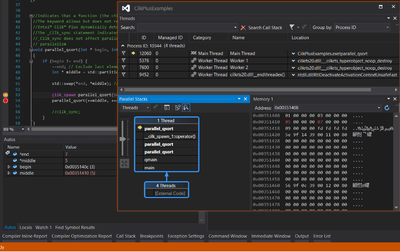
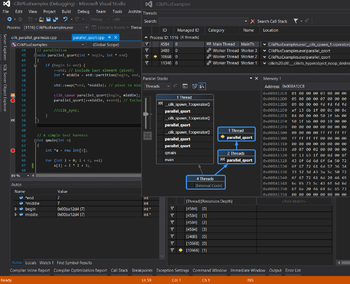
| Recursive calling parallel_qsort of spawning parallel_qsort in the first parallel_qsort function which main thread has responsible for | The moment right after a spawning thread works in second parallel_qsort calling which Main Thread had finished |
| The moment that Main Thread is working for getting out of the previous spawning thread calling to parallel_qsort and 3d and 4th element values in the data array are exchanging in memory. | For two level parallel_qsort function calling and two level spawning call to parallel_qsort, two Threads are working for this; Worker3 and Worker2 |
- Tip for Parallel program debugging
The followings will be a great approach to improve your debugging experience. First of all, doing debugging yourself is the best, not just see the videos or friend's working how to do debugging.
- Understanding a program is important; using a serial program version, follow codes line by line to understand the program. (Parallel programming usually starts from a serial version.)
- Use the simple data for the first time to keep track of data flow in a memory and then increase data volume for the program.
- When you missed the step you want to take a look in run-time debug mode, it will be better to start from the beginning in debug mode as data situation have already changed, and threads invocation also has been passed.
- To open windows you need for debugging on Visual Studio, You must run a program in debug mode first. Otherwise, there is no menu to open the windows.
