Difference between revisions of "GPU621/Striking"
(→Progress) |
(→Progress) |
||
| Line 17: | Line 17: | ||
'''Nov 6th - 13th:''' | '''Nov 6th - 13th:''' | ||
*There are great resources about Intel Parallel Debugger Extension for Microsoft Visual Studio like below. | *There are great resources about Intel Parallel Debugger Extension for Microsoft Visual Studio like below. | ||
| − | # Debugging Threads in Intel Parallel Studio - [[http://www.drdobbs.com/windows/intel-parallel-debugger-extension-for-mi/214502747 Dr Dobbs Article]] | + | # Debugging Threads in Intel Parallel Studio - [[http://www.drdobbs.com/windows/intel-parallel-debugger-extension-for-mi/214502747 Dr. Dobbs Article]] |
# Intel® Parallel Debugger Extension, Added Aug 2, 2012 - [[https://software.intel.com/en-us/articles/parallel-debugger-extension]] | # Intel® Parallel Debugger Extension, Added Aug 2, 2012 - [[https://software.intel.com/en-us/articles/parallel-debugger-extension]] | ||
# Intel Parallel Composer Parallel Debugger Extension Tutorial - [[https://www.youtube.com/watch?v=uo3kAhVQUcs Mittie Sylvian's Video]] | # Intel Parallel Composer Parallel Debugger Extension Tutorial - [[https://www.youtube.com/watch?v=uo3kAhVQUcs Mittie Sylvian's Video]] | ||
| Line 36: | Line 36: | ||
<tr><td>Callout Letter</td><td>Element Name</td><td>Description</td></tr> | <tr><td>Callout Letter</td><td>Element Name</td><td>Description</td></tr> | ||
<tr><td>A</td><td>Call Stack Segment or Node</td><td>Contains a series of method contexts for one or more threads. </td></tr> | <tr><td>A</td><td>Call Stack Segment or Node</td><td>Contains a series of method contexts for one or more threads. </td></tr> | ||
| − | <tr><td>B</td><td>Blue Highlight</td><td> | + | <tr><td>B</td><td>Blue Highlight</td><td>Present the call path of the current thread.</td></tr> |
<tr><td>C</td><td>Arrow lines</td><td>Connect nodes to make up the entire call path for the thread(s).</td></tr> | <tr><td>C</td><td>Arrow lines</td><td>Connect nodes to make up the entire call path for the thread(s).</td></tr> | ||
<tr><td>D</td><td>Tooltip on Node Header</td><td>Shows the ID and user-defined name of each thread whose call path shares this node.</td></tr> | <tr><td>D</td><td>Tooltip on Node Header</td><td>Shows the ID and user-defined name of each thread whose call path shares this node.</td></tr> | ||
| Line 53: | Line 53: | ||
<table border="1"> | <table border="1"> | ||
| − | <tr><td>[[File:qsort_set1.png|300px|thumb|left|alt qsort_set1]]</td><td></td></tr> | + | <tr><td>[[File:qsort_set1.png|300px|thumb|left|alt qsort_set1]]</td><td>Recursive calling parallel_qsort of spawning parallel_qsort in the first parallel_qsort function which main thread has responible for</td></tr> |
<tr><td>[[File:qsort_set2.png|300px|thumb|left|alt qsort_set2]]</td><td></td></tr> | <tr><td>[[File:qsort_set2.png|300px|thumb|left|alt qsort_set2]]</td><td></td></tr> | ||
<tr><td>[[File:qsort_set3.png|300px|thumb|left|alt qsort_set3]]</td><td></td></tr> | <tr><td>[[File:qsort_set3.png|300px|thumb|left|alt qsort_set3]]</td><td></td></tr> | ||
| Line 63: | Line 63: | ||
---- | ---- | ||
* Debugging Tips | * Debugging Tips | ||
| − | # Hit F9 at the front of a line to put the | + | # Hit F9 at the front of a line to put the breakpoints |
# Run the program in Debug mode first and then open the windows you need. | # Run the program in Debug mode first and then open the windows you need. | ||
# Open the windows like Memory, Threads, Parallel Stacks, and Local or Auto. | # Open the windows like Memory, Threads, Parallel Stacks, and Local or Auto. | ||
# Hit F10 or F11 to run codes line by line | # Hit F10 or F11 to run codes line by line | ||
| − | # F9 to put or remove | + | # F9 to put or remove breakpoints |
---- | ---- | ||
Revision as of 11:29, 8 December 2016
Striking
Our project: Debugging Threads in Intel Parallel Studio
Group Members
Progress
Oct 17th:
- Picked topic
- Picked presentation date.
Oct 20th:
- Created Wiki page
Nov 6th - 13th:
- There are great resources about Intel Parallel Debugger Extension for Microsoft Visual Studio like below.
- Debugging Threads in Intel Parallel Studio - [Dr. Dobbs Article]
- Intel® Parallel Debugger Extension, Added Aug 2, 2012 - [[3]]
- Intel Parallel Composer Parallel Debugger Extension Tutorial - [Mittie Sylvian's Video]
However, Intel Parallel Debugger Extension has been deprecated from the version Intel Composer XE 2013 at the end of 2012. I have noticed this from the Intel User Forum.
Nov 14th - 23th:
- Links about Debug Multithreaded Applications in Visual Studio
- How to: Use the Threads Window
- How to: Use the Parallel Watch Window
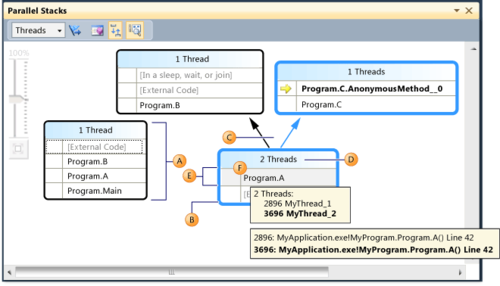
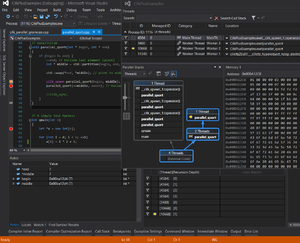
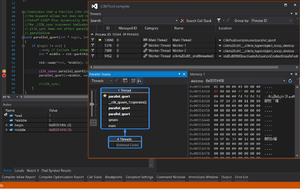
- Using the Parallel Stacks Window
| Callout Letter | Element Name | Description |
| A | Call Stack Segment or Node | Contains a series of method contexts for one or more threads. |
| B | Blue Highlight | Present the call path of the current thread. |
| C | Arrow lines | Connect nodes to make up the entire call path for the thread(s). |
| D | Tooltip on Node Header | Shows the ID and user-defined name of each thread whose call path shares this node. |
| E | Method Context | Represents one or more stack frames in the same method. |
Sample code to use debugging
- Sample code can be downloaded from here Intel(R) Cilk(TM) quick sort
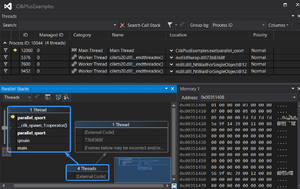
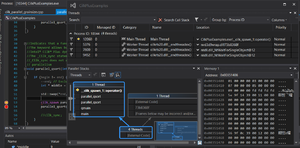
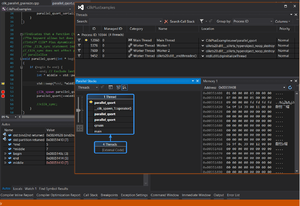
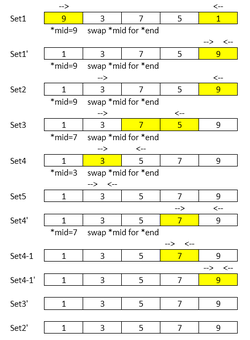
- Data flow of parallel_qsort
| Recursive calling parallel_qsort of spawning parallel_qsort in the first parallel_qsort function which main thread has responible for | |
- Debugging Tips
- Hit F9 at the front of a line to put the breakpoints
- Run the program in Debug mode first and then open the windows you need.
- Open the windows like Memory, Threads, Parallel Stacks, and Local or Auto.
- Hit F10 or F11 to run codes line by line
- F9 to put or remove breakpoints
Links about Intel® Parallel Studio XE 2017
