Difference between revisions of "GPU621 Team 1"
(→VTune Tutorial 1: Finding HotSpot) |
(→VTune Tutorial 1: Finding HotSpot) |
||
| Line 31: | Line 31: | ||
[[File:Tim Hotspt 4.png|400px]] | [[File:Tim Hotspt 4.png|400px]] | ||
| + | |||
After the program finish running, it will take a while for Amplifer to generate report. | After the program finish running, it will take a while for Amplifer to generate report. | ||
<br /> | <br /> | ||
| Line 36: | Line 37: | ||
[[File:Tim Hotspt 5.png|400px]] | [[File:Tim Hotspt 5.png|400px]] | ||
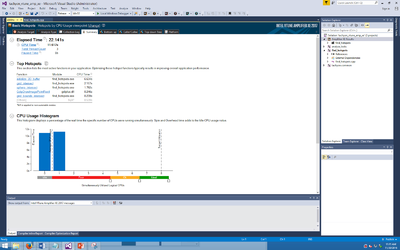
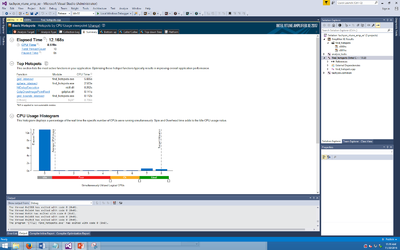
| − | The first page will shows | + | The first page will shows a summary of the program.The time it took, the top hotspots, CPU usage etc. We will focus looking at the Hotspots table. we notice that the "initialize_2D_buffer" use the most the CPU time. If you look at the code on ''find_hotspots.cpp'' you will notice it is actually one function in side that cpp file |
<br /> | <br /> | ||
[[File:Tim Hotspt 7.png|400px]] | [[File:Tim Hotspt 7.png|400px]] | ||
| − | + | ||
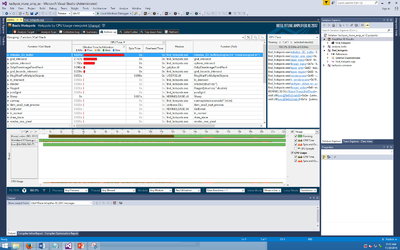
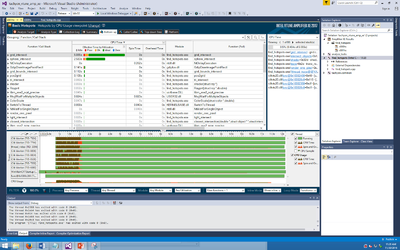
| + | We go to the bootom up tab. it will give you a graph that shows the Hotspots table you got. You can clearly see that "initialize_2D_buffer" use a lot | ||
<br /> | <br /> | ||
Revision as of 17:07, 30 November 2016
Contents
What is VTune Amplifier?
Where can you get it?
Getting Started
VTune Tutorial 1: Finding HotSpot
This example program will be downloaded when you install VTune Amplifier. Following is the directory that contain the sample code from Intel.
[Program Files]\IntelSWTools\VTune Amplifier XE <version>\sample
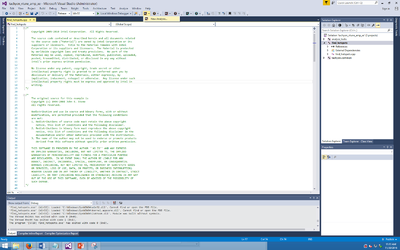
Open the project using Visual Studio. Then you can run the the VTune Amplifier and click new Analysis. (You need to download Vtune Amplifier to have that tab on Visual Studio)
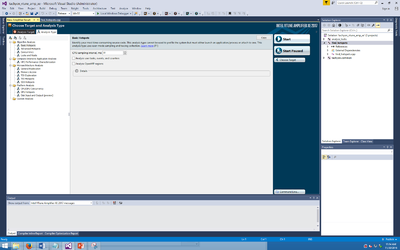
This should be the next page you will get. You begin to choose different type of Analysis here. We are going do a Basic Hotpots Analysis.Then click start to start the Analysis.
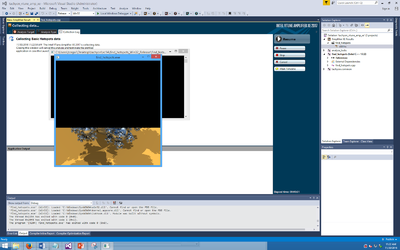
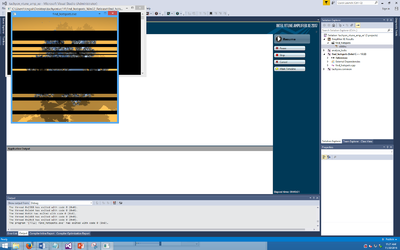
The program should run itself after you begin.You will notice that the image is loading from the bottom to the top. After the program finish running, it will take a while for Amplifer to generate report.
After the program finish running, it will take a while for Amplifer to generate report.
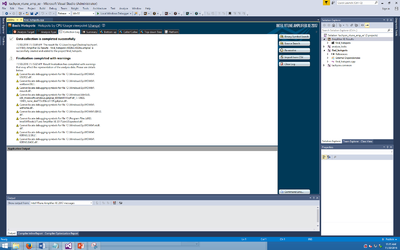
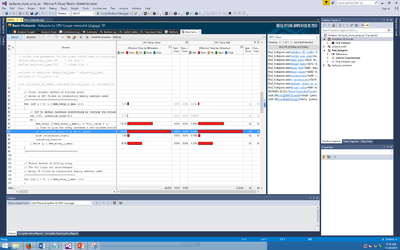
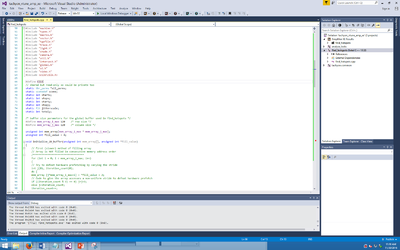
The first page will shows a summary of the program.The time it took, the top hotspots, CPU usage etc. We will focus looking at the Hotspots table. we notice that the "initialize_2D_buffer" use the most the CPU time. If you look at the code on find_hotspots.cpp you will notice it is actually one function in side that cpp file
We go to the bootom up tab. it will give you a graph that shows the Hotspots table you got. You can clearly see that "initialize_2D_buffer" use a lot
