Difference between revisions of "TeamC"
(→Assignment 1) |
(→Progress) |
||
| (2 intermediate revisions by the same user not shown) | |||
| Line 25: | Line 25: | ||
[[File:Chart.jpg]]<br> | [[File:Chart.jpg]]<br> | ||
| − | Chart | + | Chart<br><br> |
| + | As We can see the chart above, the graph increases as the execution time increase.<br> | ||
| + | Also it is possible to know that time complexity of calculation of Pi using Monte Carlo method is O(1) | ||
| + | |||
=== Assignment 2 === | === Assignment 2 === | ||
| + | As i chose "Calculation of Pi using Monte Carlo method" for the first assignment, i have parallelized it to run on custom kernel on CUDA device. | ||
| + | |||
| + | ==== '''Results''' ==== | ||
| + | [[File:1000000_2.jpg]]<br> | ||
| + | Number of points = 1 Million<br> | ||
| + | [[File:5000000_2.jpg]]<br> | ||
| + | Number of points = 5 Million<br> | ||
| + | [[File:10000000_2.jpg]]<br> | ||
| + | Number of points = 10 Million<br> | ||
| + | [[File:50000000_2.jpg]]<br> | ||
| + | Number of points = 50 Million<br> | ||
| + | [[File:100000000_2.jpg]]<br> | ||
| + | Number of points = 100 Million<br> | ||
| + | [[File:200000000_2.jpg]]<br> | ||
| + | Number of points = 200 Million<br> | ||
| + | |||
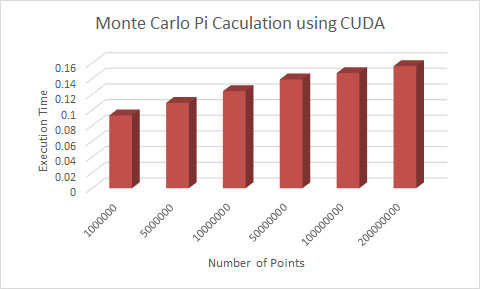
| + | [[File:chart_2.jpg]]<br> | ||
| + | Chart<br><br> | ||
| + | |||
| + | === '''Compare''' === | ||
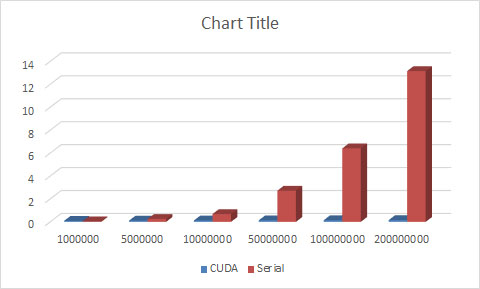
| + | [[File:Chart_both.jpg]]<br> | ||
| + | As we can see on the chart above, using parallel programming reduced the execution time dramatically as the number of points increases. | ||
=== Assignment 3 === | === Assignment 3 === | ||
Latest revision as of 18:22, 31 October 2014
GPU610/DPS915 | Student List | Group and Project Index | Student Resources | Glossary
Contents
Project "Break Pi"
Team Members
Progress
Assignment 1
Introduction
For the first assignment which is "Initial profiling", I chose "Calculation of Pi using Monte Carlo method" to profile.
Results

Number of points = 1 Million

Number of points = 5 Million

Number of points = 10 Million

Number of points = 50 Million

Number of points = 100 Million

Number of points = 200 Million

Chart
As We can see the chart above, the graph increases as the execution time increase.
Also it is possible to know that time complexity of calculation of Pi using Monte Carlo method is O(1)
Assignment 2
As i chose "Calculation of Pi using Monte Carlo method" for the first assignment, i have parallelized it to run on custom kernel on CUDA device.
Results

Number of points = 1 Million

Number of points = 5 Million

Number of points = 10 Million

Number of points = 50 Million

Number of points = 100 Million

Number of points = 200 Million
Compare

As we can see on the chart above, using parallel programming reduced the execution time dramatically as the number of points increases.
